. 2021 Nov;7(11):000691.
doi: 10.1099/mgen.0.000691.

Bacterial genomic epidemiology with mixed samples

Affiliations

Bacterial genomic epidemiology with mixed samples

Tommi Mäklin et al. Microb Genom. 2021 Nov.

Abstract

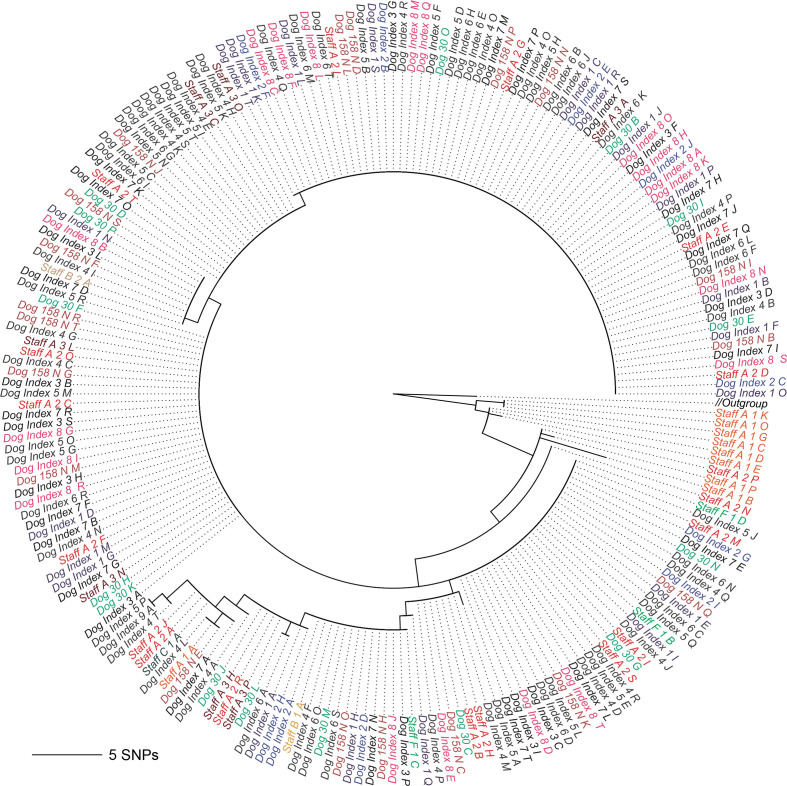
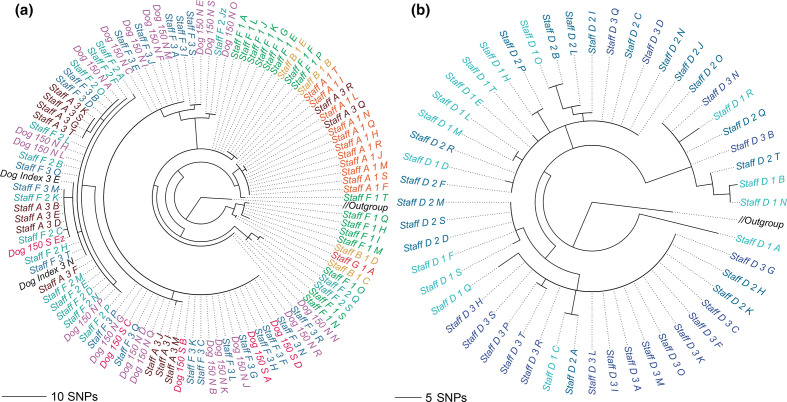
Genomic epidemiology is a tool for tracing transmission of pathogens based on whole-genome sequencing. We introduce the mGEMS pipeline for genomic epidemiology with plate sweeps representing mixed samples of a target pathogen, opening the possibility to sequence all colonies on selective plates with a single DNA extraction and sequencing step. The pipeline includes the novel mGEMS read binner for probabilistic assignments of sequencing reads, and the scalable pseudoaligner Themisto. We demonstrate the effectiveness of our approach using closely related samples in a nosocomial setting, obtaining results that are comparable to those based on single-colony picks. Our results lend firm support to more widespread consideration of genomic epidemiology with mixed infection samples.

Keywords: genomic epidemiology; pathogen surveillance; plate sweeps; probabilistic modelling; pseudoalignment.


Conflict of interest statement

The authors declare that there are no conflicts of interest.

Figures

Fig. 1.
Fig. 1.
Flowchart describing a genomic epidemiology workflow with the mGEMS pipeline. The figure shows the various steps of the pipeline. Steps with programme names in brackets constitute the parts of the mGEMS pipeline. Presented values from mSWEEP and mGEMS binner are the actual results of running the pipeline with the described input.
Fig. 2.
Fig. 2.
Evaluating mGEMS and mSWEEP on the in vitro benchmark data. Panels (a) E. coli and (b) E. faecalis compare the results of SNP calling from the isolate sequencing data (horizontal axis) against the results of SNP calling from the mixed samples with the mGEMS pipeline (vertical axis). The subplot in panel (b) contains a zoomed-in view of the points around the origin. Panels (c) and (d) compare the abundance estimates from mSWEEP to the ground truth relative abundances. Panel (c) shows the absolute difference between the estimates from mSWEEP and the true abundance. The values shown are split into E. coli and E. faecalis lineages truly present in the samples, and lineages truly absent. Panel (d) shows the relative error in the truly present lineages.
Fig. 3.
Fig. 3.
Comparing mGEMS and synthetic mixtures with isolate sequencing data. Panels a–c compare the results of SNP calling from mixed samples with the mGEMS pipeline against the results from isolate sequencing data. Panel d compares reference-free assembly statistics from mGEMS pipeline with different assemblers against the results from assembling the isolate sequencing data with Shovill. The results in panel a are for the E. coli ST131 isolates, panel b the E. faecalis isolates, and panel c the S. aureus ST22 isolates. In panels a and b, SNPs were called from contigs after assembling the reads. In panel c, the SNPs were called directly from the reads. Points are colored according to the lineage within the species (the full legend is available in Fig. S3). The dashed gray line represents a hypothetical perfect match between the binned and isolate reads. The blue line is the posterior mean while the shaded area contains the 95% posterior credible region calculated from 10000 posterior samples from a Bayesian regression model with the SNPs from the binned reads as the response and the SNPs from the isolate sequencing data as the sole explanatory variable. In panel d, the boxes are colored according to the type of assembly. The presented statistics are the summed lengths of all contigs (total length), the number of contigs, the sequence length of the shortest contig at 50% genome length (N50), and the smallest number of contigs whose sum of lengths is at least 50% of the genome length (L50).
Fig. 4.
Fig. 4.
Midpoint-rooted maximum likelihood trees from core SNP alignment of E. coli ST131 strains. The phylogeny in panel a was constructed from isolate sequencing data from 30 E. coli ST131 strains, and the phylogeny in panel b with the mGEMS pipeline from ten synthetic plate sweep samples, each mixing three isolate samples from the three main ST131 lineages (a–c; one strain from each per sample). Both phylogenies were inferred with RAxML-NG. Numbers below the edges are the branch support values from RAxML-NG for the next branch. Leaves are coloured according to the E. coli ST131 sublineage (a, b, B0, C1, or C2), and branch lengths in the tree scale with the mean number of nucleotide substitutions per site on the respective branch (GTR+G4 model). Leaves are labelled with the ENA accession number and the leaf labelled NCTC13411 corresponds to the reference strain used in calling the core SNPs.
Fig. 5.
Fig. 5.
Tanglegram of two midpoint-rooted maximum likelihood trees from core SNP alignment of E. faecalis strains. The phylogeny labelled Isolate samples (left side of the tree) was inferred with RAXML-NG from assembling the isolate sequencing data from 84 E. faecalis strains. The phylogeny labelled Mixed samples (right side of the tree) was inferred from 12 synthetic mixed samples, each containing sequencing data from seven different E. faecalis STs randomly chosen from the isolate sequencing data. Numbers below the edges indicate bootstrap support values from RAxML-NG for the next branch towards the leaves of the tree. Only support values less than 90 are shown. Branches are coloured according to the E. faecalis STs, and branch lengths in the tree scale with the mean number of nucleotide substitutions per site on the respective branch (GTR+G4 model). Leaves are labelled with the strain name from NCBI and the leaf labelled V583 corresponds to the reference strain for calling the core SNPs.
Fig. 6.
Fig. 6.
Midpoint-rooted maximum likelihood tree from core SNP alignment of S. aureus ST22 showing strains from a single lineage within the sequence type. The phylogeny was inferred from a combined set of assemblies from 60 isolate sequencing samples (leaves labelled Staff A-G 1 A-T, corresponding to the temporally first samples from each staff member) and 312 assemblies obtained from the mGEMS pipeline applied to synthetic mixed samples of sequencing data from each of the three different S. aureus ST22 clades (1, 2, and 3). Only strains from clade 1 are displayed in the tree, with the branch labelled Outgroup leading to the collapsed clades 2 and 3. The mixed samples were produced from the isolate sequencing data collected from the patients, or from the staff members after the first sampling time. Branch labels are coloured according to the plate the isolate sequencing data was picked from. Branch lengths in the phylogeny scale with the mean number of SNPs obtained by multiplying the mean nucleotide substitutions per site on the respective branch (GTR+G4 model) with the total number of alignment sites. Leaves are labelled with the format: staff or patient, a letter indicating the donor, plate number (ascending in time), and a letter indicating the colony pick id.
Fig. 7.
Fig. 7.
Midpoint-rooted maximum likelihood trees from core SNP alignment of S. aureus ST22 showing clade 2 and clade 3 strains. The underlying phylogeny is the same as in Fig. 6. The phylogeny in panel a contains the clade 2 strains, and panel b the clade 3 strains. Branches leading to clade 1 and clade 3 (panel a), or clade 1 and clade 2 (panel b), labelled Outgroup in both panels, were collapsed. Branch labels are coloured according to the plate the isolate sequencing data was originally picked from with darker shades indicating later sampling times. Branch lengths in the phylogeny scale with the mean number of SNPs obtained by multiplying the mean nucleotide substitutions per site on the respective branch (GTR+G4 model) with the total number of alignment sites. Leaves are labelled with the format: staff or patient, a letter indicating the donor, plate number (ascending in time), and a letter indicating the colony pick id.

References

    1. Mäklin T, Kallonen T, Alanko J, Samuelsen Ø, Hegstad K, et al. Figshare; 2021. - DOI - PMC - PubMed
    1. Deng X, den Bakker HC, Hendriksen RS. Genomic epidemiology: whole-genome-sequencing-powered surveillance and outbreak investigation of foodborne bacterial pathogens. Annu Rev Food Sci Technol. 2016;7:353–374. doi: 10.1146/annurev-food-041715-033259. - DOI - PubMed
    1. Tang P, Croxen MA, Hasan MR, Hsiao WWL, Hoang LM. Infection control in the new age of genomic epidemiology. Am J Infect Control. 2017;45:170–179. doi: 10.1016/j.ajic.2016.05.015. - DOI - PubMed
    1. Van Goethem N, Descamps T, Devleesschauwer B, Roosens NHC, Boon NAM, et al. Status and potential of bacterial genomics for public health practice: a scoping review. Implement Sci. 2019;14:79. doi: 10.1186/s13012-019-0930-2. - DOI - PMC - PubMed
    1. Grad YH, Lipsitch M. Epidemiologic data and pathogen genome sequences: a powerful synergy for public health. Genome Biol. 2014;15:538. doi: 10.1186/s13059-014-0538-4. - DOI - PMC - PubMed

Publication types