

The effects of patient cost-sharing on health expenditure and health among older people: Heterogeneity across income groups
- PMID: 34779932
- PMCID: PMC9170661
- DOI: 10.1007/s10198-021-01399-6
The effects of patient cost-sharing on health expenditure and health among older people: Heterogeneity across income groups
Abstract
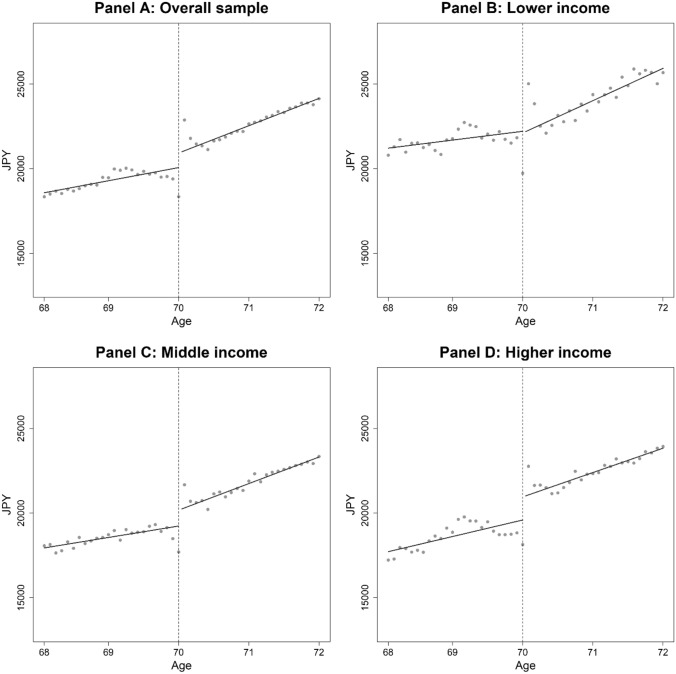
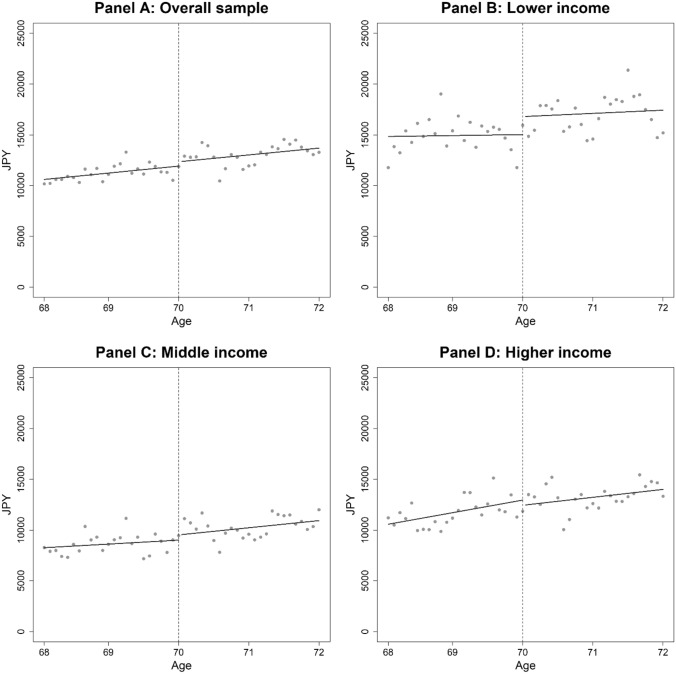
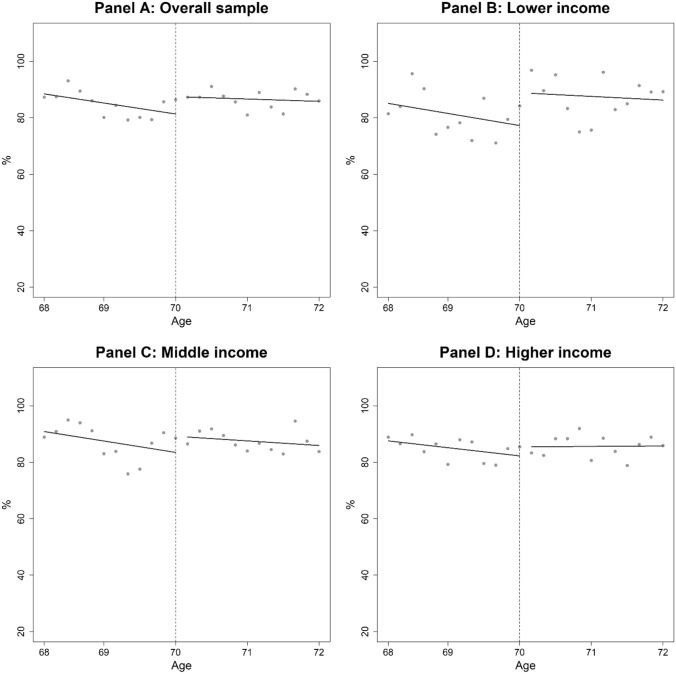
Despite rapidly rising health expenditure associated with population aging, empirical evidence on the effects of cost-sharing on older people is still limited. This study estimated the effects of cost-sharing on the utilization of healthcare and health among older people, the most intensive users of healthcare. We employed a regression discontinuity design by exploiting a drastic reduction in the coinsurance rate from 30 to 10% at age 70 in Japan. We used large administrative claims data as well as income information at the individual level provided by a municipality. Using the claims data with 1,420,252 person-month observations for health expenditure, we found that reduced cost-sharing modestly increased outpatient expenditure, with an implied price elasticity of - 0.07. When examining the effects of reduced cost-sharing by income, we found that the price elasticities for outpatient expenditure were almost zero, - 0.08, and - 0.11 for lower-, middle-, and higher-income individuals, respectively, suggesting that lower-income individuals do not have more elastic demand for outpatient care compared with other income groups. Using large-scale mail survey data with 3404 observations for self-reported health, we found that the cost-sharing reduction significantly improved self-reported health only among lower-income individuals, but drawing clear conclusions about health outcomes is difficult because of a lack of strong graphical evidence to support health improvement. Our results suggest that varying cost-sharing by income for older people (i.e., smaller cost-sharing for lower-income individuals and larger cost-sharing for higher-income individuals) may reduce health expenditure without compromising health.
Keywords: Cost-sharing; Health expenditure; Income inequality; Older people; Regression discontinuity design.
© 2021. The Author(s).
Conflict of interest statement
None.
Figures
Similar articles
-
Effect of no cost sharing for paediatric care on healthcare usage by household income levels: regression discontinuity design.BMJ Open. 2023 Aug 17;13(8):e071976. doi: 10.1136/bmjopen-2023-071976. BMJ Open. 2023. PMID: 37591654 Free PMC article.
-
Cost sharing and the demand for health services in a regulated market.Health Econ. 2021 Jun;30(6):1259-1275. doi: 10.1002/hec.4244. Epub 2021 Mar 17. Health Econ. 2021. PMID: 33733585
-
Who Benefits from the Fixed Copayment of Medical and Pharmaceutical Expenditure among the Korean Elderly?Int J Environ Res Public Health. 2020 Nov 3;17(21):8118. doi: 10.3390/ijerph17218118. Int J Environ Res Public Health. 2020. PMID: 33153173 Free PMC article.
-
The impact of change from copayment to coinsurance on medical care usage and expenditure in outpatient setting in older Koreans.Int J Health Plann Manage. 2018 Jan;33(1):235-245. doi: 10.1002/hpm.2416. Epub 2017 Apr 3. Int J Health Plann Manage. 2018. PMID: 28370318
-
How would mental health parity affect the marginal price of care?Health Serv Res. 2001 Feb;35(6):1207-27. Health Serv Res. 2001. PMID: 11221816 Free PMC article. Review.
Cited by
-
Multimorbidity patterns in the working age population with the top 10% medical cost from exhaustive insurance claims data of Japan Health Insurance Association.PLoS One. 2023 Sep 28;18(9):e0291554. doi: 10.1371/journal.pone.0291554. eCollection 2023. PLoS One. 2023. PMID: 37768909 Free PMC article.
-
The effect of urban-rural resident basic medical insurance on physical health of the rural older adult in China.Front Public Health. 2024 Jan 26;12:1319697. doi: 10.3389/fpubh.2024.1319697. eCollection 2024. Front Public Health. 2024. PMID: 38344234 Free PMC article.
-
Comparison of Ablation Area and Change in Functional Liver Reserve after Radiofrequency Ablation for Hepatocellular Carcinoma Using the arfa® and VIVA® Systems.J Clin Med. 2022 Jan 15;11(2):434. doi: 10.3390/jcm11020434. J Clin Med. 2022. PMID: 35054128 Free PMC article.
-
Out-of-pocket pharmaceutical expenditure and potential misuse of public resources - analysis in the Italian context.Cost Eff Resour Alloc. 2025 Apr 17;23(1):17. doi: 10.1186/s12962-025-00619-7. Cost Eff Resour Alloc. 2025. PMID: 40247361 Free PMC article.
-
Can Basic Medical Insurance Reduce Elderly Family Income Inequality in China?Front Public Health. 2022 Feb 15;10:838733. doi: 10.3389/fpubh.2022.838733. eCollection 2022. Front Public Health. 2022. PMID: 35242735 Free PMC article.
References
-
- Cutler D, Deaton A, Lleras-Muney A. The determinants of mortality. Journal of Economic Perspectives. 2006;20(3):97–120. doi: 10.1257/jep.20.3.97. - DOI
MeSH terms
Grants and funding
LinkOut - more resources
Full Text Sources
