. 2022 Jan 18;204(1):e0041821.
doi: 10.1128/JB.00418-21. Epub 2021 Nov 15.

Direct RNA Nanopore Sequencing of Pseudomonas aeruginosa Clone C Transcriptomes

Affiliations

Direct RNA Nanopore Sequencing of Pseudomonas aeruginosa Clone C Transcriptomes

Marie-Madlen Pust et al. J Bacteriol. .

Abstract

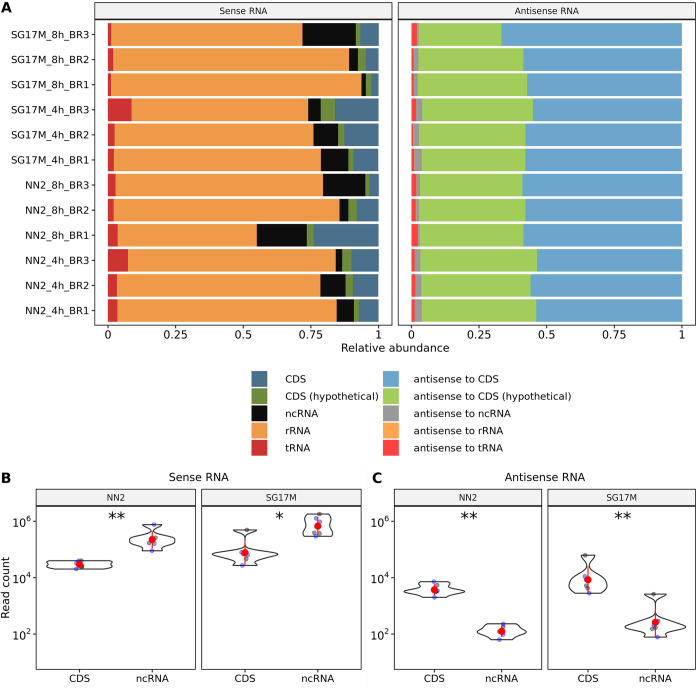
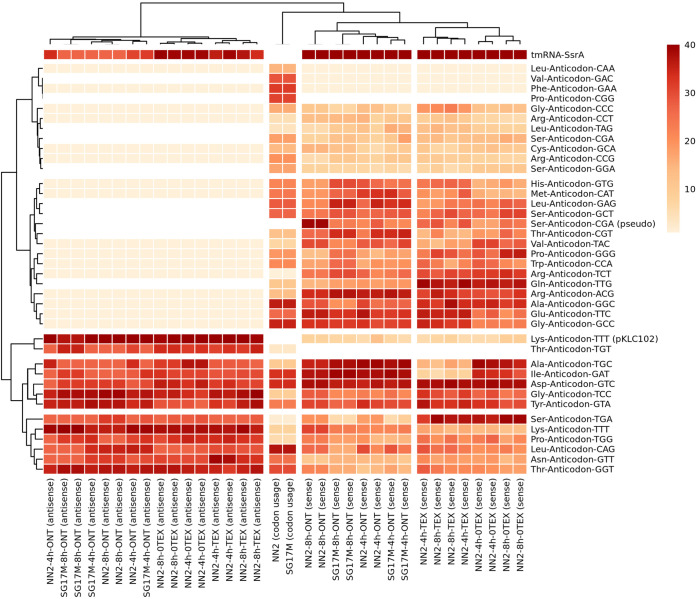
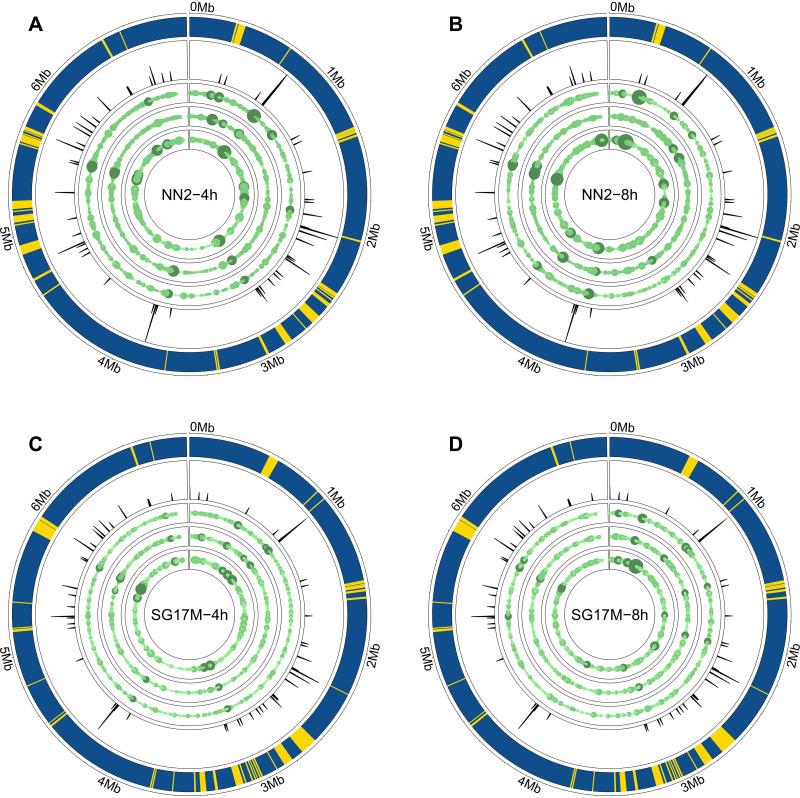
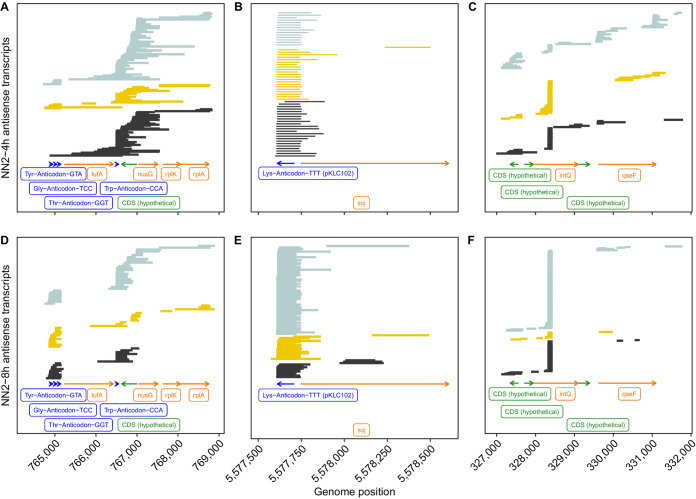
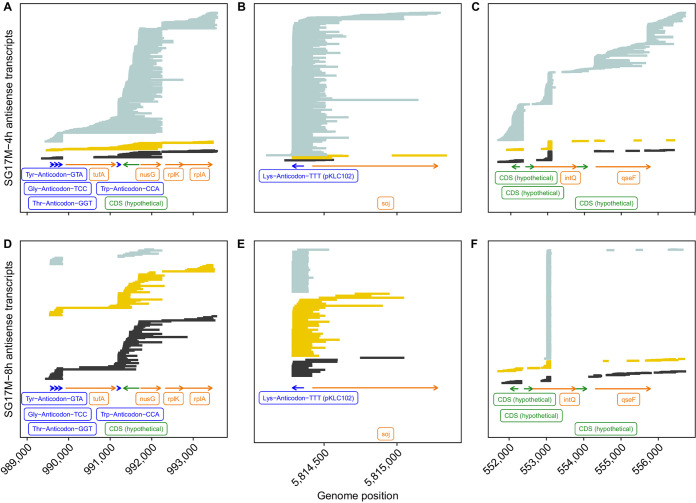
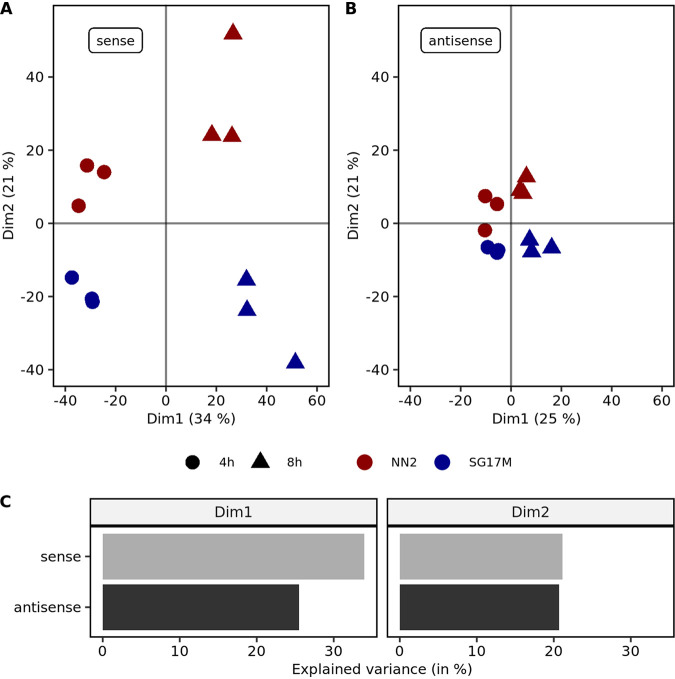
The transcriptomes of Pseudomonas aeruginosa clone C isolates NN2 and SG17M during the mid-exponential and early stationary phases of planktonic growth were evaluated by direct RNA sequencing on the nanopore platform and compared with established short-read cDNA sequencing on the Illumina platform. Fifty to ninety percent of the sense RNAs turned out to be rRNA molecules, followed by similar proportions of mRNA transcripts and noncoding RNAs. The two platforms detected similar proportions of uncharged tRNAs and 29 yet-undescribed antisense tRNAs. For example, the rarest arginine codon was paired with the most abundant tRNAArg, and the tRNAArg gene is missing for the most frequent arginine codon. More than 90% of the antisense RNA molecules were complementary to a coding sequence. The antisense RNAs were evenly distributed in the genomes. Direct RNA sequencing identified more than 4,000 distinct nonoverlapping antisense RNAs during exponential and stationary growth. Besides highly expressed small antisense RNAs less than 200 bases in size, a population of longer antisense RNAs was sequenced that covered a broad range (a few hundred to thousands of bases) and could be complementary to a contig of several genes. In summary, direct RNA sequencing identified yet-undescribed RNA molecules and an unexpected composition of the pools of tRNAs and sense and antisense RNAs. IMPORTANCE Genome-wide gene expression of bacteria is commonly studied by high-throughput sequencing of size-selected cDNA fragment libraries of reverse-transcribed RNA preparations. However, the depletion of rRNAs, enzymatic reverse transcription, and the fragmentation, size selection, and amplification during library preparation lead to inevitable losses of information about the initial composition of the RNA pool. We demonstrate that direct RNA sequencing on the Nanopore platform can overcome these limitations. Nanopore sequencing of total RNA yielded novel insights into the Pseudomonas aeruginosa transcriptome that-if replicated in other species-will change our view of the bacterial RNA world. The discovery of sense-antisense pairs of transfer-messenger RNA (tmRNA), tRNAs, and mRNAs indicates a further and unknown level of gene regulation in bacteria.

Keywords: Nanopore sequencing; Pseudomonas aeruginosa; antisense RNA; direct RNA sequencing; tRNA; transcriptome.


Conflict of interest statement

The authors declare no conflict of interest.

Figures

FIG 1
FIG 1
Evaluation of the Nanopore sequencing runs and genome-based read alignment with minimap2. (A) Representation of the number of P. aeruginosa-specific RNA reads aligning to either the forward (light blue) or the reverse (dark blue) strand of the corresponding reference sequence as well as the number of spike-in RNA control reads mapping to the forward (orange) or reverse (red) human enolase strand. Overall, 4 out of 143,693 total spike-in enolase reads (0.003%) were spuriously antisense associated. Results are shown for the three biological replicates (BR1 to BR3) of SG17M and NN2 at the mid-exponential phase (4 h) and early stationary growth phase (8 h). (B) During Oxford Nanopore sequencing runs, MUX sensor scans of pore fit were performed every 90 min to evaluate the number of available pores for the next 90-min sequencing period. Here, the number of reported available pores after MUX scan and the number of corresponding reads sequenced in the following 90-min period are visualized for the first 6 h. Each flow cell is represented by a unique color. The enlarged circle depicts the group centroid. A strong positive correlation between the number of available pores and the number of sequenced reads was detected (Pearson’s correlation coefficient = 0.8; Pearson’s P value < 0.0001; confidence intervals = 0.73 to 0.86).
FIG 2
FIG 2
Abundances of sense and antisense transcripts with regard to the genomic feature types. (A) Relative abundances of sense (left) and antisense (right) RNA transcripts obtained from nonnormalized read counts in the biological replicates (BR1 to BR3) of SG17M and NN2 at 4- and 8-h time points. The reads were classified according to their alignment toward a known coding sequence (CDS), a coding sequence with no functional annotation (hypothetical), a noncoding sequence (ncRNA), rRNA (rRNA), and tRNA (tRNA). The variance observed between replicates and strains can be obtained from Fig. S4. (B) Representation of the log10-scaled counts of sense transcripts mapping to CDS or ncRNA regions in NN2 and SG17M at the mid-exponential phase (blue dots) and the early stationary phase (black dots). The red dots and red lines reveal the means and standard deviations. Most of the sense transcripts aligned to ncRNA regions in NN2 (Wilcoxon P value = 0.002; effect size r = 0.8; confidence interval = 0.63 to 0.85) and SG17M (Wilcoxon P value = 0.02; effect size r = 0.69; confidence interval = 0.26 to 0.85). (C) The log10-scaled antisense transcript count was significantly higher in CDS than in ncRNA regions with known and undefined annotations in both NN2 (Wilcoxon P value = 0.002, effect size r = 0.83; confidence interval = 0.63 to 0.85) and SG17M (Wilcoxon P value = 0.002; effect size r = 0.83; confidence interval = 0.63 to 0.85). *, P < 0.05; **, P < 0.01.
FIG 3
FIG 3
Rank-based scoring of sense and antisense tRNA abundance observed across biological replicates sequenced on the Illumina (TEX, 0-TEX) or Nanopore direct RNA-seq (ONT) platform versus codon usage in NN2 and SG17M. (Left) Ranking of antisense tRNA abundance. Thirteen high-ranking antisense tRNAs (red) and 16 low-ranking tRNAs (read count < 10) were detected (beige). The white color depicts the complete absence of sense and antisense transcripts. (Right) Ranking of sense tRNA abundance. Note that all 37 P. aeruginosa-specific anticodon alternatives without stop codons are included here and are summarized in Table S1. The ranking of tRNAs was performed by setting equal values (ties) to their minimum score. For constructing row and column dendrograms, complete-linkage clustering was performed based on a Euclidean distance matrix.
FIG 4
FIG 4
Genome visualization of antisense transcript hot spots in P. aeruginosa clone C isolates with the R package circlize (67). The outermost circle represents the core (blue) and accessory (yellow) genome as predicted by IslandViewer4 (68). The second circle shows the frequency of tRNAs in the genome sequence. The third, fourth, and fifth lanes depict antisense coverage in the first, second, and third biological replicates of NN2 in mid-exponential phase (A), NN2 in early stationary phase (B), SG17M in mid-exponential phase (C), and SG17M in early stationary phase (D). The number of antisense transcripts was normalized beforehand (TMM-normalized log2-scaled CPM). The higher the antisense transcript coverage, the larger the circle and the darker the green color. The overall design of the figure was inspired by Fig. 6 in the publication of Wurtzel and colleagues (20) to allow direct comparison between their and our data.
FIG 5
FIG 5
Three antisense RNA coverage hot spots in P. aeruginosa NN2 during mid-exponential (upper) and early stationary (lower) growth. Antisense RNA reads of the biological replicates 1 (black), 2 (yellow), and 3 (light blue) were aligned to the genome sequence with minimap2. Green and orange arrows represent read alignments toward coding sequences with no functional annotation (CDS, undefined) and known coding sequences, respectively. The dark blue label depicts tRNA coverage. The abscissa provides the map position of the selected genomic region. Please note that the bead-based purification of RNA prior to sequencing introduced a skew toward shorter and more heterogeneous read lengths.
FIG 6
FIG 6
Three antisense RNA coverage hot spots in P. aeruginosa SG17M during mid-exponential (upper) and early stationary (lower) growth. Antisense RNA reads of biological replicates 1 (black), 2 (yellow), and 3 (light blue) were aligned to the genome sequence with minimap2. Green and orange arrows represent read alignments toward coding sequences with no functional annotation (CDS, undefined) and known coding sequences, respectively. The dark blue label depicts tRNA coverage. The abscissa provides the map position of the selected genomic region. Please note that the bead-based purification of RNA prior to sequencing introduced a skew toward shorter and more heterogeneous read lengths.
FIG 7
FIG 7
Principal-component analysis (PCA) of sense and antisense mRNA expression. (A) The first principal component in sense mRNA expression PCA explains 34% of the observed variance mainly between the mid-exponential (circles) and early stationary (triangles) growth phases. The second principal component explains about 21% of the variance and predominantly separates NN2 (red) and SG17M (blue) biological replicates. (B) The first principal component in antisense mRNA expression PCA explains 25% of the observed variance mainly between the mid-exponential (circles) and early stationary (triangles) growth phases. The second principal component explains about 21% of the variance and predominantly separates NN2 (red) and SG17M (blue) biological replicates. (C) In the first dimension (Dim1), which was found to explain the variance between time points, sense mRNA expression is slightly more important. For the second dimension (Dim2), which separates the SG17M and NN2 isolates, antisense and sense mRNA expressions contribute equally to the variance.
FIG 8
FIG 8
Heat map representation of the 30 variables contributing most to the replicate separation in the second dimension of the principal-component analysis. The second dimension was found to explain differences between P. aeruginosa clone C strains NN2 and SG17M. (A) The 30 most differentially expressed sense coding sequences between NN2 and SG17M. For coding sequences without functional annotation, the genome position is provided. (B) The 30 most differentially expressed antisense coding sequences between NN2 and SG17M. For coding sequences without functional annotation, the genome position is provided. For the column-based dendrogram analysis, a complete clustering method based on Euclidean distances of normalized read counts (TMM-normalized log2-scaled CPM) was chosen.
FIG 9
FIG 9
Electron microscopy of P. aeruginosa clone C bacteria. (A) SG17M, mid-exponential phase; (B) SG17M, early stationary phase; (C) NN2, mid-exponential phase; (D) NN2, early stationary phase. (E) Distribution of bacterial cell length of two biological replicates per strain and time point. ****, P < 0.0001.
FIG 10
FIG 10
Kaplan-Meier plot of the antisense RNA length distribution obtained with short-read cDNA sequencing on the Illumina platform (53) (black line) or by direct full-length RNA Nanopore sequencing (this work) of NN2 (red line) and SG17M (green line). The median length of antisense transcripts observed by Nanopore sequencing (orange) is similar to the maximum read length observed with Illumina.

References

    1. Organisation for Economic Cooperation and Development. 1997. Consensus document on information used in the assessment of environmental applications involving Pseudomonas. https://www.oecd.org/env/ehs/biotrack/46815578.pdf.
    1. Freschi L, Vincent AT, Jeukens J, Emond-Rheault JG, Kukavica-Ibrulj I, Dupont MJ, Charette SJ, Boyle B, Levesque RC. 2019. The Pseudomonas aeruginosa pan-genome provides new insights on its population structure, horizontal gene transfer, and pathogenicity. Genome Biol Evol 11:109–120. 10.1093/gbe/evy259. - DOI - PMC - PubMed
    1. Hilker R, Munder A, Klockgether J, Losada PM, Chouvarine P, Cramer N, Davenport CF, Dethlefsen S, Fischer S, Peng H, Schönfelder T, Türk O, Wiehlmann L, Wölbeling F, Gulbins E, Goesmann A, Tümmler B. 2015. Interclonal gradient of virulence in the Pseudomonas aeruginosa pangenome from disease and environment. Environ Microbiol 17:29–46. 10.1111/1462-2920.12606. - DOI - PubMed
    1. Wiehlmann L, Cramer N, Tümmler B. 2015. Habitat-associated skew of clone abundance in the Pseudomonas aeruginosa population. Environ Microbiol Rep 7:955–960. 10.1111/1758-2229.12340. - DOI - PubMed
    1. Römling U, Wingender J, Müller H, Tümmler B. 1994. A major Pseudomonas aeruginosa clone common to patients and aquatic habitats. Appl Environ Microbiol 60:1734–1738. 10.1128/aem.60.6.1734-1738.1994. - DOI - PMC - PubMed

Publication types

MeSH terms

LinkOut - more resources