. 2022 Mar;162(3):828-843.e11.
doi: 10.1053/j.gastro.2021.11.015. Epub 2021 Nov 13.

Integrative Analysis of the Inflammatory Bowel Disease Serum Metabolome Improves Our Understanding of Genetic Etiology and Points to Novel Putative Therapeutic Targets

Affiliations

Integrative Analysis of the Inflammatory Bowel Disease Serum Metabolome Improves Our Understanding of Genetic Etiology and Points to Novel Putative Therapeutic Targets

Antonio F Di'Narzo et al. Gastroenterology. 2022 Mar.

Abstract

Background & aims: Polygenic and environmental factors are underlying causes of inflammatory bowel disease (IBD). We hypothesized that integration of the genetic loci controlling a metabolite's abundance, with known IBD genetic susceptibility loci, may help resolve metabolic drivers of IBD.

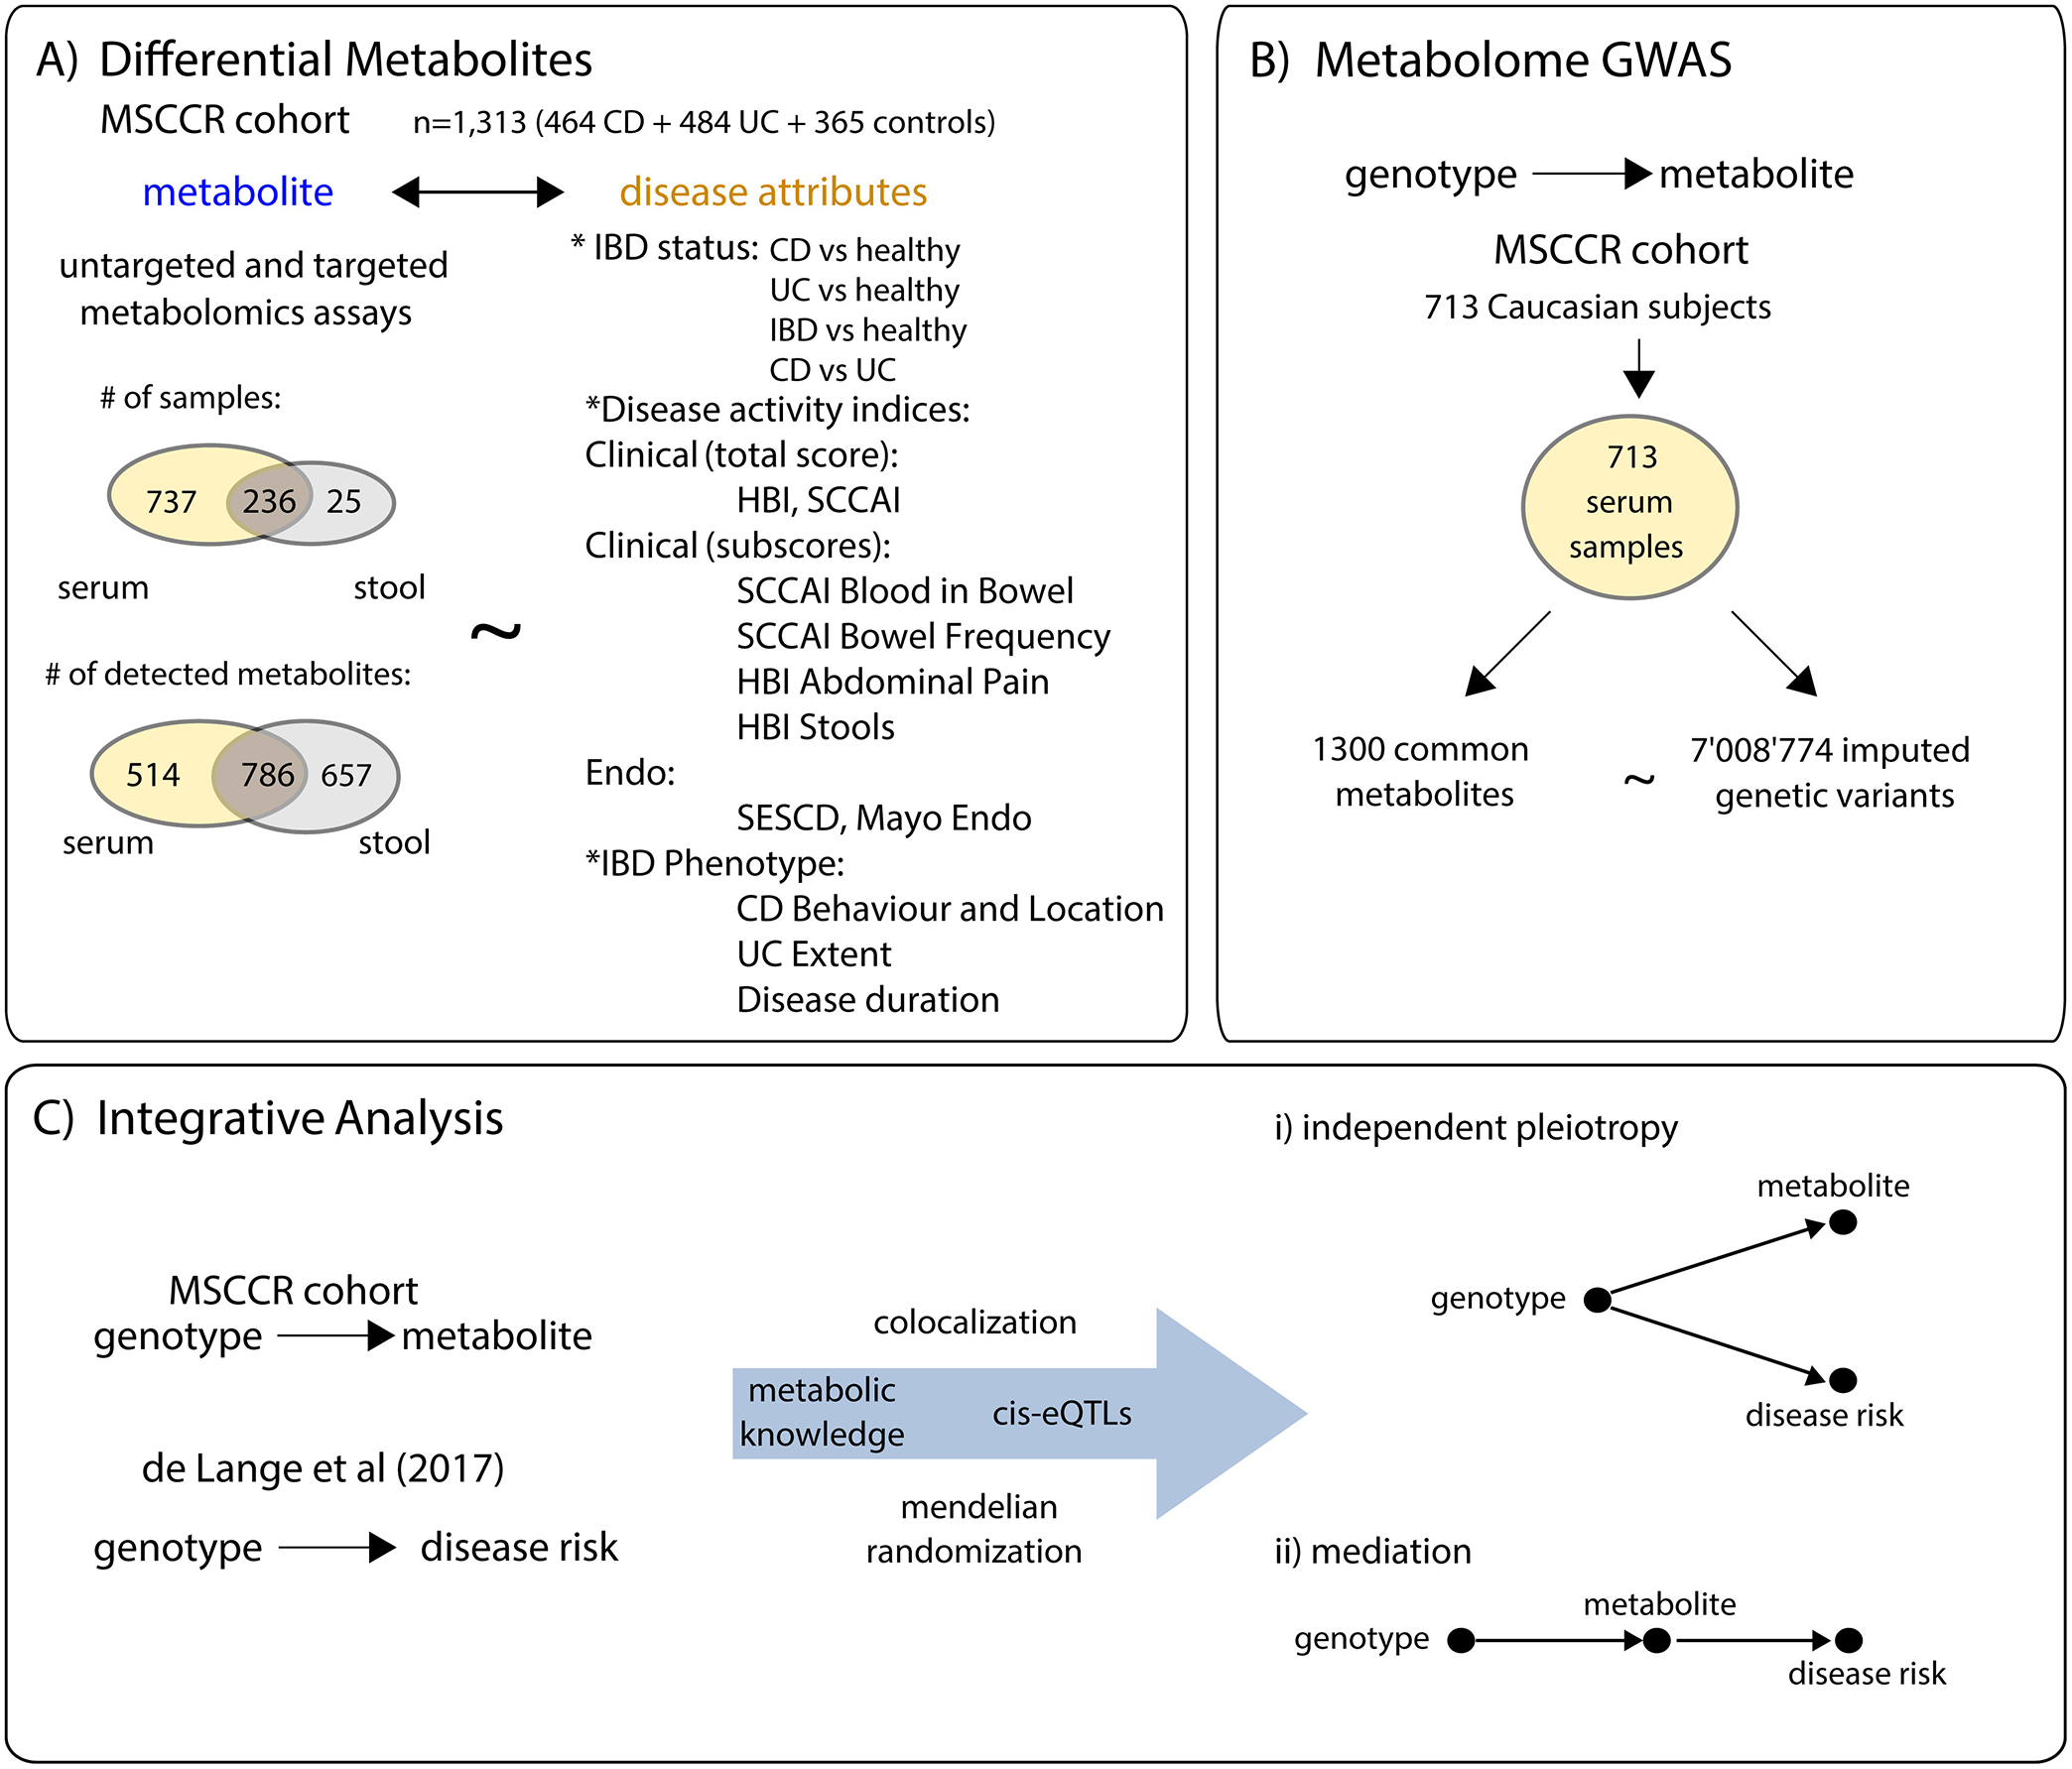
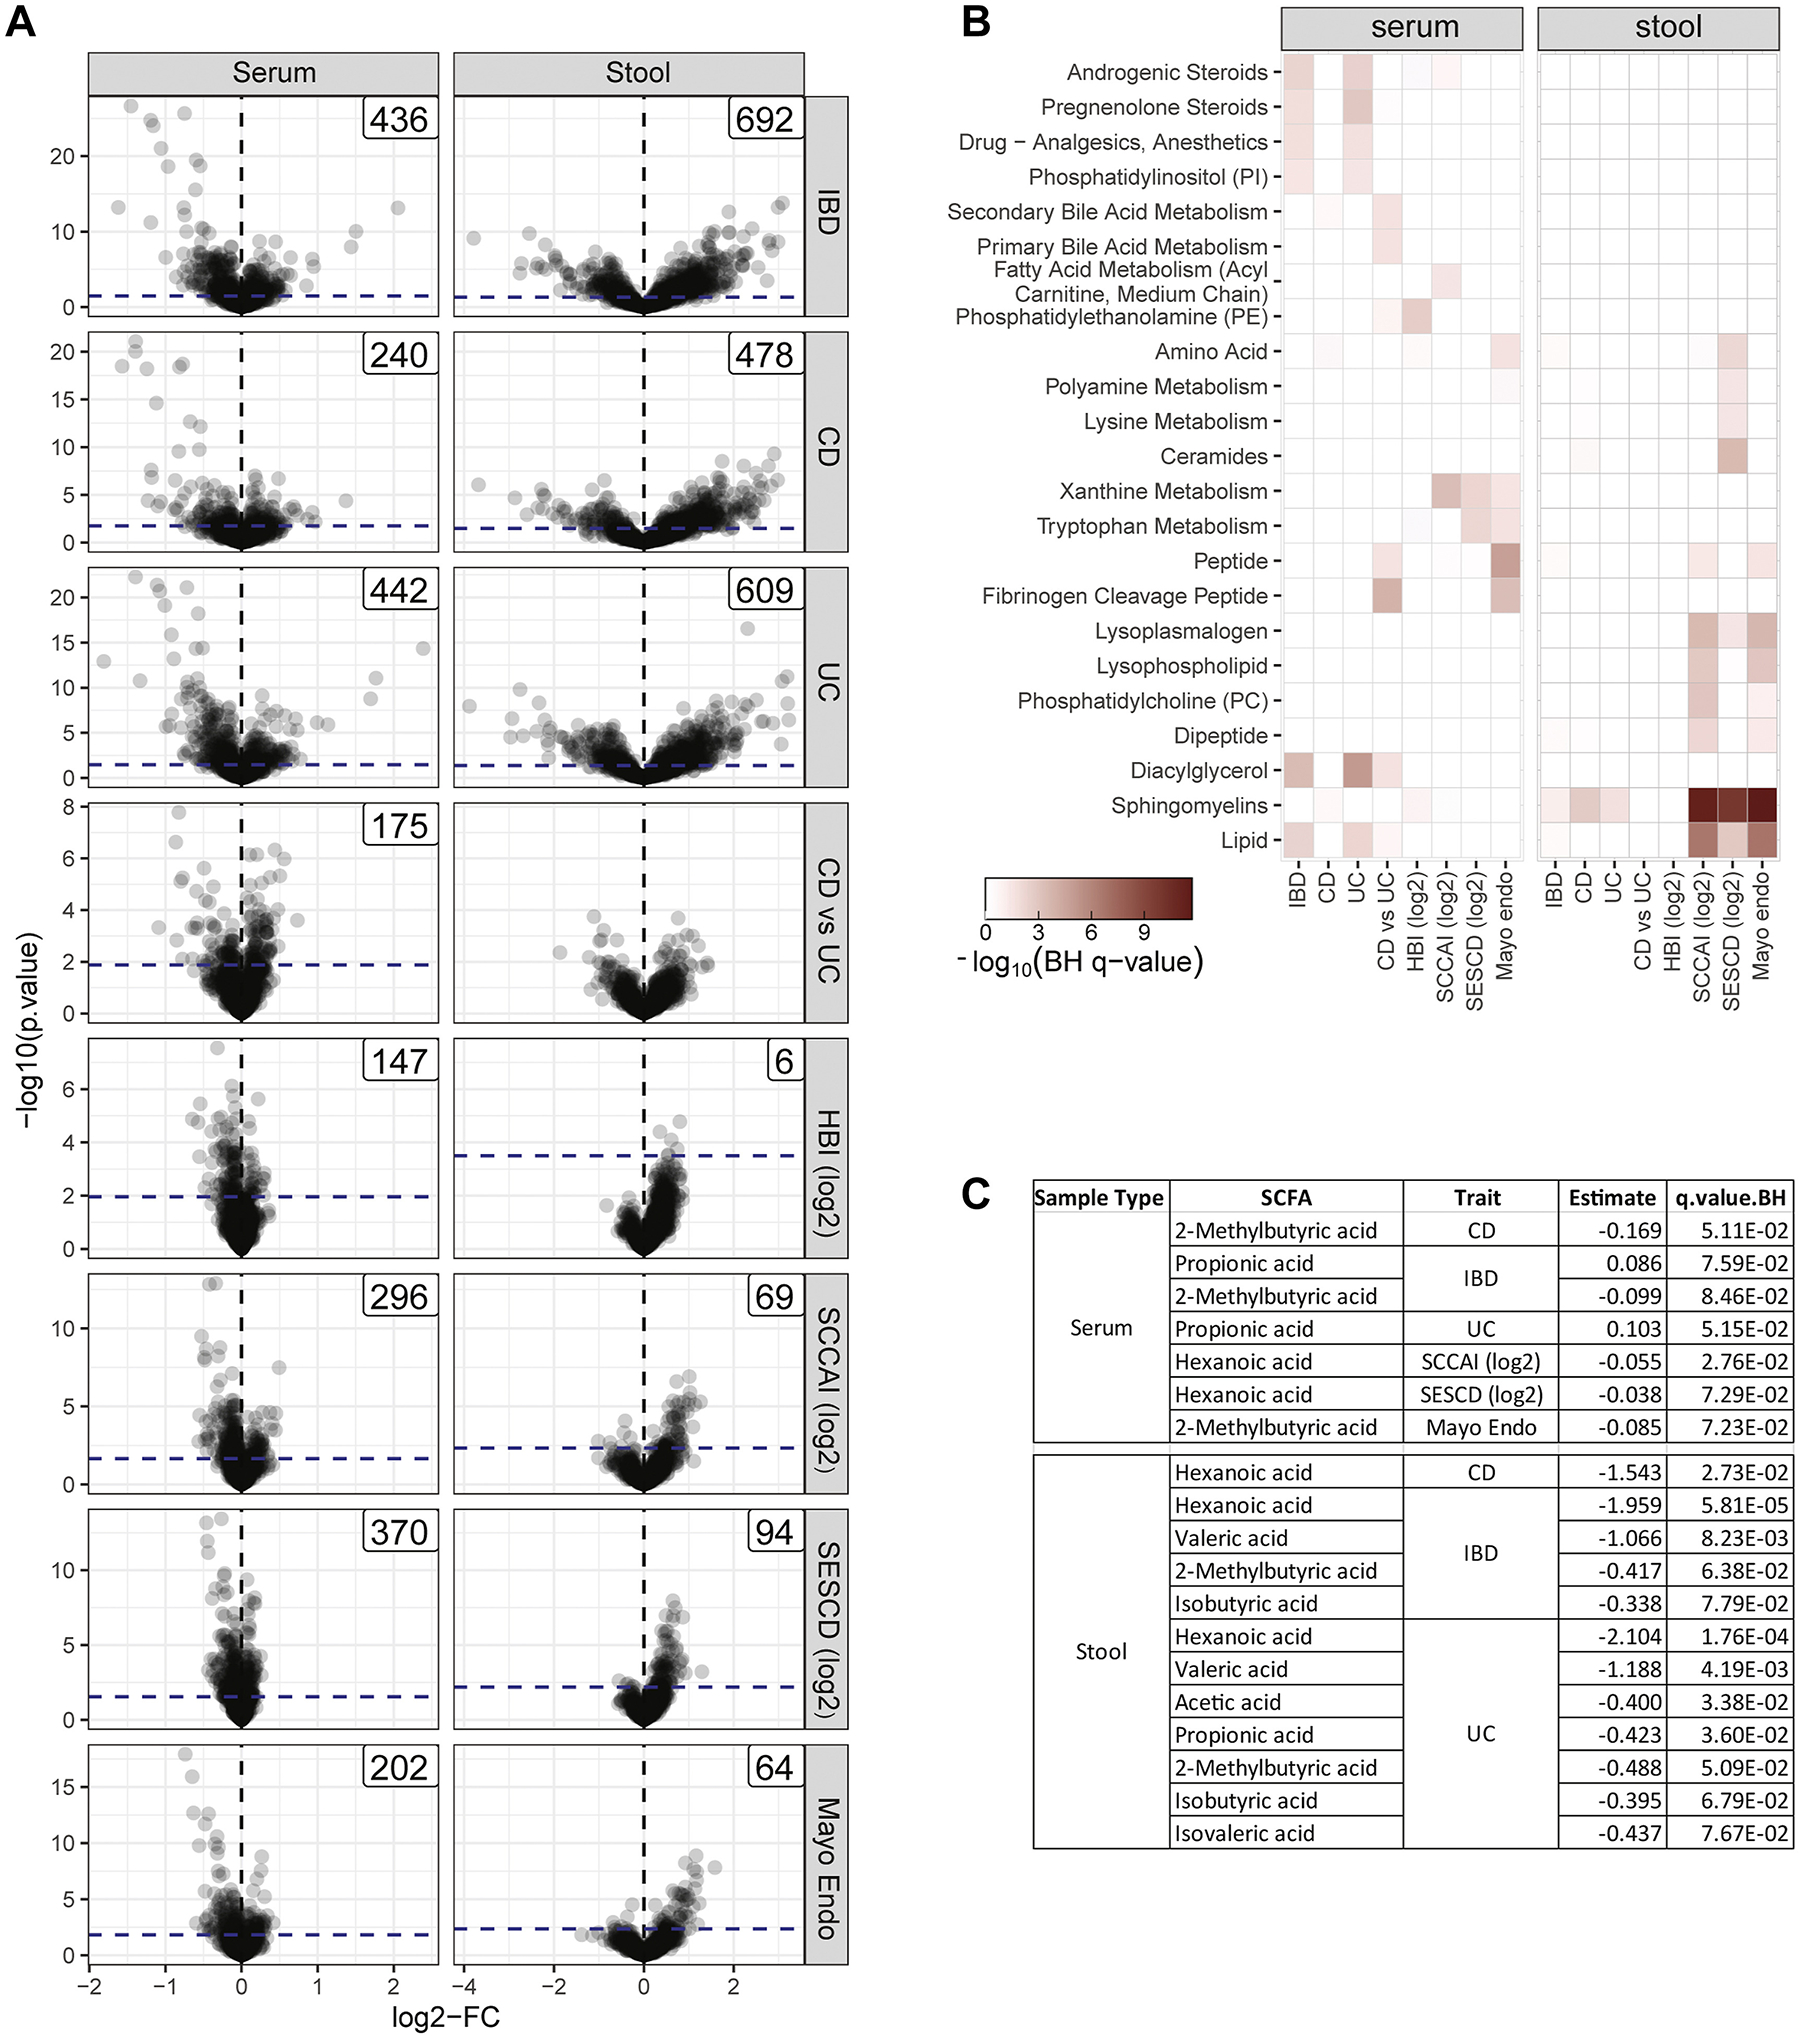
Methods: We measured the levels of 1300 metabolites in the serum of 484 patients with ulcerative colitis (UC) and 464 patients with Crohn's disease (CD) and 365 controls. Differential metabolite abundance was determined for disease status, subtype, clinical and endoscopic disease activity, as well as IBD phenotype including disease behavior, location, and extent. To inform on the genetic basis underlying metabolic diversity, we integrated metabolite and genomic data. Genetic colocalization and Mendelian randomization analyses were performed using known IBD risk loci to explore whether any metabolite was causally associated with IBD.

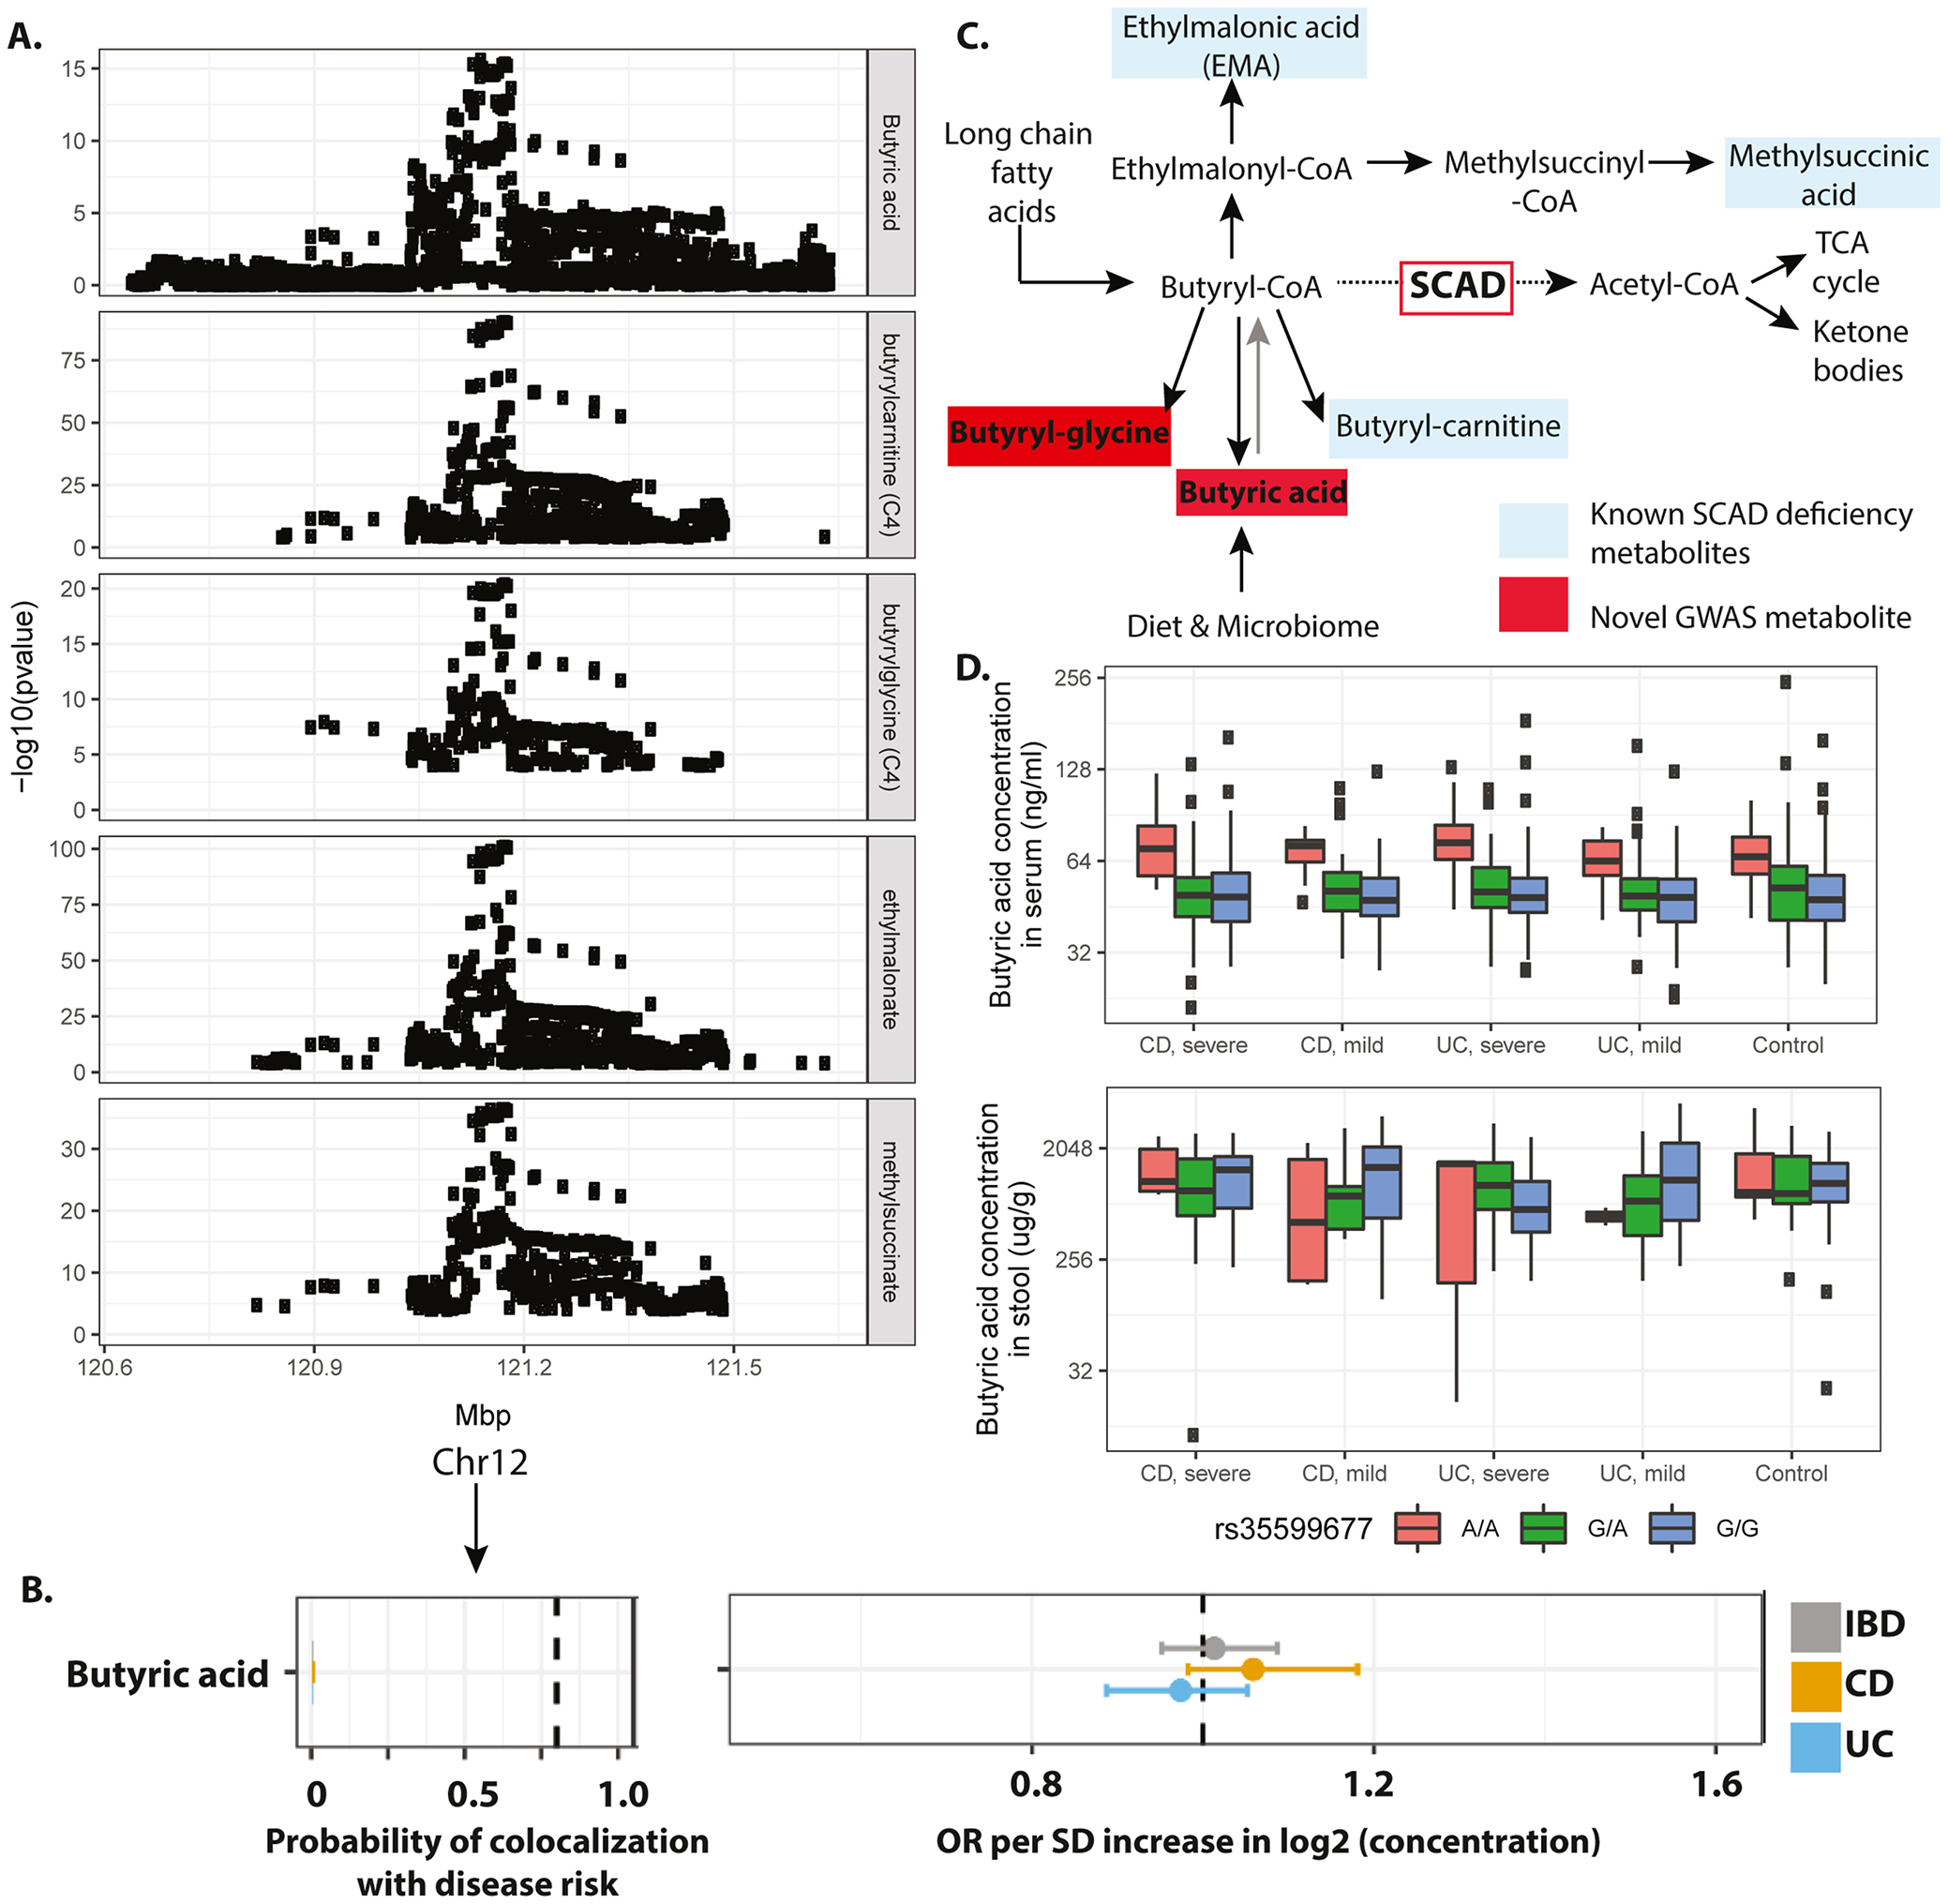
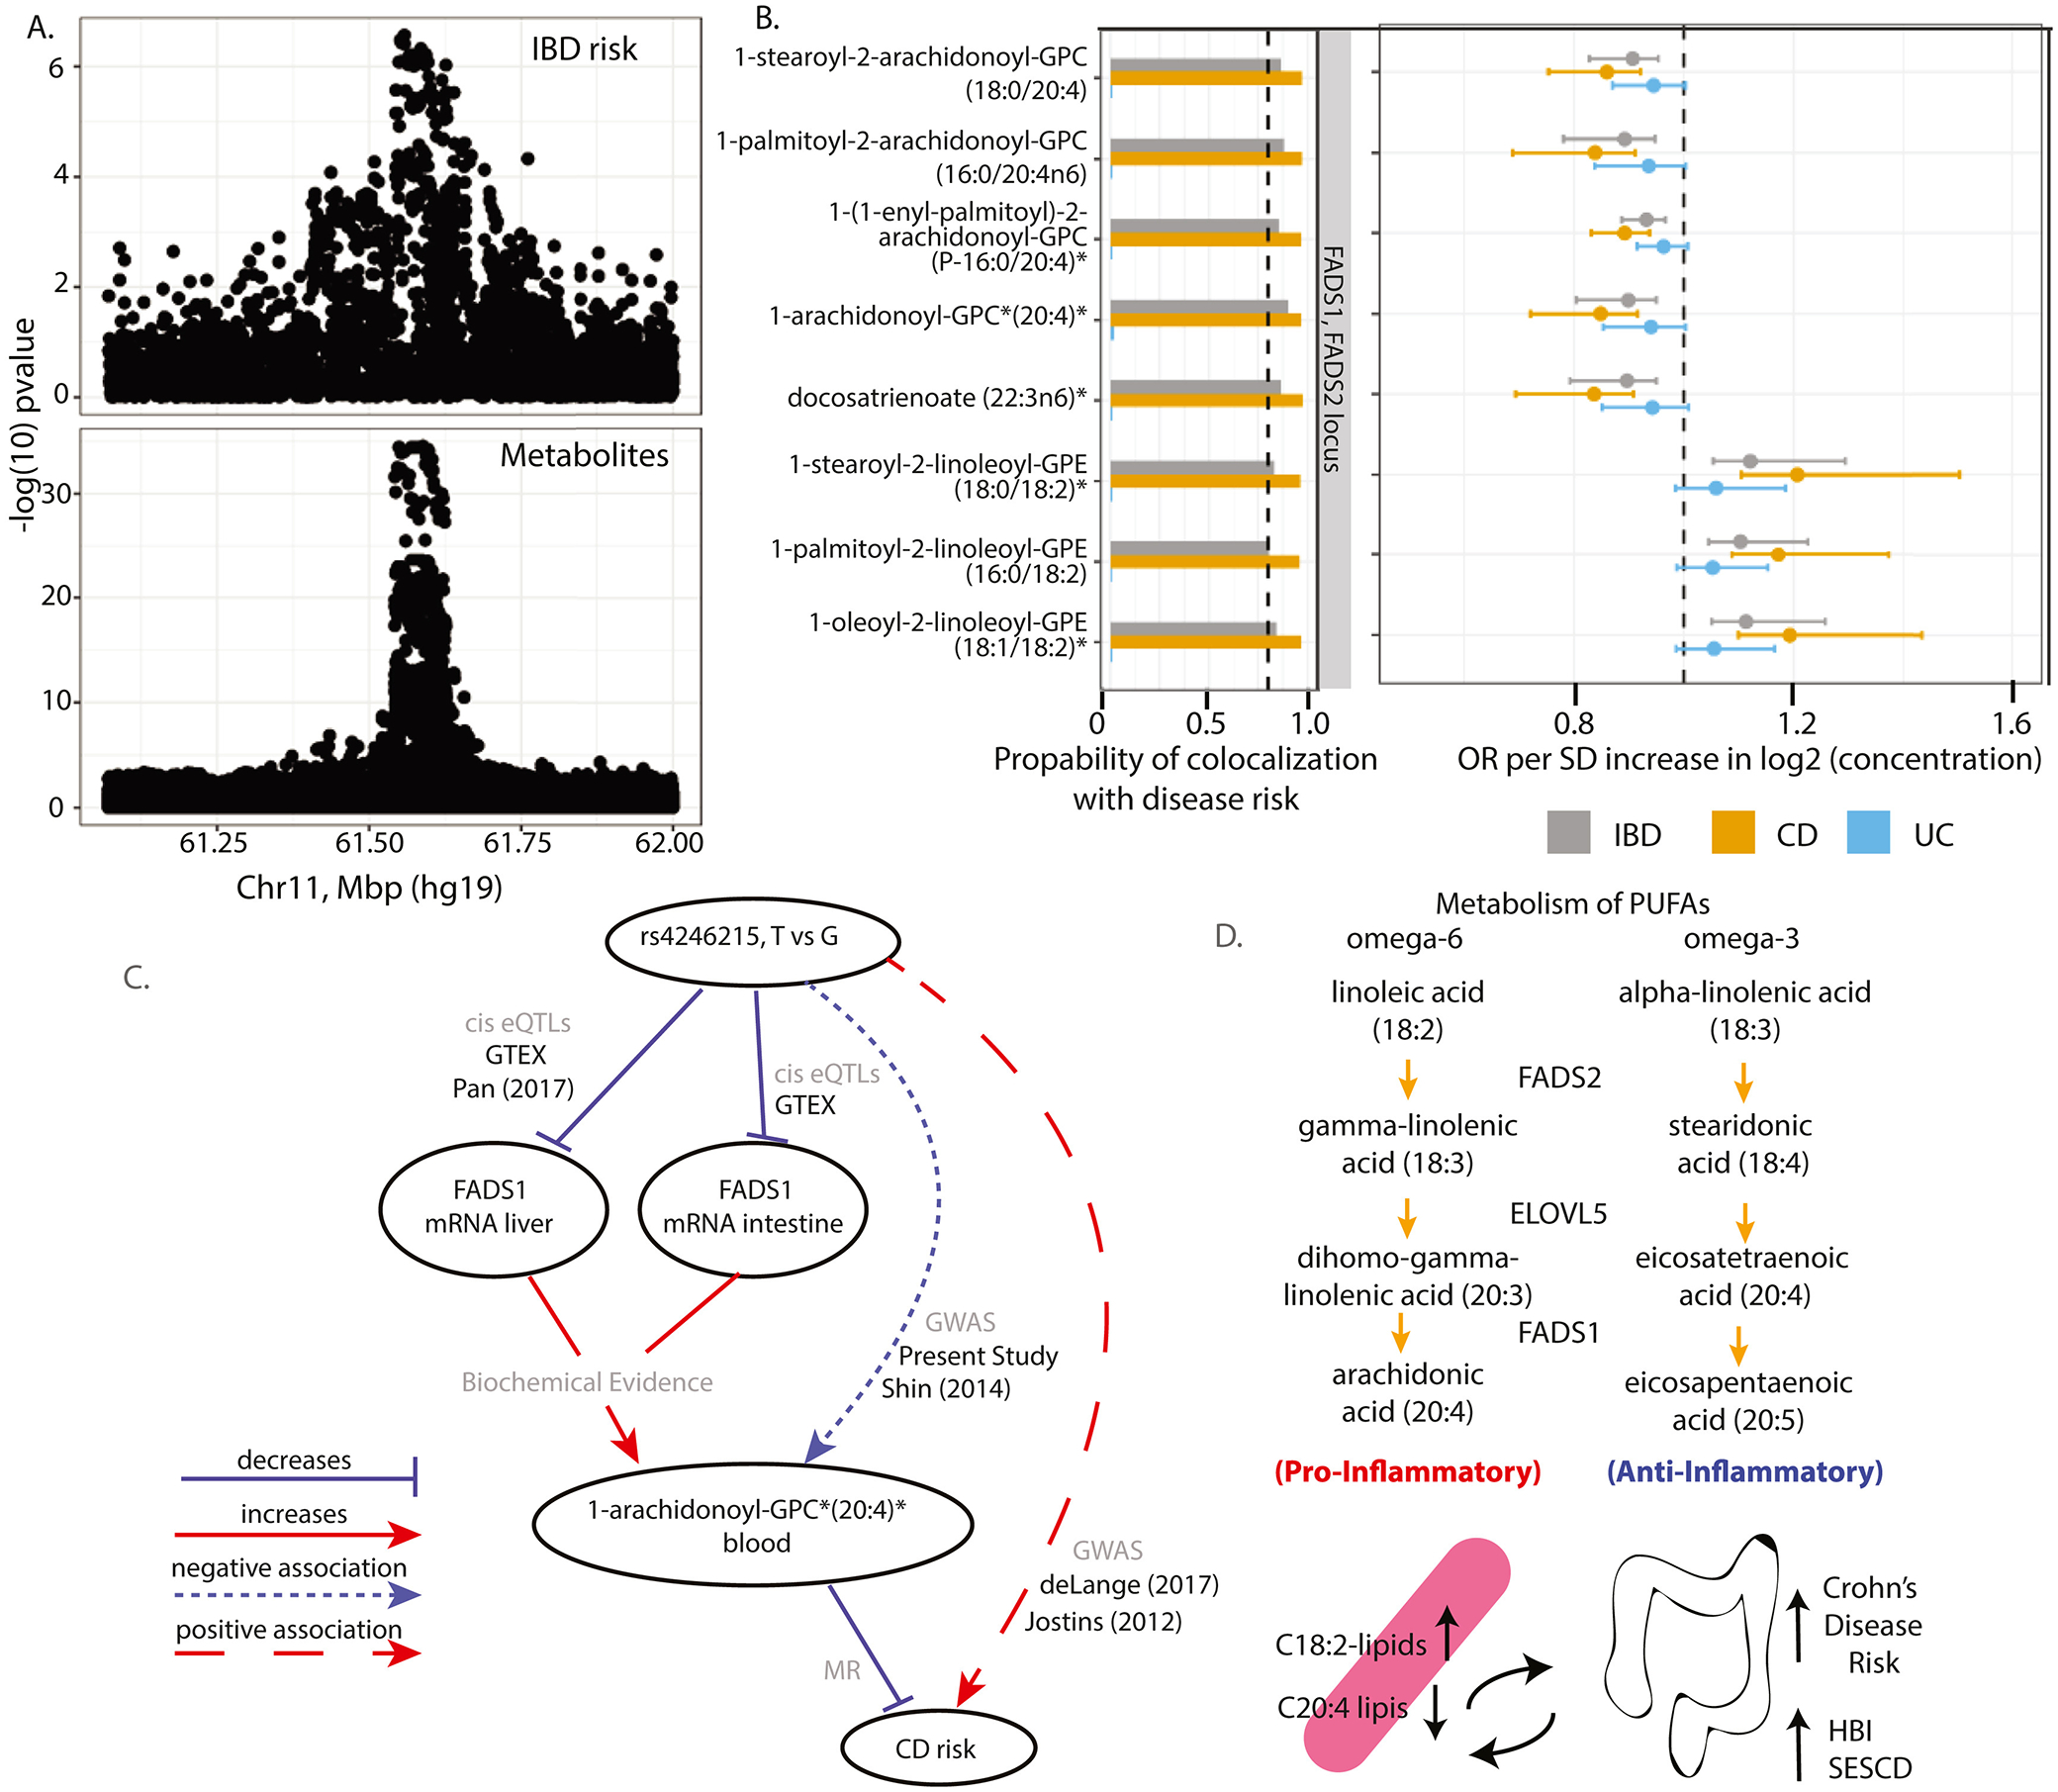
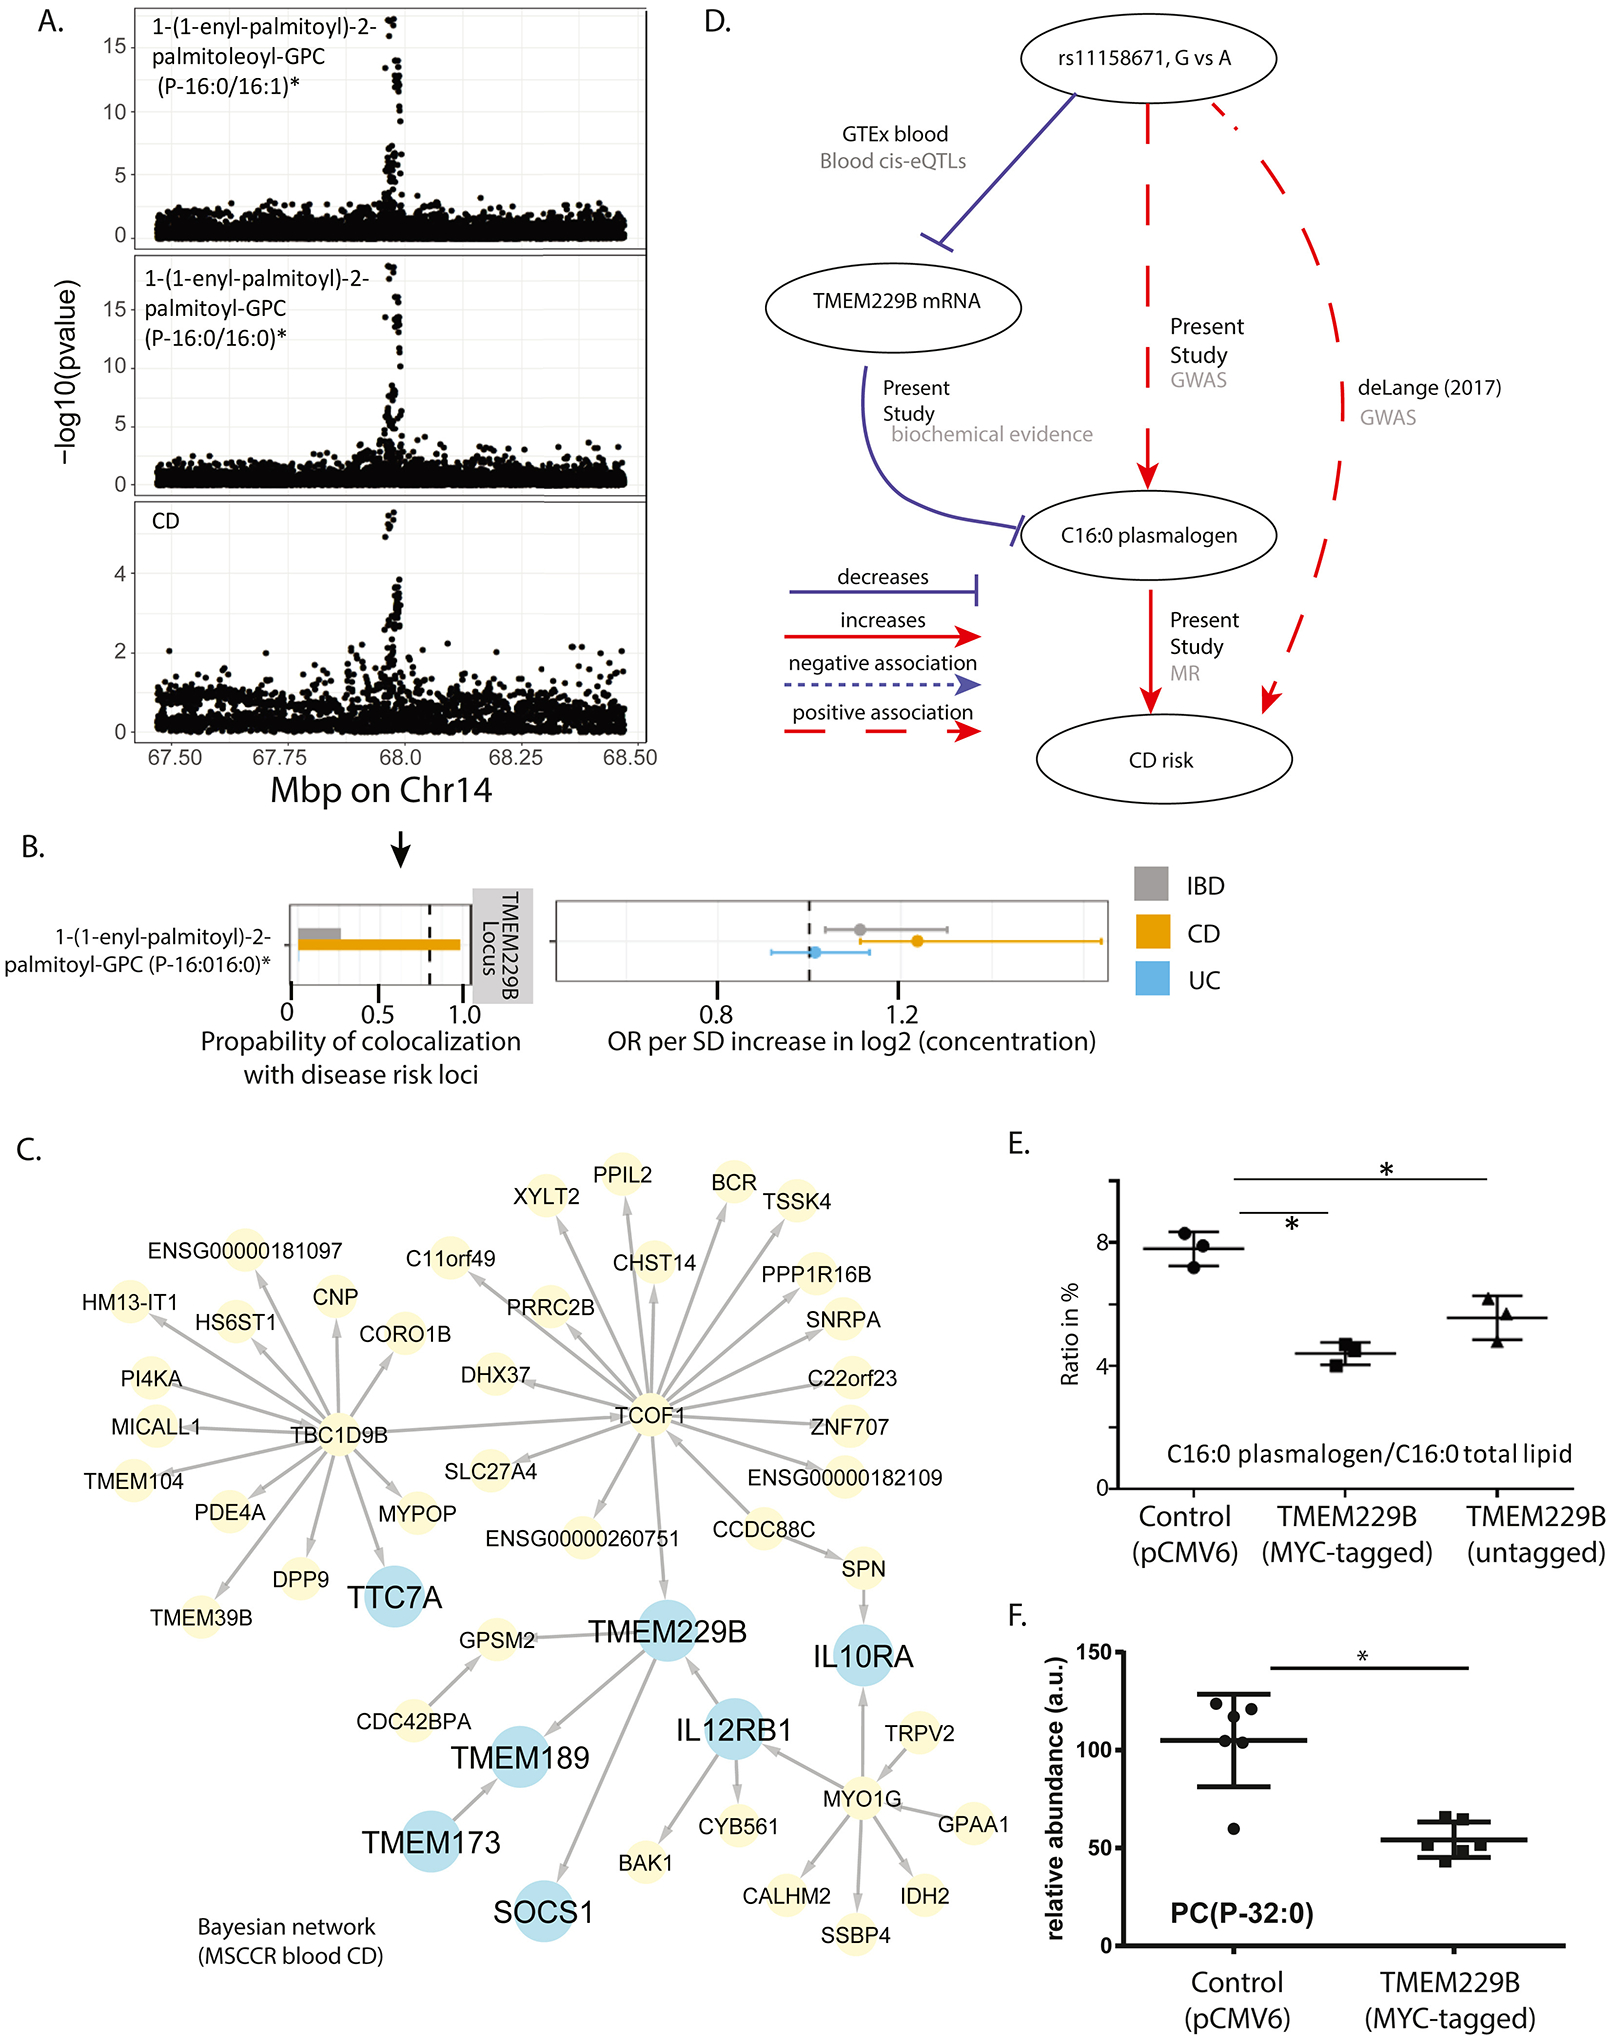
Results: We found 173 genetically controlled metabolites (metabolite quantitative trait loci, 9 novel) within 63 non-overlapping loci (7 novel). Furthermore, several metabolites significantly associated with IBD disease status and activity as defined using clinical and endoscopic indexes. This constitutes a resource for biomarker discovery and IBD biology insights. Using this resource, we show that a novel metabolite quantitative trait locus for serum butyrate levels containing ACADS was not supported as causal for IBD; replicate the association of serum omega-6 containing lipids with the fatty acid desaturase 1/2 locus and identify these metabolites as causal for CD through Mendelian randomization; and validate a novel association of serum plasmalogen and TMEM229B, which was predicted as causal for CD.

Conclusions: An exploratory analysis combining genetics and unbiased serum metabolome surveys can reveal novel biomarkers of disease activity and potential mediators of pathology in IBD.

Keywords: Differential Metabolite Abundance Analysis; Inflammatory Bowel Disease; Mendelian Randomization; Metabolome.


Figures

Figure 1.
Figure 1.. Summary of the study workflow
A) An overview of the number of samples and metabolites detected in serum and stool of the MSCCR. B) The metabolite GWAS design. C) Flow chart summarizing the integration of genotype and metabolite information available from the present MSSCR cohort and publicly available IBD meta-analysis, in order to assess a causal relationship between metabolite changes and IBD.
Figure 2.
Figure 2.. Serum and stool metabolites significantly associated with various IBD disease attributes
A) Volcano plots showing the DMA of the serum (left panel) and stool samples (right panel), according to the comparisons of interest including: IBD vs control (IBD); CD vs control (CD); UC vs control (UC); and CD vs UC as well as associations to clinical disease activity indices (log2HBI and log2SCCAI) and endoscopy scores (log2SESCD and Mayo_endo). We indicated the 10% FDR threshold as a dashed blue line and the number of DMs). B) A heatmap summarizing the enrichments of the serum and stool DMs according to metabolite classifications. Only classifications that were significantly enriched at FDR <0.05 for at least one endpoint are shown. C) Summary of differentially expressed SCFAs according to endpoint with effect and FDR. Only SCFAs passing FDR <0.10 are shown (Table S2).
Figure 3.
Figure 3.. Genetic control of serum butyrate and lack of association with IBD-related traits
A) Manhattan plots displaying the GWAS results of butyrate and various related metabolites (rows). Genome-wide significance threshold: 5E-8/1300=3.8E-11. B) Results of genetic colocalization between IBD, UC or CD risk and serum butyrate levels as well as results of the MR analysis. Metabolites on the vertical axis, estimates on the horizontal axis, genetic regions in vertical stripes. Posterior colocalization probabilities (left panel), and causal OR (right panel). Within each panel, a dotted vertical line highlights a point of interest: 0.8 posterior probability of colocalization on the left panel, and OR=1 on the right panel. Hatched line indicates position of OR=1, values to the right of the hatched line indicate higher levels of the corresponding metabolite are associated with increased risk and values to the left of the hatched line indicate the opposite. Colocalization and OR estimates were based on summary statistics from the present study (metabolome GWAS) and de Lange et al (IBD GWAS). C) Biochemical schema showing metabolic substrates and products of SCAD. Metabolites shaded in red are novel GWAS observations and those in blue are known ACADS GWAS associations. D) Serum (upper panel) and stool (lower panel) butyrate levels grouped by i) genotype at the rs35599677 locus and ii) disease severity as measured by endoscopic assessments. Mayo Scores ≥1 were classified as severe, scores <1 as mild. SESCD ≥3 were classified as severe, <3 as mild.
Figure 4.
Figure 4.. Genetic colocalization between essential fatty acids, FADS1/2 and IBD risk
A) Regional association plots of the genetic associations at the Chr11 position which contains the FADS locus indicate co-localization of IBD risk and levels of serum metabolites (ids 33228, 36600, 42449, 42450, 52446, 52462, 52603, 52687, 52689, 54960, 54961, 57450, and 57467). Genome-wide significance threshold: 5E-8/1300=3.8E-11. B) Graph of the results of genetic colocalization analysis, testing for a shared genetic locus controlling serum levels of various omega-6 containing PUFAs with risk of IBD, CD or UC. Also, plotted are the results of the MR analysis including the OR and Fieller’s confidence intervals. Metabolites on the vertical axis, estimates on the horizontal axis, genetic regions in vertical stripes. See Figure Legend 3 for details. C) A schema showing putative causal associations (solid lines) and statistical associations (dashed line) with edges labeled according to the data sources. Evidence for the association between genetic variation and mRNA transcripts was gathered from published eQTL studies or GTEx database searches. D) Biochemical schema of the metabolism of omega-6 and omega-3 PUFAs with the position of FADS1 and FADS2. The bottom image summarizes results of MR which predicts that elevated serum levels of the precursor omega-6 PUFA increase risk of CD, whereas decreased levels of the PUFA end-products are protective.
Figure 5.
Figure 5.. TMEM229B expression and choline plasmalogens as candidate mediator of CD risk
A) Regional association plots of genetic associations at the Chr14 position which contains TMEM229B, with CD risk and levels of serum C16:0 plasmalogen levels. Genome-wide significance threshold: 5E-8/1300=3.8E-11. B) Results of genetic colocalization and MR analysis between CD risk loci and the plasmalogen serum concentration on Chr14. Metabolites on the vertical axis, estimates on the horizontal axis, genetic regions in vertical stripes. See Figure 3 legend for details. C) Bayesian gene regulatory subnetwork built from the blood RNA sequencing data and genotype information on MSCCR CD patients. Arrows indicate predicted causal relationships between genes. Blue colored nodes indicate genes of interest used in discerning TMEM229B’s function or possible role in IBD pathology. Yellow nodes indicate genes belonging to the gene regulatory subnetwork. D) A summary of the evidence on the role of TMEM229B and the plasmalogen on CD risk. Solid lines represent putative causal associations; dashed lines represent statistical associations; edges are further labeled with their data source. E-F) MYC-tagged and non-tagged TMEM229B were overexpressed by transfection into HEK293 cells and cell pellets were collected and subjected to various lipid analyses (ST10). Plotted are the ratio of C16:0 in plasmalogen versus C16:0 in total lipid in E, and relative abundance of the plasmalogen PC(P-32:0) in F (*p<0.05).

References

    1. Ng SC et al. Worldwide incidence and prevalence of inflammatory bowel disease in the 21st century: a systematic review of population-based studies. Lancet 390, 2769–2778 (2018). - PubMed
    1. Graham DB & Xavier RJ Pathway paradigms revealed from the genetics of inflammatory bowel disease. Nature 578, 527–539 (2020). - PMC - PubMed
    1. Lee HS & Cleynen I Molecular Profiling of Inflammatory Bowel Disease: Is It Ready for Use in Clinical Decision-Making? Cells 8(2019). - PMC - PubMed
    1. Seyed Tabib NS et al. Big data in IBD: big progress for clinical practice. Gut 69, 1520–1532 (2020). - PMC - PubMed
    1. Lloyd-Price J et al. Multi-omics of the gut microbial ecosystem in inflammatory bowel diseases. Nature 569, 655–662 (2019). - PMC - PubMed

Publication types

MeSH terms