Observational Study
. 2022 Apr:236:249-260.
doi: 10.1016/j.ajo.2021.10.032. Epub 2021 Nov 13.

Optical Coherence Tomography Measurements of the Retinal Pigment Epithelium to Bruch Membrane Thickness Around Geographic Atrophy Correlate With Growth

Affiliations
Observational Study

Optical Coherence Tomography Measurements of the Retinal Pigment Epithelium to Bruch Membrane Thickness Around Geographic Atrophy Correlate With Growth

Zhongdi Chu et al. Am J Ophthalmol. 2022 Apr.

Abstract

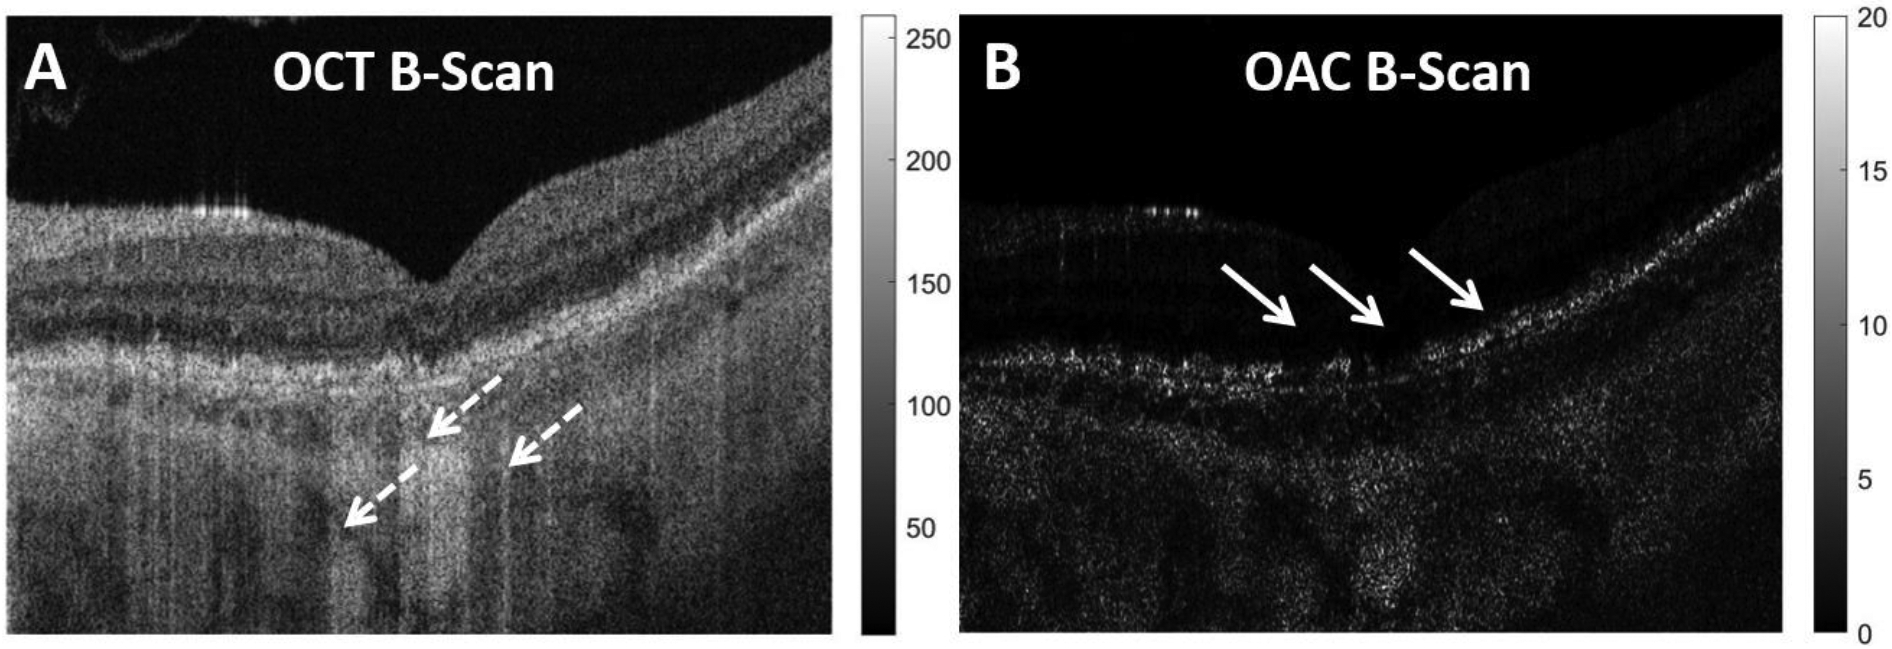
Purpose: The retinal pigment epithelium (RPE) to Bruch membrane (BM) distance around geographic atrophy (GA) was measured using an optical attenuation coefficient (OAC) algorithm to determine whether this measurement could serve as a clinical biomarker to predict the annual square root enlargement rate (ER) of GA.

Design: A retrospective analysis of a prospective, observational case series.

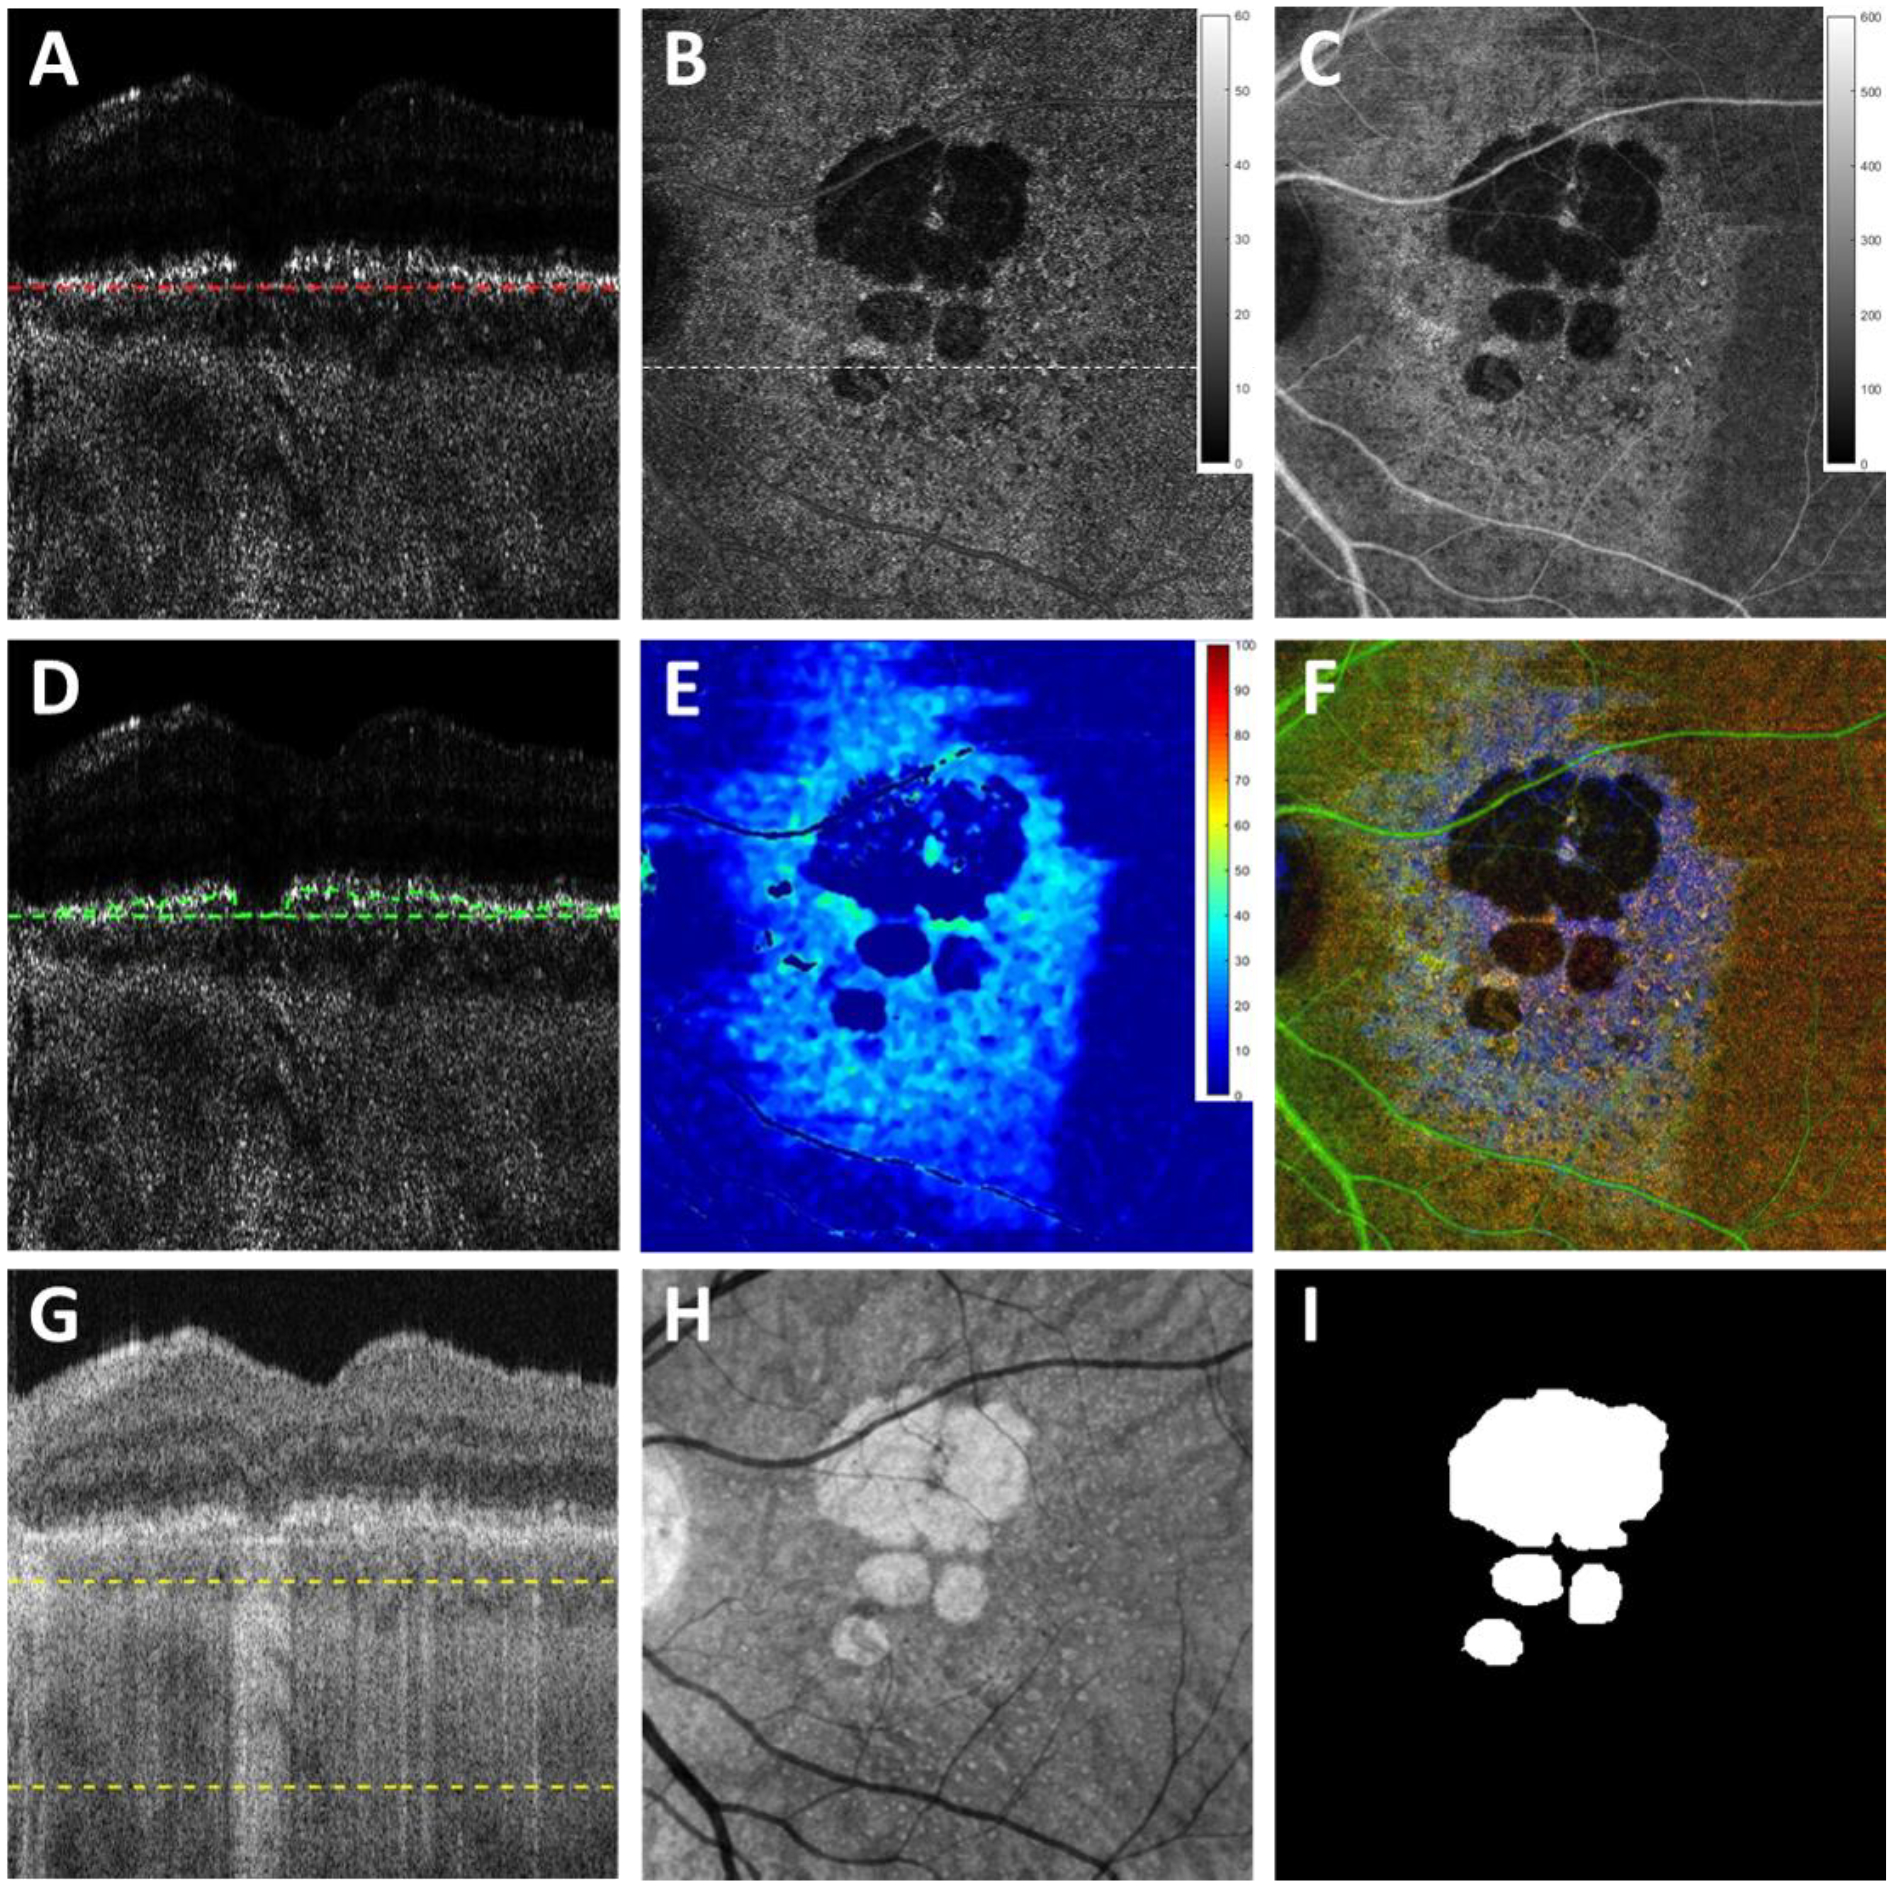
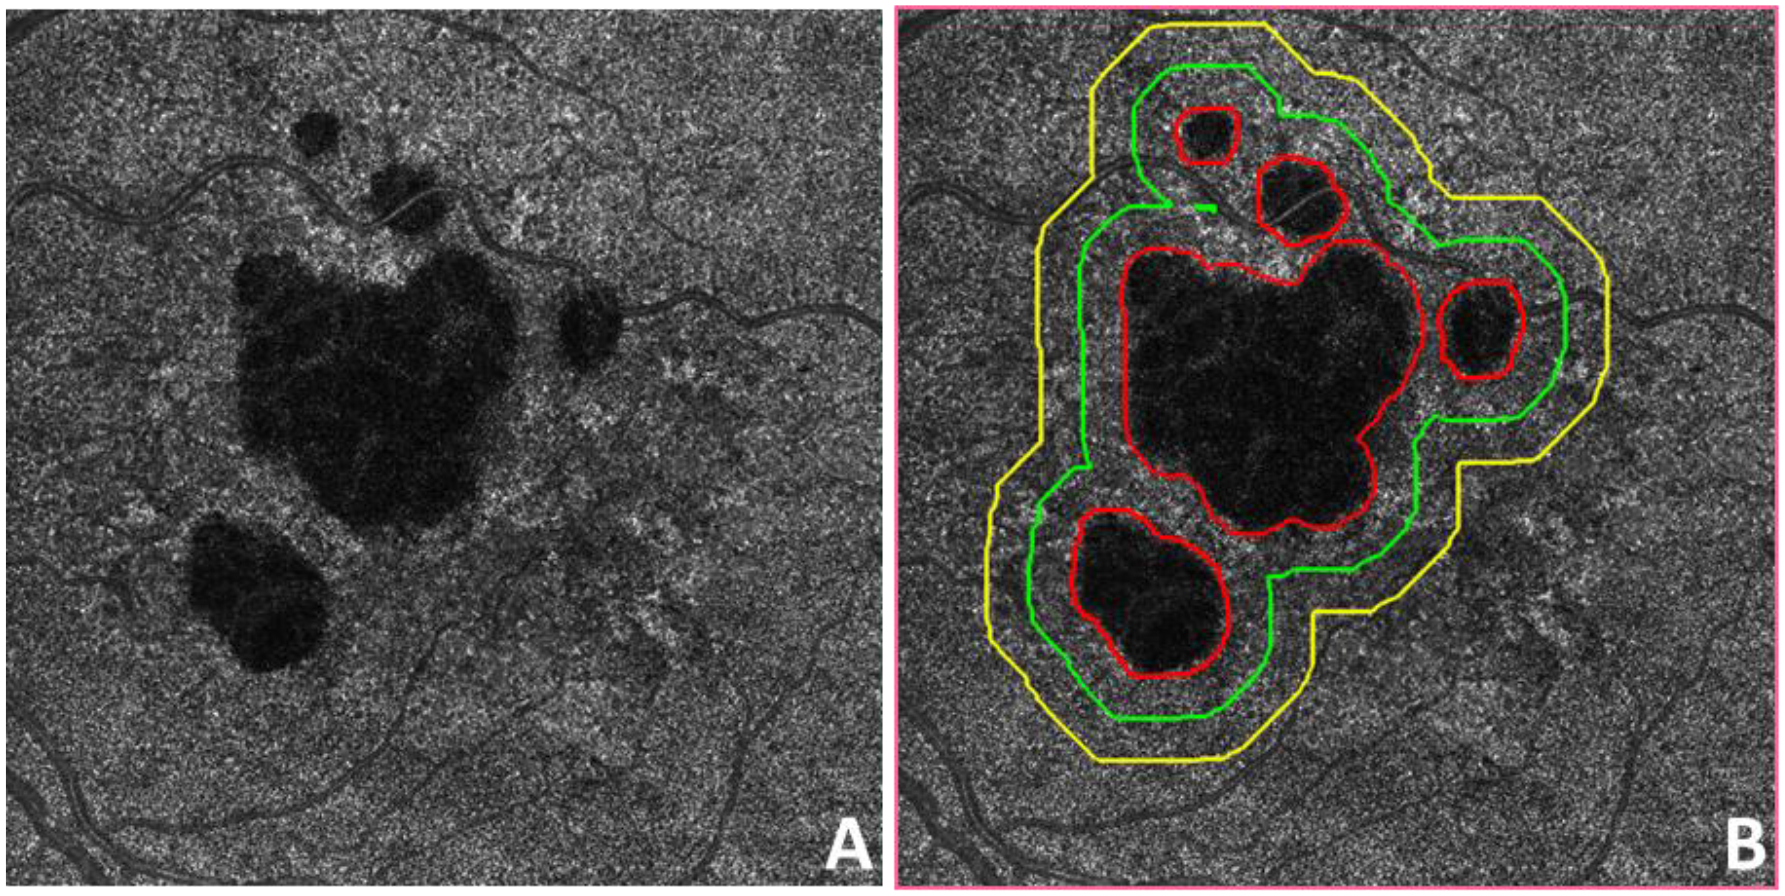
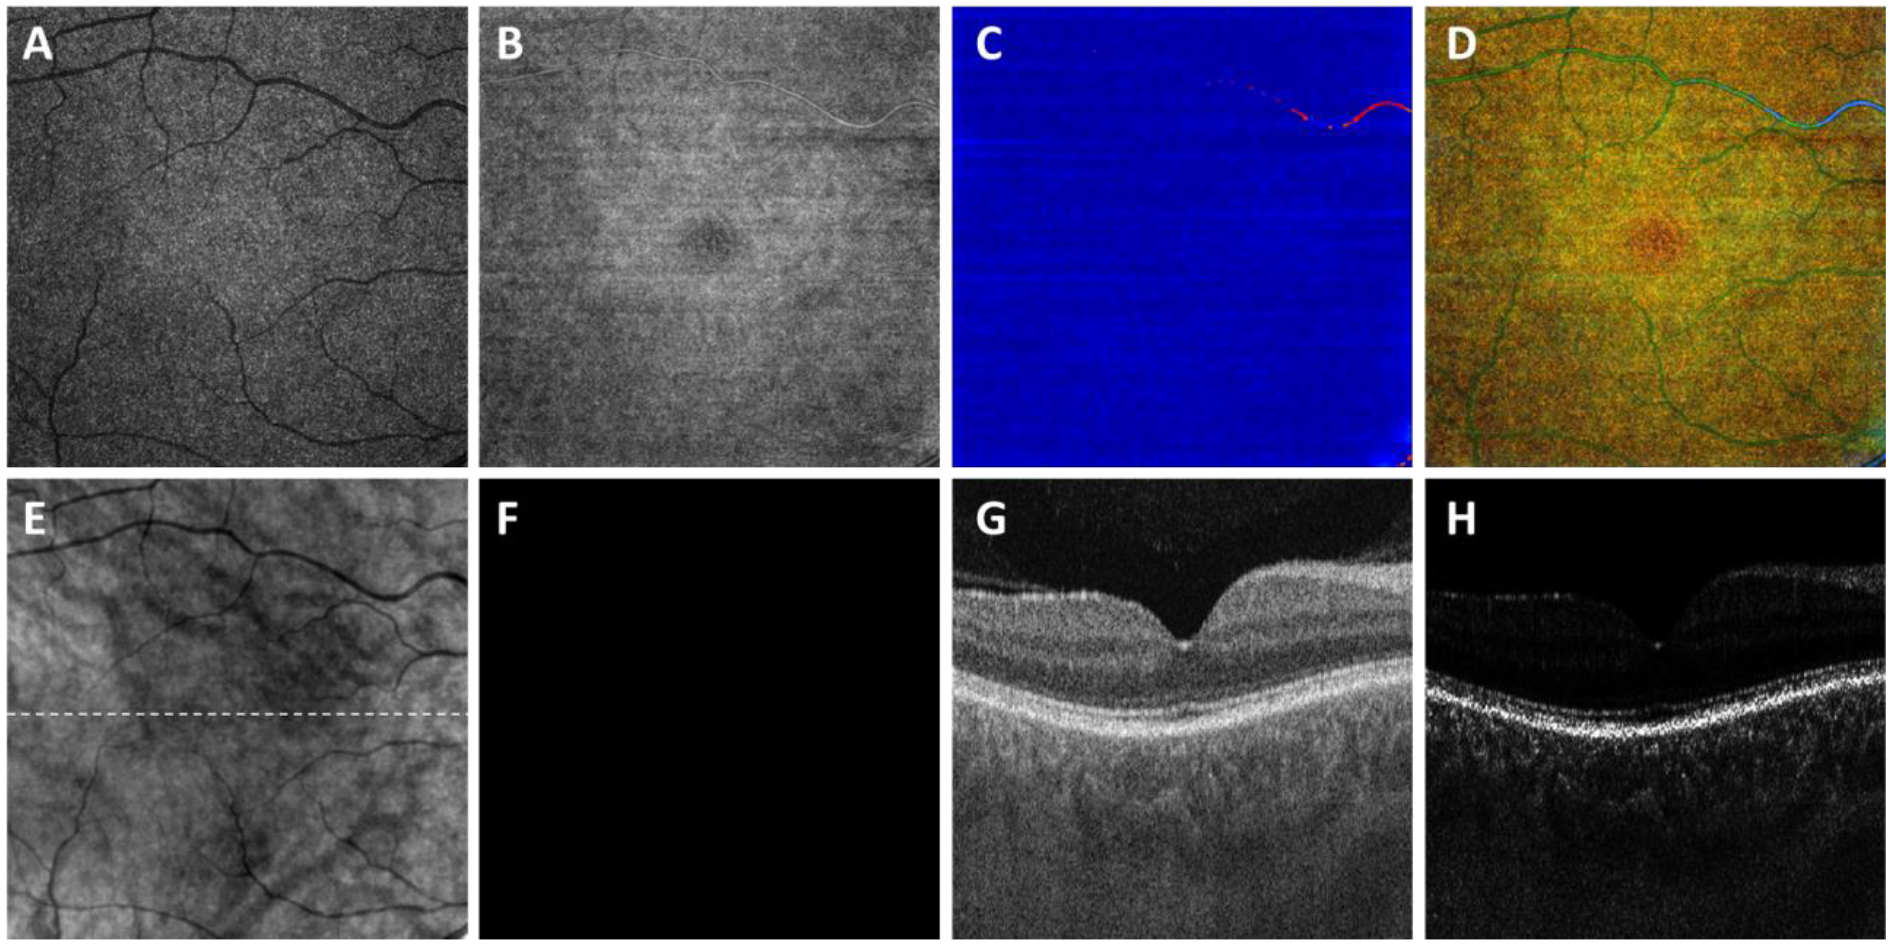
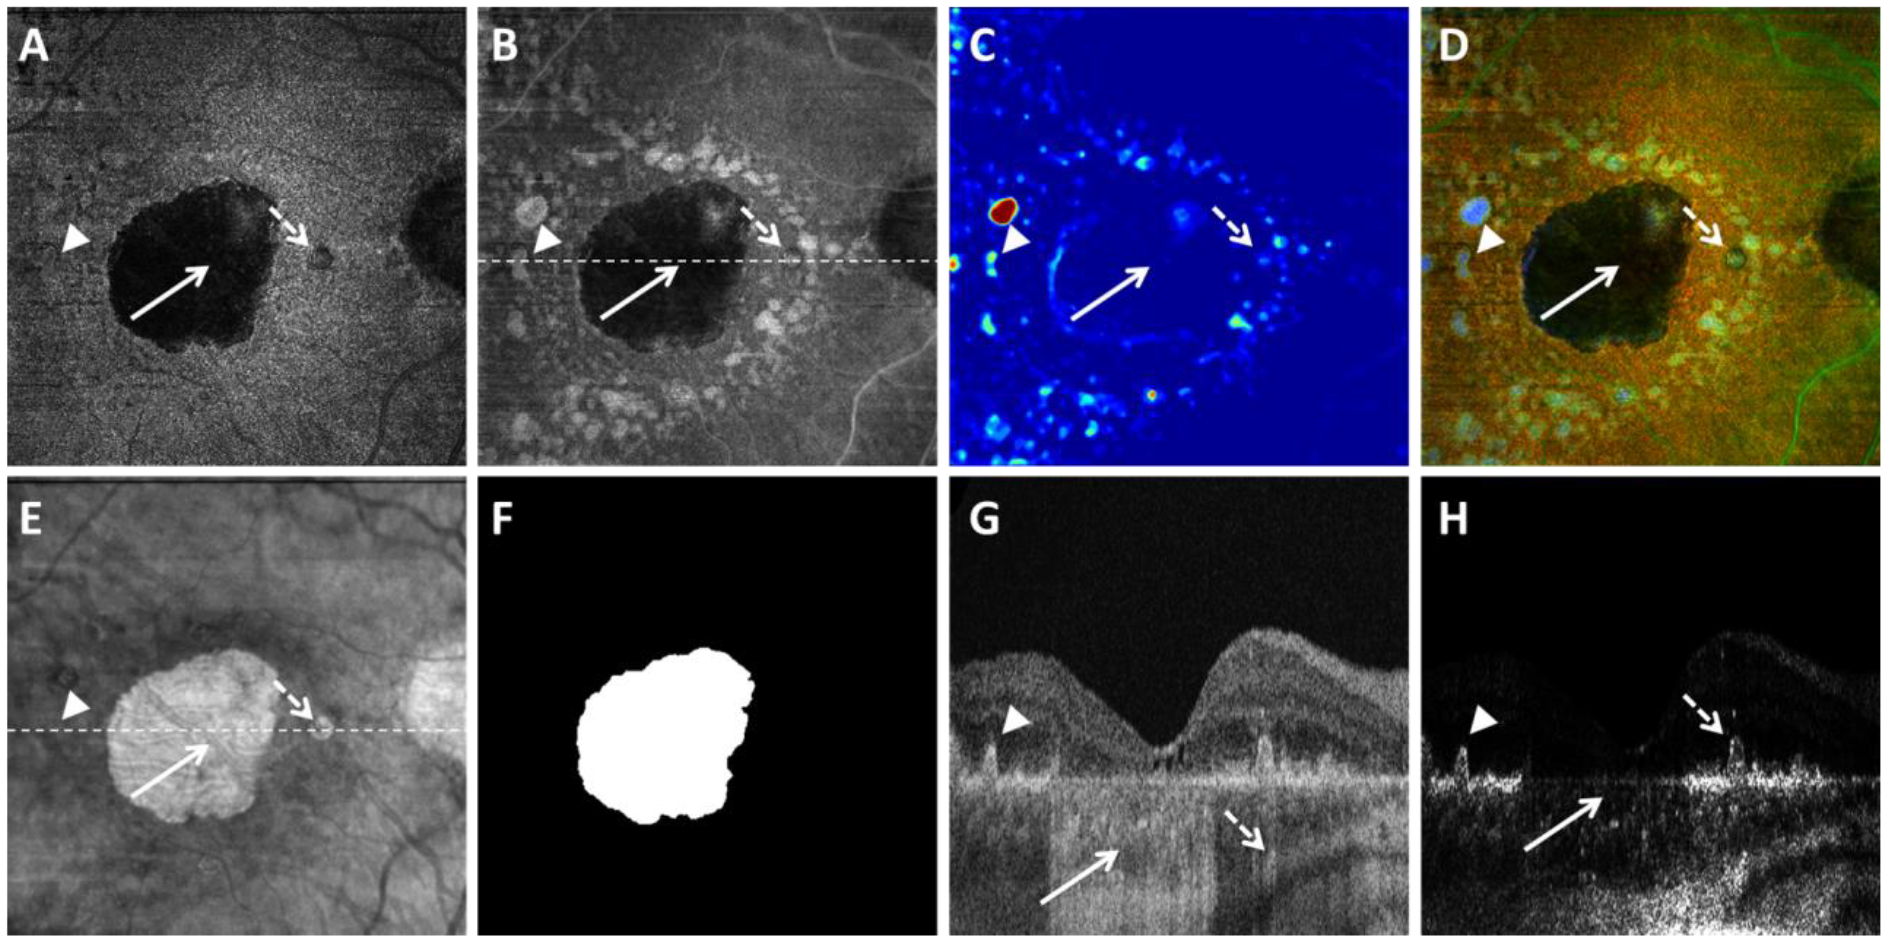
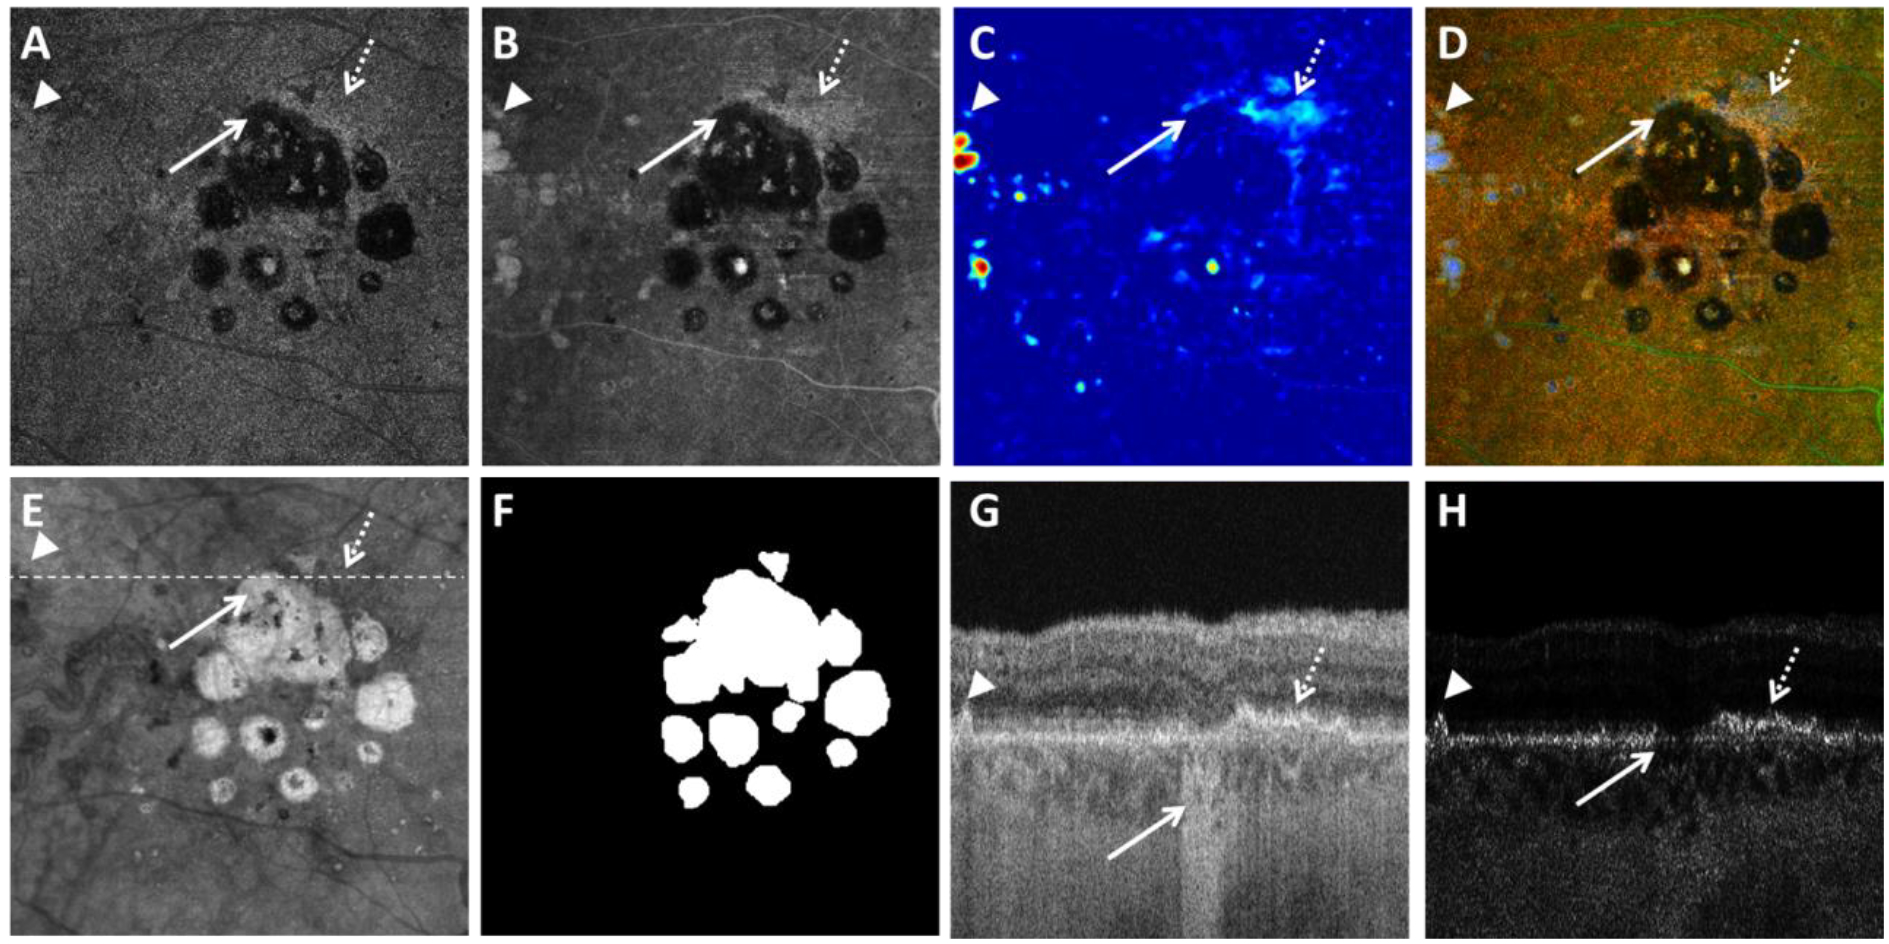
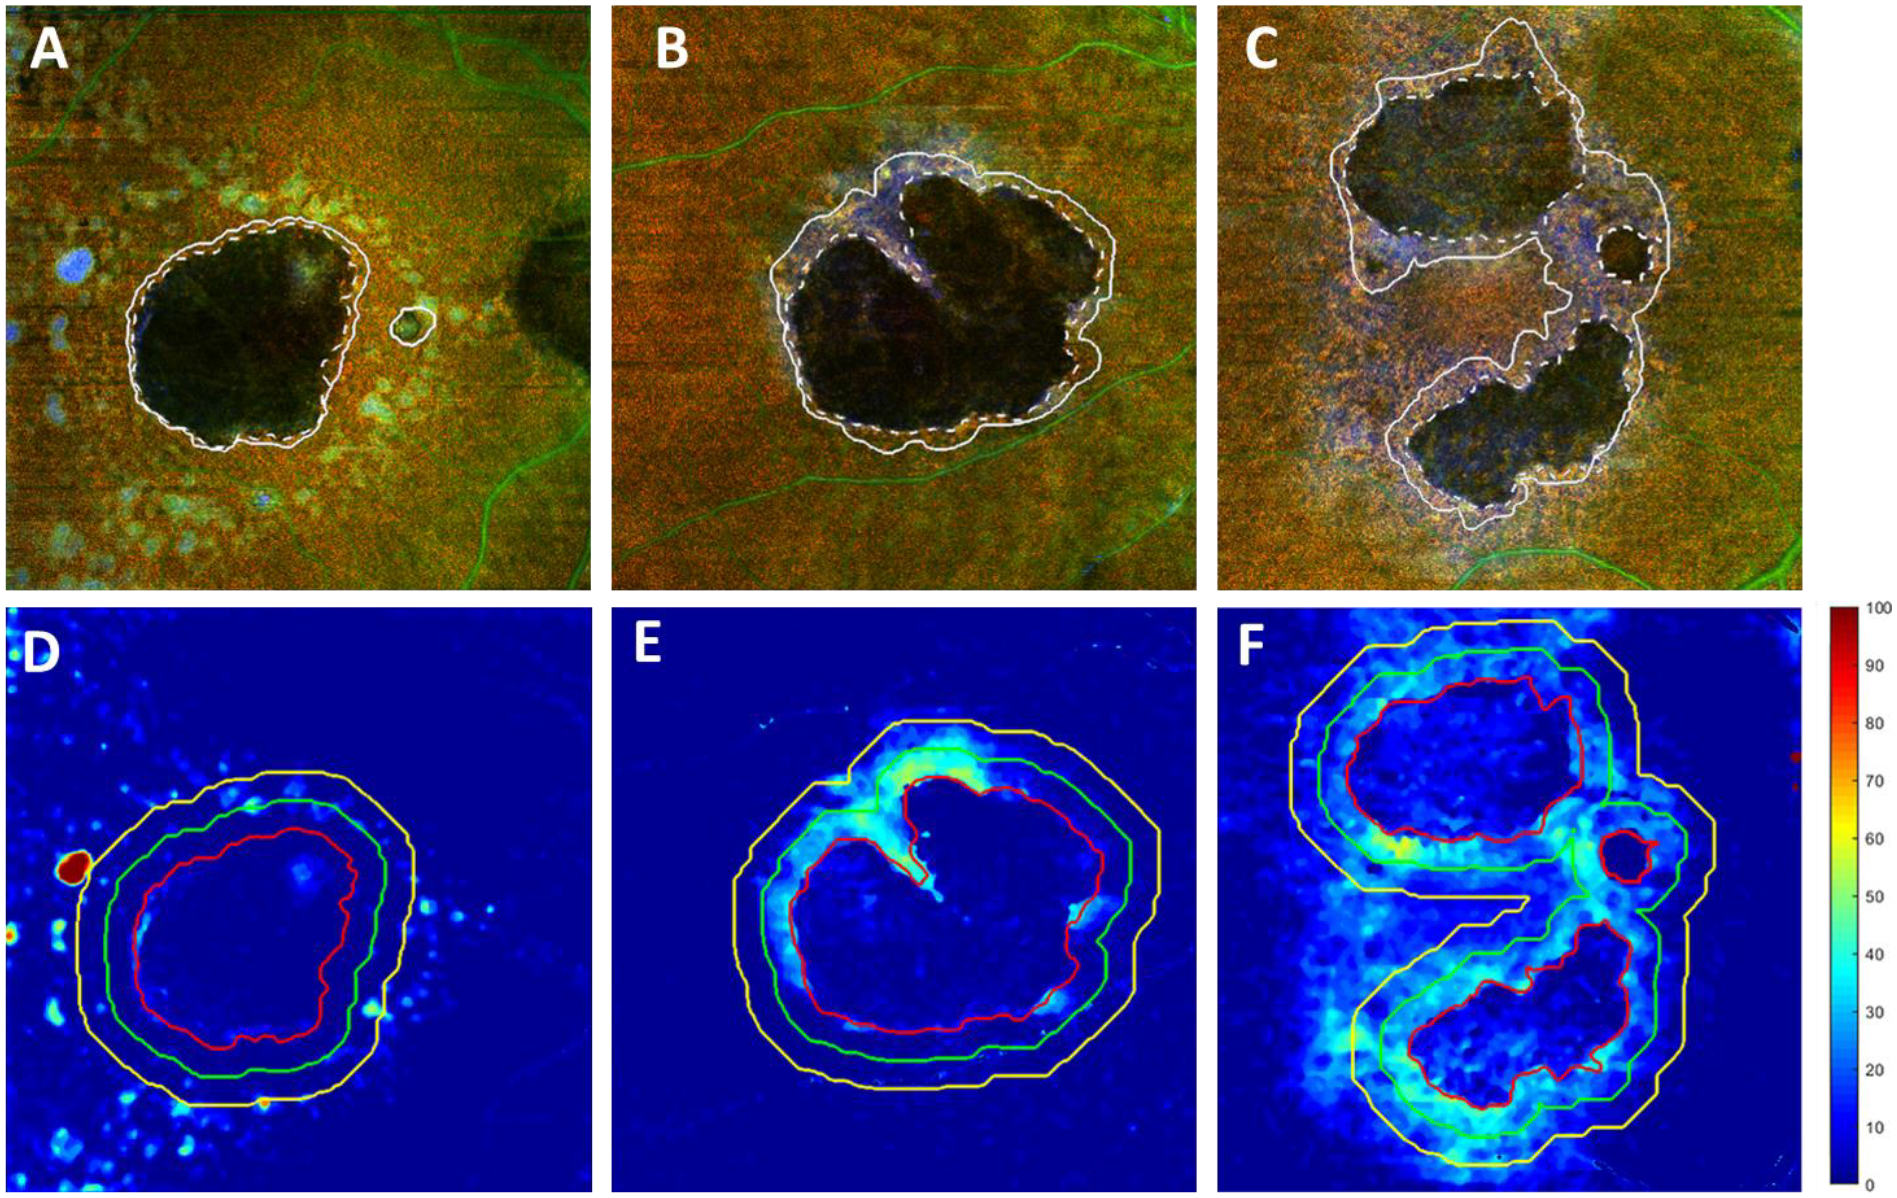
Methods: Eyes with GA secondary to age-related macular degeneration (AMD) were imaged with swept-source OCT (SS-OCT) using a 6 × 6-mm scan pattern. GA lesions were identified and measured using customized en face OCT images, and GA annual square root ERs were calculated. At baseline, the OACs were calculated from OCT datasets to generate customized en face OAC images for GA visualization. RPE-BM distances were measured using OAC data from different subregions around the GA.

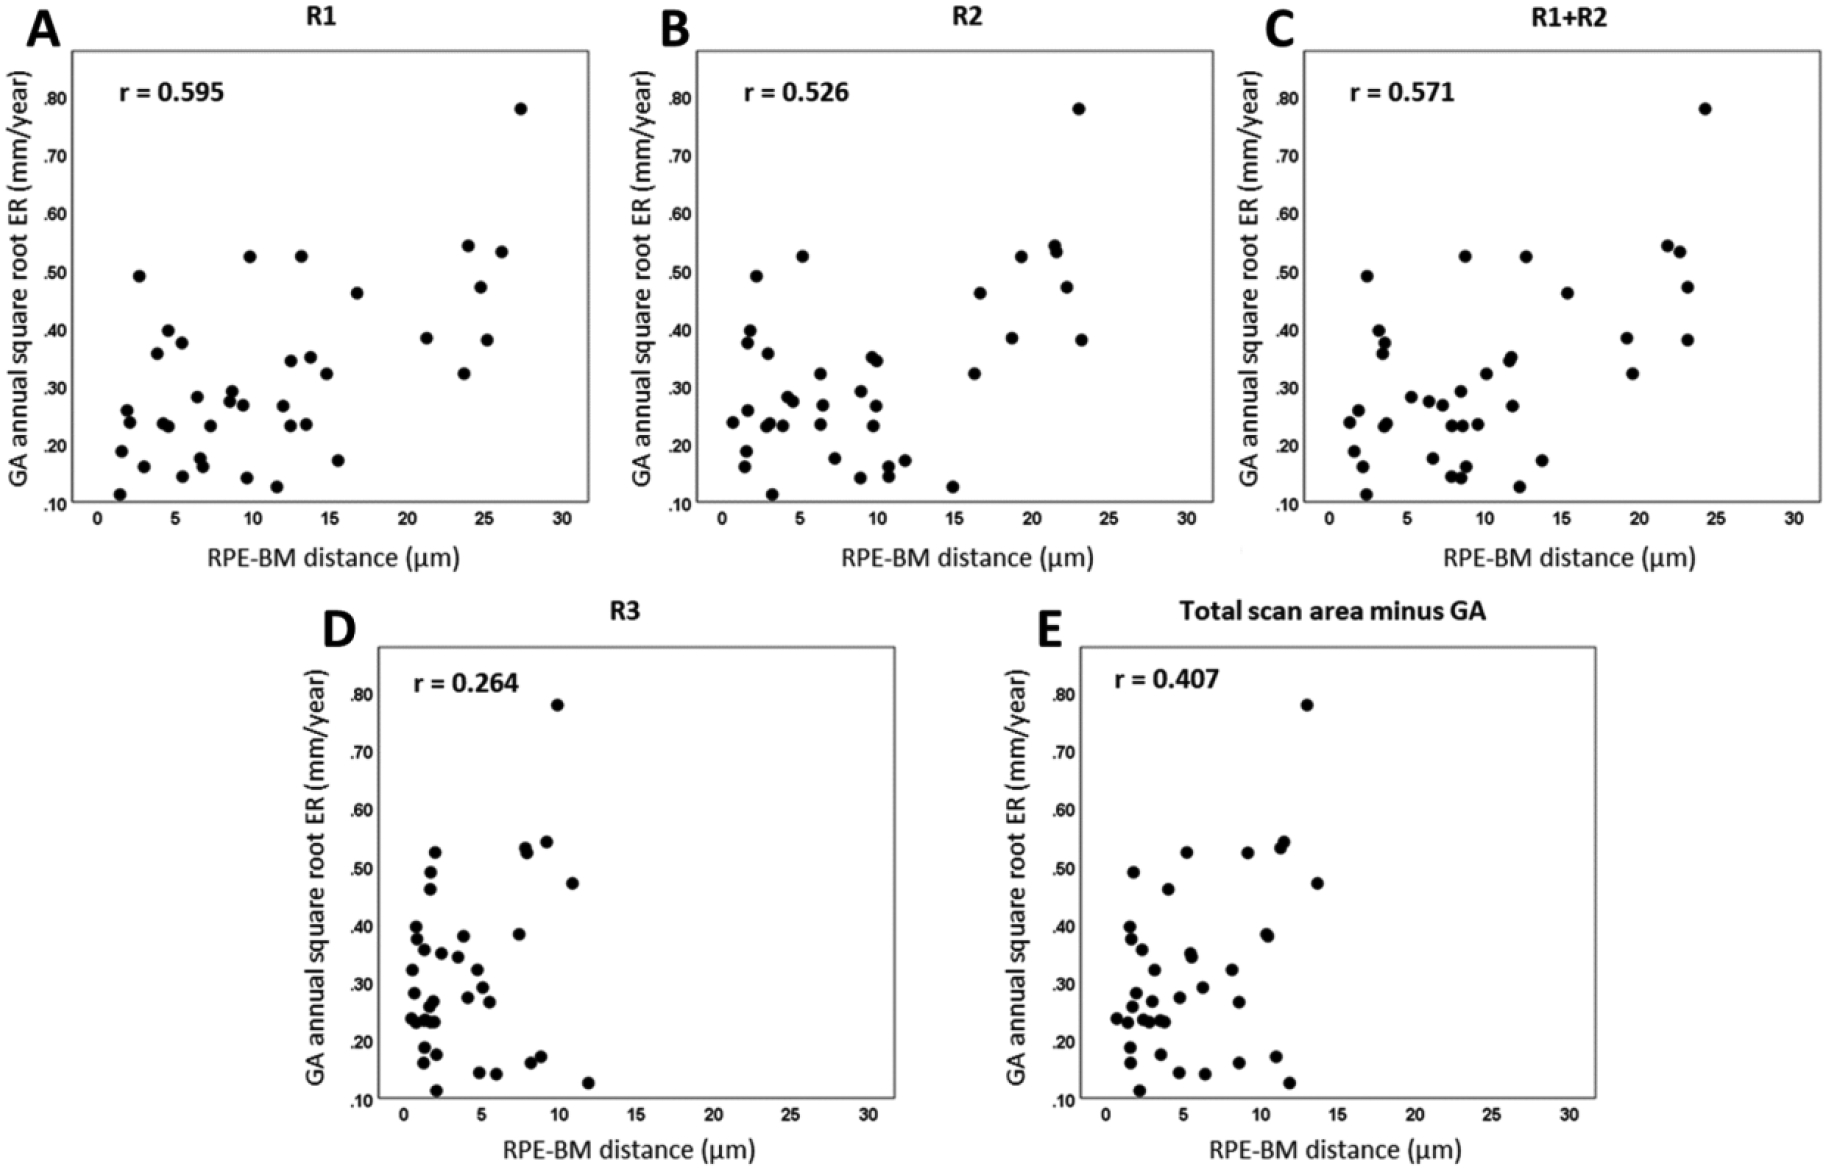
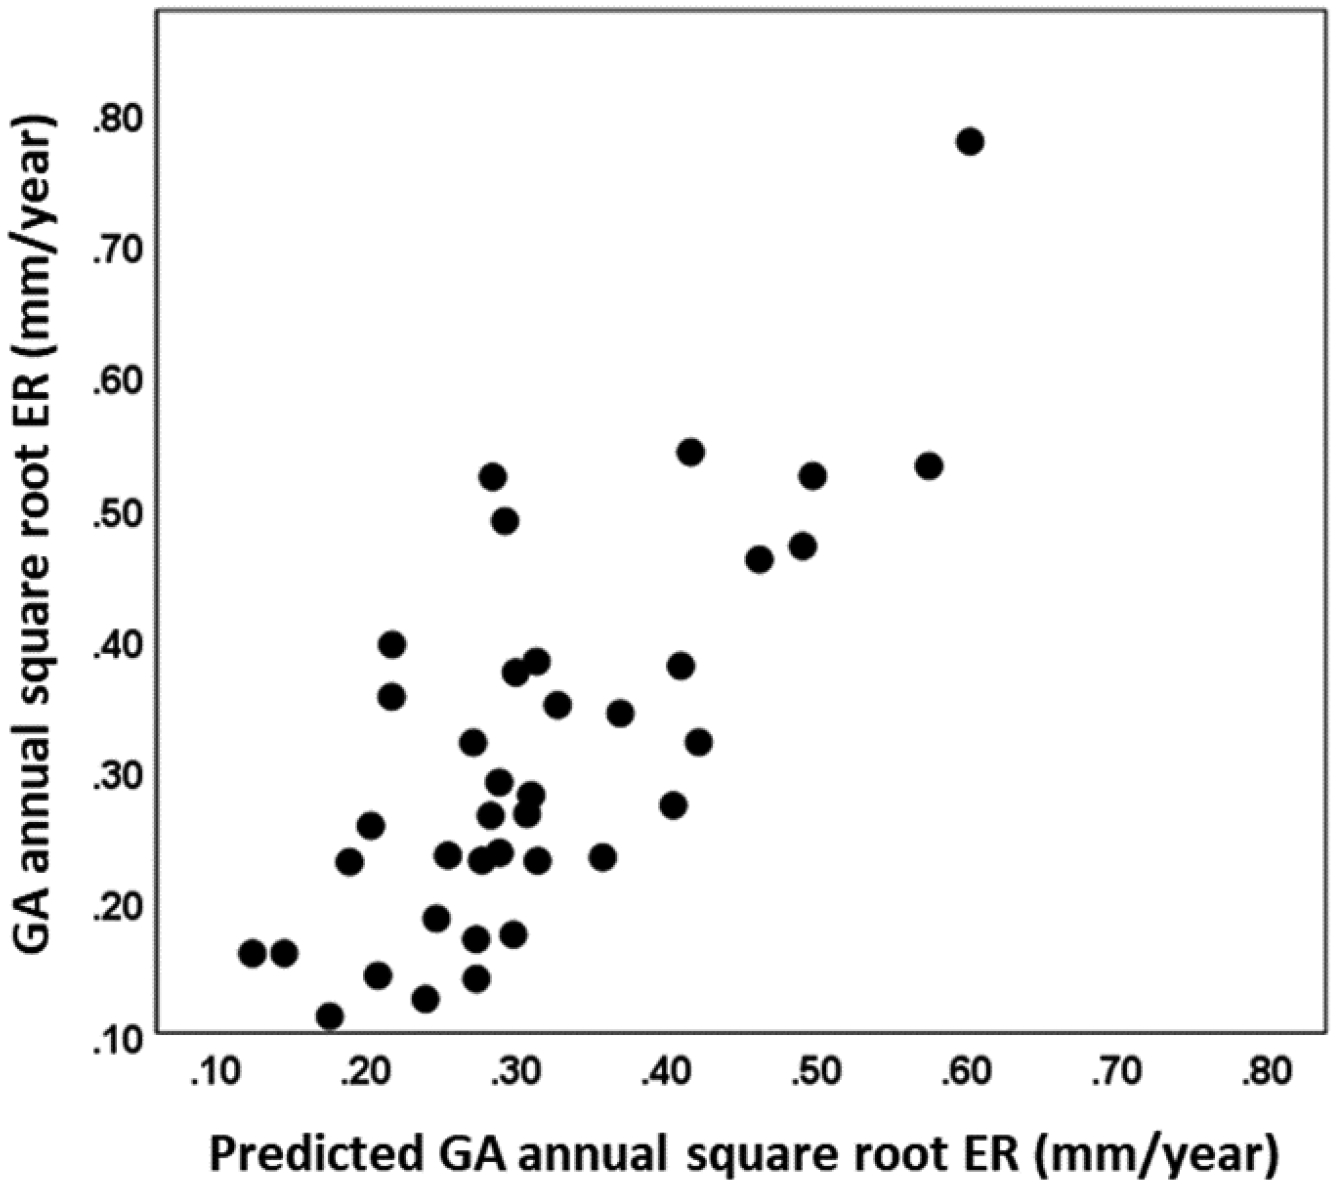
Results: A total of 38 eyes from 27 patients were included in this study. Measured RPE-BM distances were the highest in the region closest to GA. The RPE-BM distances immediately around the GA were significantly correlated with GA annual square root ERs (r = 0.595, P < .001 for a 0- to 300-µm rim around the GA). No correlations were found between RPE-BM distances and previously published choriocapillaris (CC) flow deficits in any subregions.

Conclusions: RPE-BM distances from regions around the GA significantly correlate with the annual ERs of GA. These results suggest that an abnormally thickened RPE/BM complex contributes to GA growth and that this effect is independent of CC perfusion deficits.


Figures

Figure 1:
Figure 1:
Example of a traditional swept source OCT (SS-OCT) B-scan and its corresponding optical attenuation coefficient (OAC) B-scan. A: SS-OCT B-scan from a patient diagnosed with geographic atrophy (GA), dashed white arrow indicates regions with choroidal hyper-transmission defects (hyperTDs) caused by compromised retinal pigment epithelium (RPE). B: Corresponding OAC B-scan of panel A, the solid white arrows indicate the areas where the RPE is compromised that’s responsible for the choroidal hyperTDs seen on the SS-OCT B-scan.
Figure 2:
Figure 2:
Images obtained using the optical attenuation coefficient (OAC) algorithms and the traditional OCT images with choroidal hypertransmission defect (hyperTDs). A: swept source OCT (SS-OCT) OAC B-scan with red dashed lines of the first slab, which includes 600 μm above Bruch’s membrane (BM) (upper boundary not shown due to cropping of the image); B: OAC maximum projection en face image of the first slab with a dynamic range of 0–60 (mm−1). C: OAC sum projection en face image of the first slab with a dynamic range of 0–600 (unitless). D: OAC B-scan with green dashed lines indicating the distance between OAC identified retinal pigment epithelium (RPE) and manually segmented BM. E: OAC elevation map calculated using the BM segmentation of the first slab to the OAC line shown in Panel D with the distance from the RPE to BM shown in color having a dynamic range of 0–100 (μm). F: OAC false color composite image of panels B (red channel), C (green channel) and E (blue channel). G: The same SS-OCT B-scan image as panel A with yellow dashed lines depicting the second slab from 64 μm below BM to 400 μm below BM, also known as the subRPE slab. H: OCT sum en face projection of the subRPE slab depicting the area with choroidal hyperTDs. I: Ground truth area of geographic atrophy shown in Panel H and identified by graders.
Figure 3:
Figure 3:
Example of regions analyzed around geographic atrophy (GA). A: Swept source OCT (SS-OCT) optical attenuation coefficient (OAC) max en face image of a subject diagnosed with GA. B: The same OAC max image as in panel A with red lines depicting manually graded area of GA. Green line represents a 300 μm wide (1-degree) region outside the GA boundary. Yellow line represents a 600 μm wide (2-degree) region outside the GA boundary. The distance between the green and yellow lines is 300 μm.
Figure 4:
Figure 4:
Visualization of a normal eye using the optical attenuation coefficient (OAC) estimated from swept source optical coherence tomography (SS-OCT) scans in a subject without ocular pathology. A: OAC max image. B: OAC sum image. C: OAC elevation map. D: OAC false color image. E: OCT subRPE image. F: Ground truth of GA generated by professional graders. G: OCT B-scan from the same subject, with the location represented in white dashed line in panel B. H: OAC B-scan from the same subject, with the same location as panel G. All images are from a 6×6 mm SS-OCT scan.
Figure 5:
Figure 5:
Visualization of geographic atrophy (GA) using the optical attenuation coefficient (OAC) estimated from swept source optical coherence tomography (SS-OCT) scans in a patient with a unifocal lesion. A: OAC max image. B: OAC sum image. C: OAC elevation map. D: OAC false color image. E: OCT subRPE image. F: Ground truth of GA generated by graders. G: OCT B-scan from the same subject, with the location represented in white dashed line in panel B. H: OAC B-scan from the same subject, with the same location as panel G. Solid white arrows indicate complete retinal pigment epithelium (RPE) and outer retinal atrophy, dashed white arrows indicate incomplete RPE and outer retinal atrophy, arrow heads indicate drusen. All images are from a 6×6 mm SS-OCT scan.
Figure 6:
Figure 6:
Visualization of geographic atrophy (GA) using the optical attenuation coefficient (OAC) estimated from swept source optical coherence tomography (SS-OCT) scans in a patient with a multifocal lesion. A: OAC max image. B: OAC sum image. C: OAC elevation map. D: OAC false color image. E: OCT subRPE image. F: Ground truth of GA generated by graders. G: OCT B-scan from the same subject, with the location represented in white dashed line in panel B. H: OAC B-scan from the same subject, with the same location as panel G. Solid white arrows indicate complete retinal pigment epithelium (RPE) and outer retinal atrophy, dashed white arrows indicate detected RPE-BM splitting, arrow heads indicate drusen. All images are from a 6×6 mm SS-OCT scan.
Figure 7:
Figure 7:
Scatter plots showing correlations between retinal pigment epithelium-Bruch’s membrane (RPE-BM) distance at baseline and the annual square root enlargement rates (ERs) of geographic atrophy (GA) in different regions: R1 (A), R2 (B), R1+R2 (C), R3 (D) and total scan area minus GA (E).
Figure 8:
Figure 8:
Examples of the retinal pigment epithelium (RPE) - Bruch’s membrane (BM) distances measured using the optical attenuation coefficient (OAC) around geographic atrophy (GA) lesions with different annual square root enlargement rates (ERs). A-C show baseline visit false color OAC images of subjects with GA having an annual square root ERs of 0.13 mm/year, 0.32 mm/year, and 0.52 mm/year, respectively. Dashed lines depict the outlined GA boundary at baseline visits and the solid lines depict the outlined GA boundary at the 1-year follow-up visits. D-F show the OAC measured RPE to BM distance maps from baseline visits of the same subjects. Red lines represent the outlined GA boundary, green lines represent a 300 μm rim around the GA boundary and yellow lines represent a 600 μm rim around the GA boundary.
Figure 9:
Figure 9:
Scatter plot of measured geographic atrophy (GA) annual square root enlargement rate (ER) against predicted GA annual square root ER for all 38 eyes. Predicted GA annual square root ER was generated using a multiple regression model with the retinal pigment epithelium to Bruch’s membrane distance in the 0–300 μm rim outside of the GA and choriocapillaris flow deficit percentage in the total scan area minus GA.

References

    1. Fleckenstein M, Keenan TD, Guymer RH, et al. Age-related macular degeneration. Nature Reviews Disease Primers. 2021;7(1):1–25. - PubMed
    1. Bird AC, Phillips RL, Hageman GS. Geographic atrophy: a histopathological assessment. JAMA ophthalmology. 2014;132(3):338–345. - PMC - PubMed
    1. Chakravarthy U, Bailey CC, Johnston RL, et al. Characterizing disease burden and progression of geographic atrophy secondary to age-related macular degeneration. Ophthalmology. 2018;125(6):842–849. - PubMed
    1. Sadda SR, Guymer R, Holz FG, et al. Consensus definition for atrophy associated with age-related macular degeneration on OCT: classification of atrophy report 3. Ophthalmology. 2018;125(4):537–548. - PMC - PubMed
    1. Rosenfeld PJ. Preventing the growth of geographic atrophy: an important therapeutic target in age-related macular degeneration. Ophthalmology. 2018;125(6):794–795. - PubMed

Publication types

MeSH terms