. 2021 Dec:161:105561.
doi: 10.1016/j.nbd.2021.105561. Epub 2021 Nov 13.

SARS-CoV-2 deregulates the vascular and immune functions of brain pericytes via Spike protein

Affiliations

SARS-CoV-2 deregulates the vascular and immune functions of brain pericytes via Spike protein

Rayan Khaddaj-Mallat et al. Neurobiol Dis. 2021 Dec.

Abstract

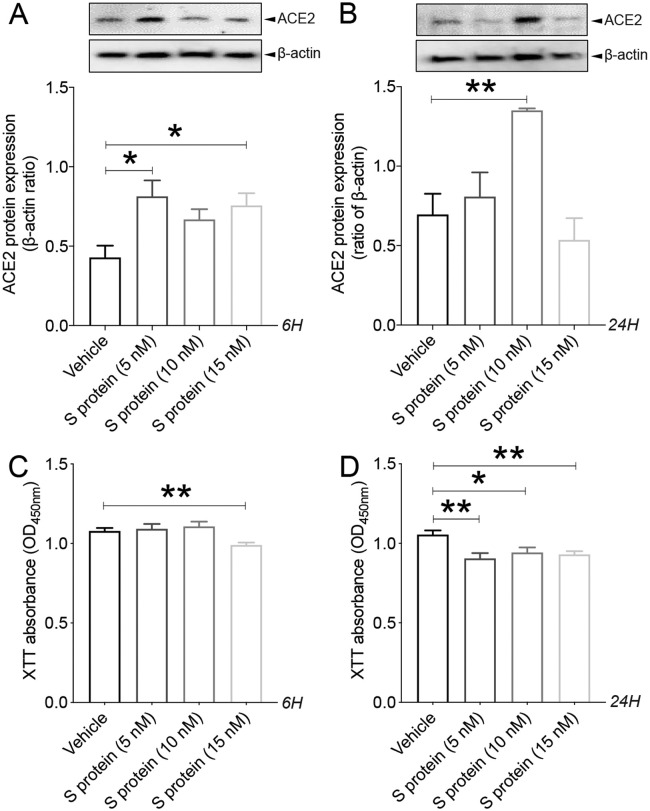
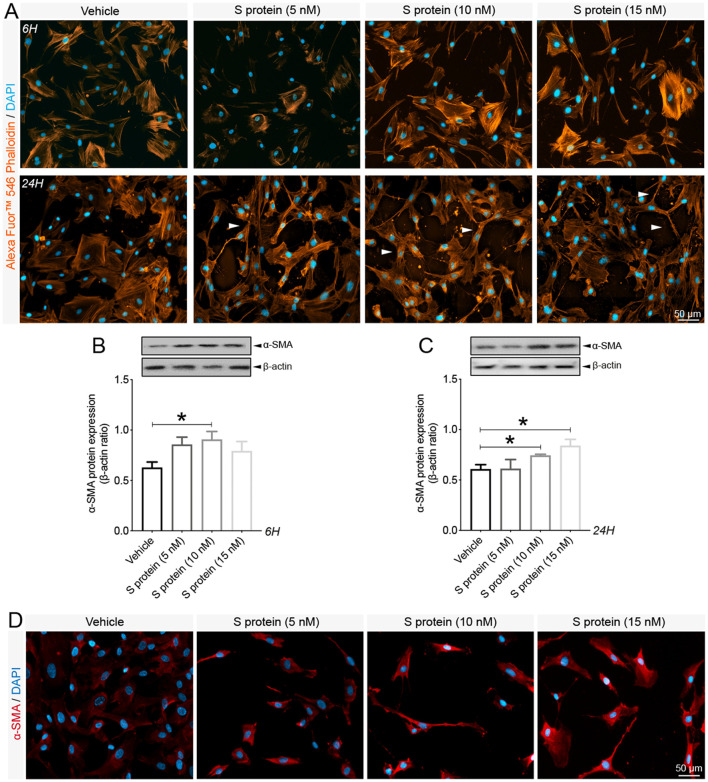
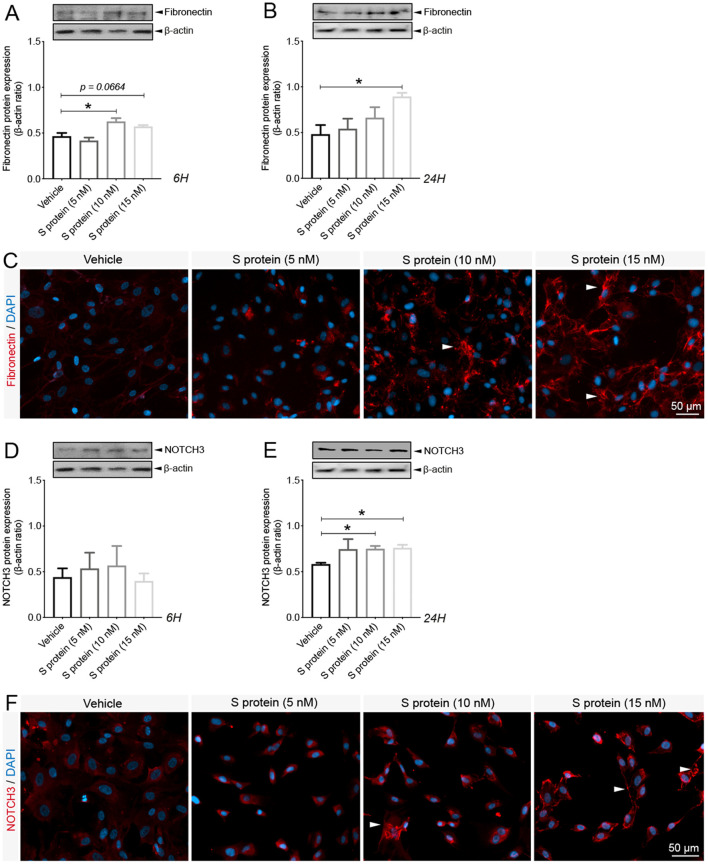
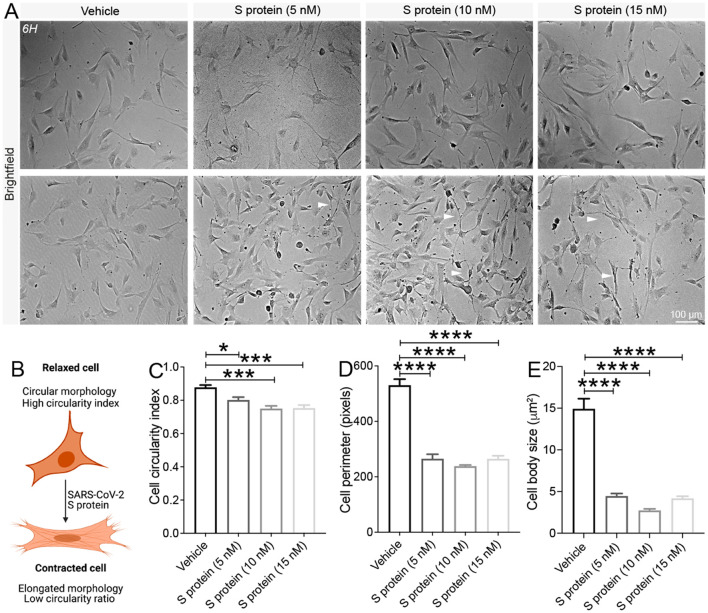
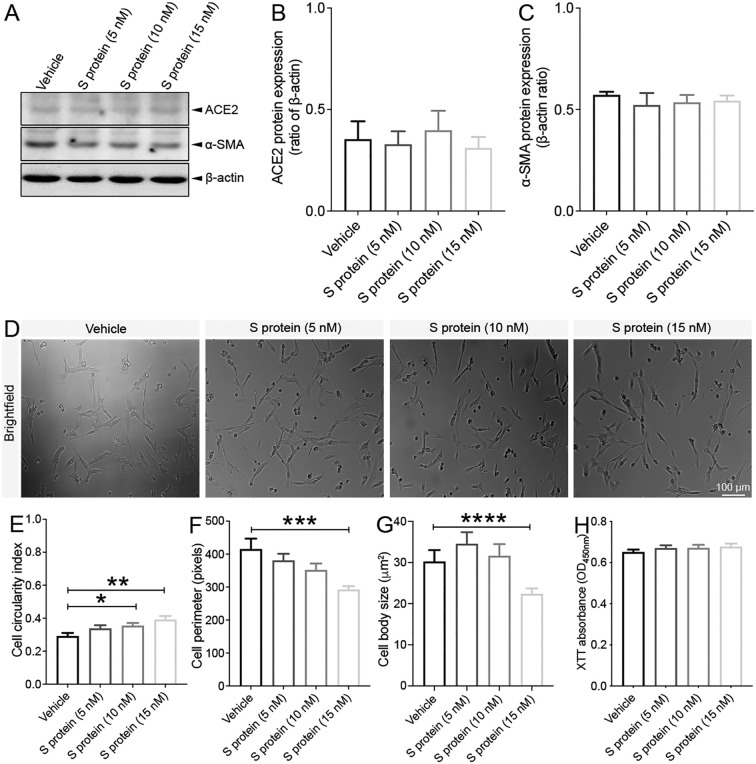
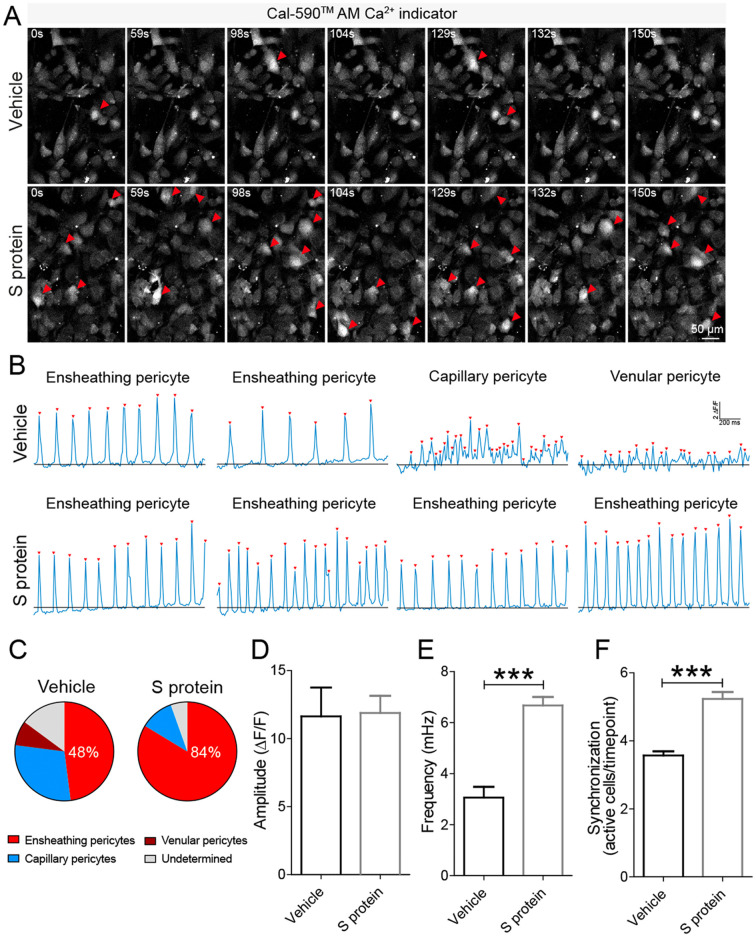
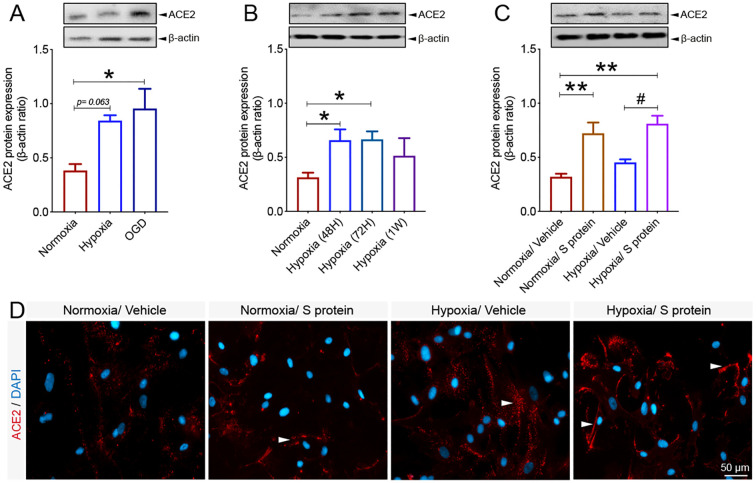
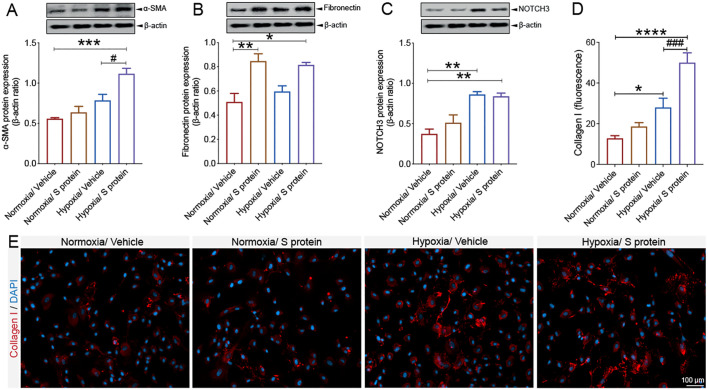
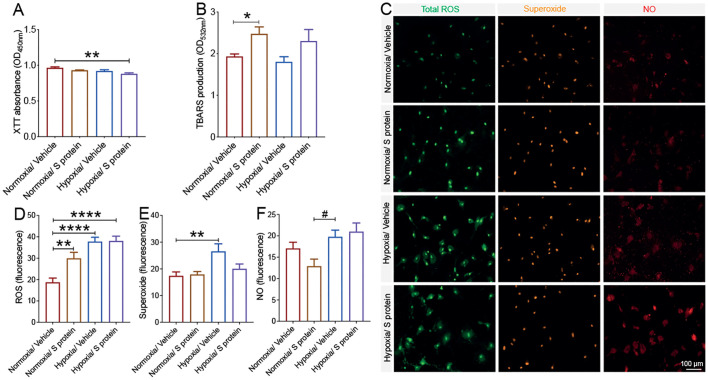
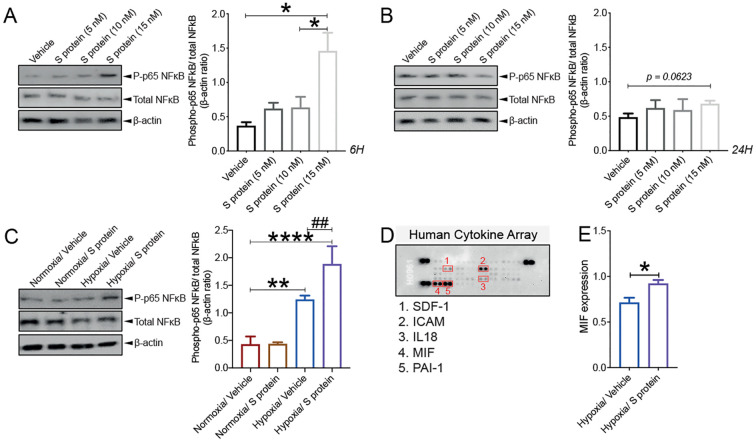
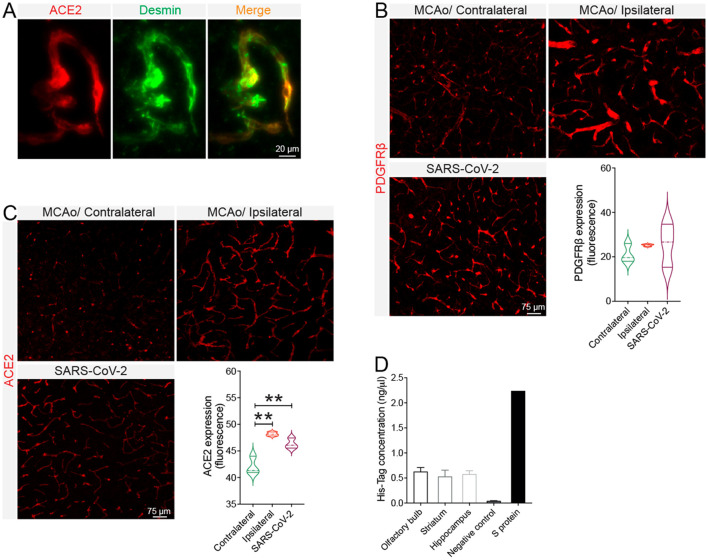
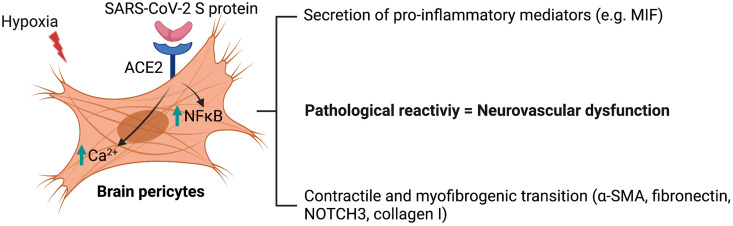
Coronavirus disease 19 (COVID-19) is a respiratory illness caused by severe acute respiratory syndrome coronavirus-2 (SARS-CoV-2). COVID-19 pathogenesis causes vascular-mediated neurological disorders via elusive mechanisms. SARS-CoV-2 infects host cells via the binding of viral Spike (S) protein to transmembrane receptor, angiotensin-converting enzyme 2 (ACE2). Although brain pericytes were recently shown to abundantly express ACE2 at the neurovascular interface, their response to SARS-CoV-2 S protein is still to be elucidated. Using cell-based assays, we found that ACE2 expression in human brain vascular pericytes was increased upon S protein exposure. Pericytes exposed to S protein underwent profound phenotypic changes associated with an elongated and contracted morphology accompanied with an enhanced expression of contractile and myofibrogenic proteins, such as α-smooth muscle actin (α-SMA), fibronectin, collagen I, and neurogenic locus notch homolog protein-3 (NOTCH3). On the functional level, S protein exposure promoted the acquisition of calcium (Ca2+) signature of contractile ensheathing pericytes characterized by highly regular oscillatory Ca2+ fluctuations. Furthermore, S protein induced lipid peroxidation, oxidative and nitrosative stress in pericytes as well as triggered an immune reaction translated by activation of nuclear factor-kappa-B (NF-κB) signaling pathway, which was potentiated by hypoxia, a condition associated with vascular comorbidities that exacerbate COVID-19 pathogenesis. S protein exposure combined to hypoxia enhanced the production of pro-inflammatory cytokines involved in immune cell activation and trafficking, namely macrophage migration inhibitory factor (MIF). Using transgenic mice expressing the human ACE2 that recognizes S protein, we observed that the intranasal infection with SARS-CoV-2 rapidly induced hypoxic/ischemic-like pericyte reactivity in the brain of transgenic mice, accompanied with an increased vascular expression of ACE2. Moreover, we found that SARS-CoV-2 S protein accumulated in the intranasal cavity reached the brain of mice in which the nasal mucosa is deregulated. Collectively, these findings suggest that SARS-CoV-2 S protein impairs the vascular and immune regulatory functions of brain pericytes, which may account for vascular-mediated brain damage. Our study provides a better understanding for the mechanisms underlying cerebrovascular disorders in COVID-19, paving the way to develop new therapeutic interventions.

Keywords: COVID-19; Cerebrovascular disorders; Inflammation; Myofibrogenic transition; Neurovascular interface; Pericytes; SARS-CoV-2 S protein.


Figures

Fig. 1
Fig. 1
S protein increases ACE2 expression in pericytes in a dose- and time-dependent manner. A) Western blot analysis shows that ACE2 expression in human brain vascular pericytes rapidly increases 6 h after exposure to 5 nM of S protein, reaching a peak at 15 nM. B) Western blot analysis shows that ACE2 expression in brain pericytes remains elevated 24 h after exposure to 10 nM of S protein compared to vehicle. C) XTT cell viability assay shows that exposure to 15 nM of S protein for 6 h attenuates the survival of brain pericytes. D) XTT cell viability assay shows that prolonged exposure to S protein for 24 h further attenuates the survival of brain pericytes. Data are mean ± SEM (n = 3 independent experiments/ condition; XTT cell viability assay n = 12 wells/ condition). *P < 0.05/ **P < 0.01 compared with vehicle-treated pericytes (two-tailed unpaired t-test). Vehicle, ddH2O; 6H, 6  hours; 24H, 24  hours; XTT, 2/3-bis-(2-methoxy-4-nitro-5-sulfophenyl)-2H-tetrazolium-5-carboxanilide.
Fig. 2
Fig. 2
Pericytes exhibit contractile phenotype upon S protein exposure. A) Representative images of F-actin staining using Alexa Fluor®546 phalloidin shows that the morphology of human brain vascular pericytes is disrupted (white arrowheads) upon exposure to S protein for 6 h and 24 h. B) Western blot analysis shows that expression of the contractile protein α-SMA increases in brain pericytes after exposure to 10 nM of S protein for 6 h. C) Western blot analysis shows that α-SMA expression in brain pericytes remains increased 24 h after exposure to 10 and 15 nM of S protein. D) Representative images of immunofluorescence staining that illustrate the expression pattern of α-SMA in brain pericytes in a dose-dependent manner upon exposure to S protein for 24 h. Data are mean ± SEM (n = 3 independent experiments/ condition). *P < 0.05 compared with vehicle-treated pericytes (two-tailed unpaired t-test). Vehicle, ddH2O; 6H, 6 hours; 24H, 24  hours.
Fig. 3
Fig. 3
S protein induces the expression of myofibrogenic markers in pericytes. A) Western blot analysis shows that expression of the pro-fibrotic protein fibronectin in human brain vascular pericytes is induced upon S protein exposure at 10 nM for 6 h. B) Western blot analysis shows that fibronectin expression in brain pericytes continues to increase after S protein exposure at 15 nM for 24 h. C) Representative images of immunofluorescence staining that illustrate the expression pattern of fibronectin in brain pericytes in a dose-dependent manner upon exposure to S protein for 24 h. D) Western blot analysis shows that expression of the fibrogenic protein NOTCH3 in brain pericytes remains unchanged after S protein exposure for 6 h, despite slight statistically non-significant increase at 5 and 10 nM. E) Western blot analysis shows that NOTCH3 expression in brain pericytes increases upon exposure to 10 and 15 nM S protein for 24 h. F) Representative images of staining that illustrates NOTCH3 expression pattern in brain pericytes in a dose-dependent manner upon exposure to S protein for 24 h, outlining a possible aggregation at the cell membrane in response to an elevated dose of S protein at 15 nM (white arrowheads). Data are mean ± SEM (n = 3 independent experiments/ condition). *P < 0.05 compared with vehicle-treated pericytes (two-tailed unpaired t-test). Vehicle, ddH2O; 6H, 6  hours; 24H, 24  hours.
Fig. 4
Fig. 4
Pericytes adopt an elongated and contracted shape upon S protein exposure. A) Representative brightfield images of living cells shows that human brain vascular pericytes exhibit an elongated morphology (white arrowheads) upon exposure to S protein for 24 h. B) A scheme illustrating the correlation between cell circularity index and contraction, where a reduced circularity index translates the acquisition of an elongated and contracted cellular morphology. Morphological analysis shows that the C) cell circularity index, D) cell perimeter, and E) cell body size (soma) decreases in brain pericytes exposed to S protein for 24 h in a dose-dependent manner. Data are mean ± SEM (n = randomly selected 10 to 12 vehicle- and S protein-treated cells per image for a total of 3 images per experimental condition). *P < 0.05/ ***P < 0.001/****P < 0.0001 compared with vehicle-treated pericytes (two-tailed unpaired t-test). Vehicle, ddH2O.
Fig. 5
Fig. 5
S protein exposure does not influence the dynamics of VSMCs. A) Western blot analysis shows that B) ACE2 expression as well as C) α-SMA expression in human brain VSMCs remains unchanged 24 h after exposure to S protein. D) Brightfield images of living cells shows that the morphology of human VSMCs remains intact upon exposure to S protein for 24 h. E) Morphological analysis shows that cell circularity index slightly increases upon exposure of VSMCs to 10 nM and 15 nM S protein for 24 h. F) Cell perimeter slightly decreases only upon exposure to 15 nM S protein for 24 h. G) Cell body size slightly decreases only upon exposure to 15 nM S protein for 24 h. H) XTT cell viability assay shows that exposure to S protein for 24 h does not affect the survival of VSMCs. Data are mean ± SEM (n = 3 independent experiments/ condition; Cell morphology analysis, n = randomly selected 10 to 12 vehicle- and S protein-treated cells per image for a total of 3 images per experimental condition; XTT cell viability assay, n = 12 wells/ condition). *P < 0.05/ **P < 0.01/***P < 0.001/****P < 0.0001 compared with vehicle-treated pericytes (two-tailed unpaired t-test). Vehicle, ddH2O; XTT, 2/3-bis-(2-methoxy-4-nitro-5-sulfophenyl)-2H-tetrazolium-5-carboxanilide.
Fig. 6
Fig. 6
S protein exposure modulates intracellular Ca2+dynamics in pericytes. >A) Time-lapse imaging of Ca2+ dynamics in human brain vascular pericytes cultures using laser scanning confocal microscopy revealed that exposure to 10 nM S protein increases Ca2+ activity (white arrowheads). B) Representative traces of Ca2+ oscillatory activity showing that upon S protein exposure, pericytes adopt a distinct signature associated with the phenotype of ensheathing brain pericytes. Ca2+ events are marked by red arrowheads and blackline indicate the basal Ca2+ level. Note, distinct Ca2+ signatures in different types of human brain vascular pericytes, with the ensheathing phenotype associated with highly regular oscillatory Ca2+ events. C) Analysis of Ca2+ oscillatory activity indicates that S protein promoted an ensheathing pericyte phenotype. D) The amplitude of Ca2+ events remains unchanged in brain pericytes after exposure to S protein. E) Sharp increase in the frequency of Ca2+ events in brain pericytes upon exposure to S protein. F) Analysis of synchronized activity of Ca2+ events showing a strong increase in the level of synchronization in brain pericytes upon S protein exposure. Data are mean ± SEM (n = 7 videos from 4 wells for 371 cells in vehicle-treated brain pericytes / n = 6 videos from 4 wells for 382 cells in S protein-treated cells). ***P < 0.001 compared with vehicle-treated pericytes (two-tailed unpaired t-test). (For interpretation of the references to colour in this figure legend, the reader is referred to the web version of this article.)
Fig. 7
Fig. 7
Hypoxic/ischemic conditions modulate ACE2 expression pattern in pericytes. A) Western blot analysis shows that ACE2 expression in human brain vascular pericytes increases 24 h after exposure to hypoxic (hypoxia) or ischemic-like (OGD) conditions. B) Western blot analysis shows that ACE2 expression in brain pericytes continues to increase under prolonged hypoxic conditions to reach a peak at 1 week. C) Western blot analysis shows that ACE2 expression in response to 10 nM S protein exposure for 24 h is exacerbated in brain pericytes pre-exposed to hypoxic conditions. D) Representative images of immunofluorescence staining that illustrate ACE2 expression pattern in response to S protein exposure for 24 h in brain pericytes pre-exposed to hypoxic conditions, outlining a possible redistribution at the cell membrane (white arrowheads). Data are mean ± SEM (n = 3 independent experiments/ condition; XTT cell viability assay n = 9–12 wells/ condition). *P < 0.05/ **P < 0.01 compared with normoxia vehicle-treated pericytes, and #P < 0.05 compared with hypoxia vehicle-treated pericytes (one-way analysis of variance (ANOVA) followed by Bonferroni's multiple comparison post-hoc test). Vehicle, ddH2O; OGD, oxygen and glucose deprivation; 48H, 48  hours; 72H, 72  hours; 1 W, 1 week; XTT, 2/3-bis-(2-methoxy-4-nitro-5-sulfophenyl)-2H-tetrazolium-5-carboxanilide.
Fig. 8
Fig. 8
S protein-mediated phenotypic changes in pericytes are modulated by hypoxia. A) Western blot analysis shows that α-SMA expression increases in brain pericytes pre-exposed to hypoxic conditions and is further induced upon exposure to S protein at 10 nM for 24 h. B) Western blot analysis shows that fibronectin expression increases in brain pericytes 24 h after exposure to S protein, independently of the hypoxic conditions. C) Western blot analysis shows that NOTCH3 expression increases upon exposure to S protein for 24 h and hypoxia, which does not influence S protein-mediated effects. D) Analysis of immunofluorescence intensity shows that expression of the pro-fibrotic protein collagen I increases following S protein exposure for 24 h in brain pericytes pre-exposed to hypoxic conditions. E) Representative images of immunofluorescence staining that illustrates the expression pattern of collagen I in brain pericytes pre-exposed to hypoxic conditions and exposed for 24 h to S protein. Data are mean ± SEM (n = 3 independent experiments/ condition). *P < 0.05/ **P < 0.01/ ***P < 0.001/ ****P < 0.0001 compared with normoxia vehicle-treated pericytes, and #P < 0.05/ ###P < 0.001 compared with hypoxia vehicle-treated pericytes (one-way analysis of variance (ANOVA) followed by Bonferroni's multiple comparison post-hoc test). Vehicle, ddH2O.
Fig. 9
Fig. 9
S protein exposure causes oxidative and nitrosative stress in pericytes. A) XTT cell viability assay shows that pre-exposure to hypoxic conditions does not affect the survival of human brain vascular pericytes following exposure to 10 nM S protein for 24 h. B) TBARS assay shows that exposure of brain pericytes to S protein for 24 h increases lipid peroxidation independently upon the hypoxic conditions. C) Representative fluorescence images of ROS/RNS assay, which probes real time reactive oxygen and nitrogen species production by brain pericytes. D) Analysis of the fluorescence intensity shows that S protein exposure for 24 h induces total ROS generation in brain pericytes, a response that is exacerbated under hypoxic conditions. E) Analysis of the fluorescence intensity shows that hypoxia increases superoxide production in brain pericytes independently upon S protein. F) Analysis of the fluorescence intensity shows that S protein exposure for 24 h associated to hypoxia increases NO generation in brain pericytes. Data are mean ± SEM (n = 3 independent experiments/ condition; ROS/RNS assay, n = randomely selected 14 to 15 cells per well of 12-well plates). *P < 0.05/ **P < 0.01/ ****P < 0.0001 compared with normoxia vehicle-treated pericytes, and #P < 0.05 compared with hypoxia vehicle-treated pericytes (one-way analysis of variance (ANOVA) followed by Bonferroni's multiple comparison post-hoc test). Vehicle, ddH2O; XTT, 2/3-bis-(2-methoxy-4-nitro-5-sulfophenyl)-2H-tetrazolium-5-carboxanilide; ROS/RNS, reactive oxygen/nitrogen species.
Fig. 10
Fig. 10
S protein exposure induces a strong immune reaction in pericytes. A) Western blot analysis shows that the ratio of phosphorylated p65-NF-κB over total NF-κB (i.e pathway activation) increases in human brain vascular pericytes upon exposure to 15 nM S protein for 6 h. B) Western blot analysis shows that the ratio of phosphorylated p65-NF-κB over total NF-κB remains elevated upon exposure of brain pericytes to S protein for 24 h, without statistical significance. C) Western blot analysis shows that the ratio of phosphorylated p65-NF-κB over total NF-κB increases upon stimulation of brain pericytes pre-exposed to hypoxic conditions with S protein for 24 h. D) Representative images of the Proteome Profiler Human Cytokine Array membranes showing that brain pericytes ubiquitously express various immune mediators, including stromal cell-derived factor (SDF)-1, intercellular adhesion molecule (ICAM), interleukin (IL)18, MIF, and plasminogen activator inhibitor (PAI)-1. E) Analysis of the cytokine and chemokine array shows that MIF expression is increased in response to S protein exposure for 24 h in brain pericytes pre-exposed to hypoxic conditions. Data are mean ± SEM (n = 3 independent experiments/ condition; Proteome Profiler Human Cytokine Array, n = 3 pooled independent experiments/ condition). (A-B) *P < 0.05 compared with vehicle or S-protein-treated pericytes (two-tailed unpaired t-test); (C) **P < 0.01/ ****P < 0.0001 compared with normoxia vehicle-treated pericytes, and ##P < 0.01 compared with hypoxia vehicle-treated pericytes (one-way analysis of variance (ANOVA) followed by Bonferroni's multiple comparison post-hoc test); (D) *P < 0.05 compared with vehicle-treated pericytes (two-tailed unpaired t-test). Vehicle, ddH2O.
Fig. 11
Fig. 11
SARS-CoV-2 intranasal infection induces pericyte reactivity in the brain. A) Representative images of immunofluorescence staining show that ACE2 (red) is co-localized with vascular pericytes labelled with desmin (green) in the brain of wildtype mice. B) Analysis of immunofluorescence intensity indicates that PDGFRβ expression is induced in the brain of K18-hACE2 transgenic mice 4 days following intranasal infection with SARS-CoV-2, as well as in the ischemic ipsilateral hemisphere of C57BL6/J wildtype mice 3 days after cerebral ischemia induction via middle cerebral artery occlusion (MCAo). C) Analysis of immunofluorescence intensity indicates that ACE2 expression increases in the brain vasculature of K18-hACE2 transgenic mice 4 days following intranasal infection with SARS-CoV-2 as well as in the ischemic ipsilateral hemisphere of C57BL6/J wildtype mice 3 days after ischemic stroke. D) His-Tag ELISA analysis shows that the poly-histidine-tagged S protein is present in different brain regions 24 h after intranasal infusion. Data are mean ± SEM (n = 3 animals/ condition). **P < 0.01 compared with contralateral hemisphere (one-way analysis of variance (ANOVA) followed by Bonferroni's multiple comparison post-hoc test). (For interpretation of the references to colour in this figure legend, the reader is referred to the web version of this article.)
Fig. 12
Fig. 12
Scheme illustrating the effects of S protein on brain pericytes in absence of productive viral infection. Exposure of ACE2+ human brain vascular pericytes to SARS-CoV-2 S protein active trimer induces NF-κB signaling pathway and modulates intracellular Ca2+ activity. The intracellular signaling changes in brain pericytes upon S protein exposure are accompanied by an increased expression of contractile and myofibrogenic markers as well as secretion of inflammatory cytokines and chemokines. S protein effects are potentiated under hypoxic conditions, which are associated to vascular comorbidities that have been demonstrated to exacerbate COVID-19 pathogenesis. We postulate that SARS-CoV-2 could impair neurovascular functions by deregulating the functions of ACE2+ pericytes via S protein active trimer.

Similar articles

Cited by

References

    1. Alisson-Silva F., Freire-de-Lima L., Donadio J.L., Lucena M.C., Penha L., Sá-Diniz J.N., et al. Increase of O-glycosylated oncofetal fibronectin in high glucose-induced epithelial-mesenchymal transition of cultured human epithelial cells. PLoS One. 2013;8 doi: 10.1371/journal.pone.0060471. - DOI - PMC - PubMed
    1. Armulik A., Genové G., Betsholtz C. Pericytes: developmental, physiological, and pathological perspectives, problems, and promises. Dev. Cell. 2011;21:193–215. doi: 10.1016/j.devcel.2011.07.001. - DOI - PubMed
    1. Bocci M., Oudenaarden C., Sàenz-Sardà X., Simrén J., Edén A., Sjölund J., et al. Infection of brain pericytes underlying neuropathology of COVID-19 patients. bioRxiv. 2021 doi: 10.1101/2021.05.24.445532. - DOI - PMC - PubMed
    1. Burdyga T., Borysova L. Calcium signalling in pericytes. J. Vasc. Res. 2014;51:190–199. doi: 10.1159/000362687. - DOI - PubMed
    1. Di Carlo S.E., Peduto L. The perivascular origin of pathological fibroblasts. J. Clin. Invest. 2018;128:54–63. doi: 10.1172/JCI93558. - DOI - PMC - PubMed

Publication types

MeSH terms