Review
. 2022 Jan:208:102186.
doi: 10.1016/j.pneurobio.2021.102186. Epub 2021 Nov 12.

The functional characterization of callosal connections

Affiliations
Review

The functional characterization of callosal connections

Giorgio M Innocenti et al. Prog Neurobiol. 2022 Jan.

Abstract

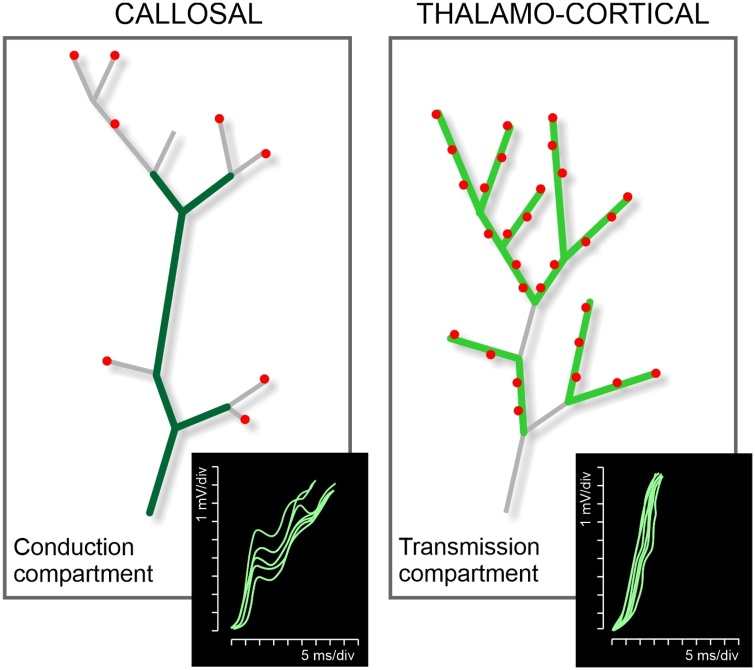
The brain operates through the synaptic interaction of distant neurons within flexible, often heterogeneous, distributed systems. Histological studies have detailed the connections between distant neurons, but their functional characterization deserves further exploration. Studies performed on the corpus callosum in animals and humans are unique in that they capitalize on results obtained from several neuroscience disciplines. Such data inspire a new interpretation of the function of callosal connections and delineate a novel road map, thus paving the way toward a general theory of cortico-cortical connectivity. Here we suggest that callosal axons can drive their post-synaptic targets preferentially when coupled to other inputs endowing the cortical network with a high degree of conditionality. This might depend on several factors, such as their pattern of convergence-divergence, the excitatory and inhibitory operation mode, the range of conduction velocities, the variety of homotopic and heterotopic projections and, finally, the state-dependency of their firing. We propose that, in addition to direct stimulation of post-synaptic targets, callosal axons often play a conditional driving or modulatory role, which depends on task contingencies, as documented by several recent studies.

Keywords: Callosal axon diameter; Callosal conduction velocity; Callosal connections flexibility; Callosal disconnection syndromes; Callosal interhemispheric transfer; Corpus callosum.


Conflict of interest statement

The authors declare no competing financial interests

Figures

Fig. 1
Fig. 1
Schematic summary of two sets of axons anterogradely filled with biocytin and reconstructed from serial sections. Maximal order of branching, branching angles, topological distribution of branches and boutons were similar for the two types of axons. However, thalamo-cortical axons had longer terminal branches carrying numerous synaptic boutons (the ‘transmission compartment’) while, in callosal axons, the proximal, bouton-free sector of the axon predominated (the ‘conduction compartment’). Redrawn with modification from Tettoni et al., 1992. Insets show the steeper raising of EPSPs elicited by peripheral cutaneous stimuli than those elicited by callosal input from the contralateral S1 stimulation in the cat. The transcallosal input was also weaker and less secure than the peripheral input. Redrawn with modifications from Innocenti et al., 1972.
Fig. 2
Fig. 2
A. Topographic organization of the CC of the macaque monkey after injections of anterograde BDA in different cortical areas, obtained by superposition of the outlines of the clusters of axon labeling from six different animals. Color gradients indicate axon labeling from prefrontal (9, 46), premotor (dorsal, PMd F2/F7; ventral, PMv, F4), motor (M1), somatosensory (S1, area 2), posterior parietal (area 5, PEc, PEip), temporal, extrastriate (V4), primary visual (V1/V2) cortex. The histograms indicate the distribution of axon diameters (n. of counts, mean ± SD) in selected prefrontal, motor, parietal, and visual sectors of the CC. Redrawn from Caminiti et al., 2009 and . B. Distribution of axon diameters sampled from discrete dorsoventrally oriented probes in different anteroposterior sectors of the CC, in humans, where fibers from prefrontal, motor, posterior parietal, and visual cortex cross the midline. Convention and symbols as in A. C. Mean conduction delays (left panel) and range of conduction delays (right panel) to the CC midline in monkeys, chimpanzees, and humans plotted against normalized antero-posterior CC dimension and fitted with a polynomial function. Adapted from Caminiti et al., 2009.
Fig. 3
Fig. 3
A-D, Topology of fibers in the Corpus Callosum (CC) reconstructed by DW-MRI. A. Subdivision of the mid-sagittal section of the CC in 11 sectors (corresponding to ROIs). B,C. Streamlines colored according to ROIs projected on medial and lateral views of the hemisphere. D. Projection of the streamlines onto the pial surface. E,F. Axon diameter indexes of streamlines passing through the CC (E), colored according to their axon diameter index, and (F) projected onto the cortical surface. Colors correspond to the axon diameter index averaged across streamlines. Notice larger diameter indexes in the precentral and postcentral gyri, corresponding to motor (a 4) and somatosensory areas (3-1-2), the smaller indexes elsewhere as expected from histological work (Aboitiz et al., 1992) although skewed to larger estimates. Abbreviations: ces, central sulcus; ifs, inferior frontal sulcus; ips, intraparietal sulcus; prs, precentral sulcus; sfs, superior frontal sulcus. Numbers correspond to Brodmann areas. Adapted from Barakovic, 2021.
Fig. 4
Fig. 4
Spatial and temporal divergence/convergence of callosal axons from cat area 17/18 border terminating onto the homotopic site, color coded according to the simulated delay (ms) from the CC midline. Notice that most axons terminate in separate territories (ovals), probably corresponding to orientation columns, and at different delays. The termination of two axons overlap spatially (inside blue-red contour) while being still temporally segregated. Adapted from Innocenti et al., 1994.
Fig. 5
Fig. 5
Cortical activation evoked by tactile stimulation of the left medial trunk surface in a control subject with intact CC (A) and in a patient with complete callosal resection (B). A1 and B1, images through the midsagittal plane showing the integrity of the CC in the control subject and the total callosal resection in the patient. Unilateral tactile stimulation of the left ventral trunk midline evoked cortical activation foci in contralateral (A2,3 and B2,3, foci 1) and ipsilateral SI and SII (A2,3 and B2,3, foci 2), both in control subject (A2 and 3) and complete callosotomized patient (B2 and 3). Left hemisphere on the right. CS, central sulcus, SS, sylvian sulcus. Sagittal images are obtained from spin echo T1-weighted sequence (440 ⁄ 14 ⁄ 2 TR⁄ TE ⁄ excitations; matrix 256 × 224; scan time 3 min 20 s). Axial images (A2,3 and B2,3) are obtained from a T1 FLAIR sequence on which the regions activated during stimulation [obtained from a GE T2* single-shot echo planar image sequence; (3000 ⁄ 60 ⁄ 1) have been overlain]. Adapted from Fabri et al., 2006.
Fig. 6
Fig. 6
Anticipation of horizontal movement across the VM of the visual field in cats revealed by removal of callosal input (CC). Examples of receptive fields (A) and spiking activity (B) in area 17 (ch18, ch28) and area 18 (ch13) during reversible thermal deactivation of the left 17/18 transition zone. A: Receptive fields in the right hemifield and preferring movement ‘away from (ch13) or ‘towards’ (ch18) the deactivated left hemifield during baseline (left) and CC deactivation (light blue box). Normalized polar plots (right) indicate the preferred direction of movement. Note that the neuron (Ch13) preferring the ‘away from’ the deactivated hemifield movement is particularly affected although its RF is confined to the right hemifield. B: Peri-stimulus time histogram of a neuron preferring both horizontal movements (ch28) during visual stimulation with a RF tailored Gabor grating moving ‘away from’ (upper) or ‘towards’ (lower) the deactivated hemifield. Although stimulation does neither cross the VM nor enter the stripe of overlapping representation in the two hemispheres, baseline spiking activity (red) is decreased by deactivating CC (light blue) for the ‘away from’ but not the ‘towards’ movement suggesting a lack of ongoing and direction specific excitatory input. Adapted from original data published in Conde-Ocazionez et al., 2018a,(A) and Peiker et al., 2013(B).
Fig. 7
Fig. 7
Reversible thermal deactivation of CC removes the natural cardinal bias in ongoing maps recorded with voltage-sensitive dye imaging (VSDI) in cat area 18. Upper: Sequences of camera frames (6.25 ms each) during ongoing activity in 10 trials color-coded by preference angle (color bar below). Frame-wise preference angle obtained by vectorial sum of single correlation coefficients with eight reference orientation preference maps evoked by gratings. During CC deactivation (blue box), phases of yellow-green and blue (cardinal orientations) decrease at the expense of green and red (oblique orientations). Lower, left: Frequency of VSDI frames of ongoing activity significantly correlated with grating evoked maps of a certain preference angle (red line, baseline; blue line, deactivation; black dotted line, recovery), as quantified from the example data set above. Lower, right: Median modulation index (MI) for the probability of the sum vector to fall in one of three angle compartments for evoked (orange dots) and ongoing activity (blue dots) in 12 data sets. The MI is a measure of change in frequency (F) between baseline and CC deactivation states. MIF = (Fbaseline-Fdeactivation)/(Fbaseline+Fdeactivation), ranging from -1 to 1. Accordingly, negative MI indicates decreased excitation, positive MI indicates release from inhibition in the absence of CC. Dispersions are median absolute deviations. Reprinted from Altavini et al., 2017 with permission.
Fig. 8
Fig. 8
Correspondence between the transcallosal and the geniculo-cortical orientation angle maps “overlapping” in the primary visual cortex (Area17 and Area 18 and transition zone, TZ) of individual adult cats in the same hemisphere. A, B. Optical imaging of intrinsic signals was used to visualize and quantify preferred orientations within these maps in split-chiasm preparations. The callosal and the geniculo-cortical pathways could be activated separately in the same cortical region by visually stimulating each eye in succession. Both maps were compared for their spatial organization; orientation angle maps were also compared quantitatively. Transcallosal (A1-2) and geniculo-cortical (B1 and B2) angle maps from the same hemisphere (1, cat Ca10, left hemisphere; 2, cat Ca01, right hemisphere). White arrowheads were placed on pinwheel centers of the transcallosal angle map and were copied onto the geniculo-cortical map. Thick dashed lines show the location of the 17/18 transition zone (TZ). C1-2. blood vessel patterns of the imaged regions in A1,2 and B1,2. Scale bar = 1 mm. D. Mean orientation similarity index (OSI) calculated in 10 hemispheres (from 7 cats), for the 1-mm-wide TZ between Area 17 and Area 18 as well as for the regions of Area 17 and Area 18 visible on the maps (excluding the TZ). Gray bars represent the mean of the orientation similarity indexes calculated with the transcallosal and geniculo-cortical maps of the same hemisphere of the same animal. The white bars represent the controls where the transcallosal map from one animal was compared with the geniculo-cortical map from another animal. Both groups (same hemisphere vs. control) appeared significantly different for each region (Mann–Whitney test; **p < 0.0001; *p < 0.01). The strongest difference appeared in the TZ, with a better score when both maps are of both the same hemisphere and the same animal. The difference between the TZ and Area 17 was also significant, as well as the one between the TZ and Area 18 (Mann–Whitney test; p < 0.0001). The difference between Area 17 and Area 18 was not significant. Error bars indicate the standard deviation. E, F. OSI maps. The OSI was calculated for each pixel from the angle maps of cats Ca16 and Ca12, respectively. The TZ appears clearly whiter than the other regions indicating that the similarity between transcallosal and geniculo-cortical angle maps decreased progressively with increasing distance from the TZ toward Area 17 and Area 18. Scale bar = 2 mm. Reproduced from Rochefort et al., 2007, with permission.
Fig. 9
Fig. 9
Interhemispherically coherent neuronal assembly is formed in the human visual areas in response to collinear stimulus. A: Bilateral stimuli presented to subjects during EEG and fMRI recording sessions. B: Individual topographic maps of ICoh for peak response frequency in the EEG beta band under background condition (left) and stimulation with collinear (right) and orthogonal (middle) gratings. The color bar on the right shows the values of potential coherence. C: Correlation map (blue) between ICoh and BOLD responses to collinear gratings vs. background is co-localized with the BOLD contrast (red) as shown in transverse brain slices. The white arrows point to the EEG electrodes that showed increased ICoh. Color bars show T values for BOLD (hot scale) and for correlation (cold scale). Adapted from Knyazeva et al., 2006.
Fig. 10
Fig. 10
Consequences of visual deprivation on the development of callosal connections. A: Histograms showing the mean number of HRP retrogradely-labeled callosal cells in areas 17 and 18 of individual cats grouped along the horizontal axis according to the rearing paradigm. The vertical bars indicate the number of labeled neurons per section; gray columns refer to supragranular- and back columns to infragranular neurons. Vertical lines represent 1SD per cat. Horizontal red lines indicate the mean number of labeled neurons and the grey areas the region of average 1SD across cats with the same rearing. Redrawn with modifications from Innocenti et al., 1985. B. Terminal arbors of callosal axons originating in areas 17 and 18 in normal cats (left) and in cats binocularly deprived of vision (right) until postnatal days P60 and P81. Redrawn with modifications from from Zufferey et al., 1999.
Fig. 11
Fig. 11
A: Callosal sub-region areas in congenitally blind (CB) and normal sighted control (NC) human subjects. CB had a significant decrease in surface area of the splenium but a significant increase in the caudal part of the body and the isthmus. Reproduced with permission from Tomaiuolo et al., 2014. B: Percent reduction and excesses in cross-sectional area (left panels), and their significance (right panels), for the corpus callosum in the Early Blind (top), and Late Blind (bottom) groups. Human subjects with early-onset blindness show mean deficits (in cross-sectional area) of up to 20 percent, relative to controls, in the isthmus and splenium (A). Regional differences in the late-onset blind subjects, however, are not significant (B lower right panel) after multiple comparison correction: the global p-value, corrected, for the EB group difference is p = 0.027, while that for the LB is p = 0.215 (not significant): Reproduced with permission from Leporé et al., 2010. C: Tractography reconstructions for the posterior portion of the anterior commissure (pAC) and the splenium of the corpus callosum for a normal sighted control subject, an early blind, and a late blind subject. Note the significant increase in the number of streamlines in pAC for the early blind compared to control and late blind subject. Also note the significant reduction in the number of streamlines in the splenium of CC for EB and LB compared to SC. In both B and C rostral is to the right, caudal to the left. Reproduced with permission from Cavaliere et al., 2020. Centro Interdisciplinario de Neurociencias and Departamento de Psiquiatría, Escuela de Medicina, Pontificia Universidad Católica de Chile, Santiago, Chile

References

    1. Abeles M. Role of the cortical neuron: integrator or coincidence detector? Isr. J. Med. Sci. 1982;18:83–92. - PubMed
    1. Aboitiz F., Montiel J. One hundred million years of interhemispheric communication: the history of the corpus callosum. Braz. J. Med. Biol. Res. 2003;36:409–420. doi: 10.1590/S0100-879X2003000400002. - DOI - PubMed
    1. Aboitiz F., Scheibel A.B., Fisher R.S., Zaidel E. Fiber composition of the human corpus callosum. Brain Res. 1992;598:143–153. - PubMed
    1. Aglioti S.M., Tassinari G., Fabri M., Del Pesce M., Quattrini A., Manzoni T., Berlucchi G. Taste laterality in the split brain. Eur. J. Neurosci. 2001;13:195–200. doi: 10.1046/j.0953-816x.2000.01378.x. - DOI - PubMed
    1. Akelaitis A. Studies on the corpus callosum. II. The higher visual functions in each homonymous field following complete section of the corpus callosum. Arch. Neurol. Psychiatry. 1941;45:788–796. doi: 10.1001/archneurpsyc.1941.02280170066005. - DOI

Publication types