

Plasmacytoid dendritic cells promote the pathogenesis of Sjögren's syndrome
- PMID: 34780913
- PMCID: PMC8714705
- DOI: 10.1016/j.bbadis.2021.166302
Plasmacytoid dendritic cells promote the pathogenesis of Sjögren's syndrome
Abstract
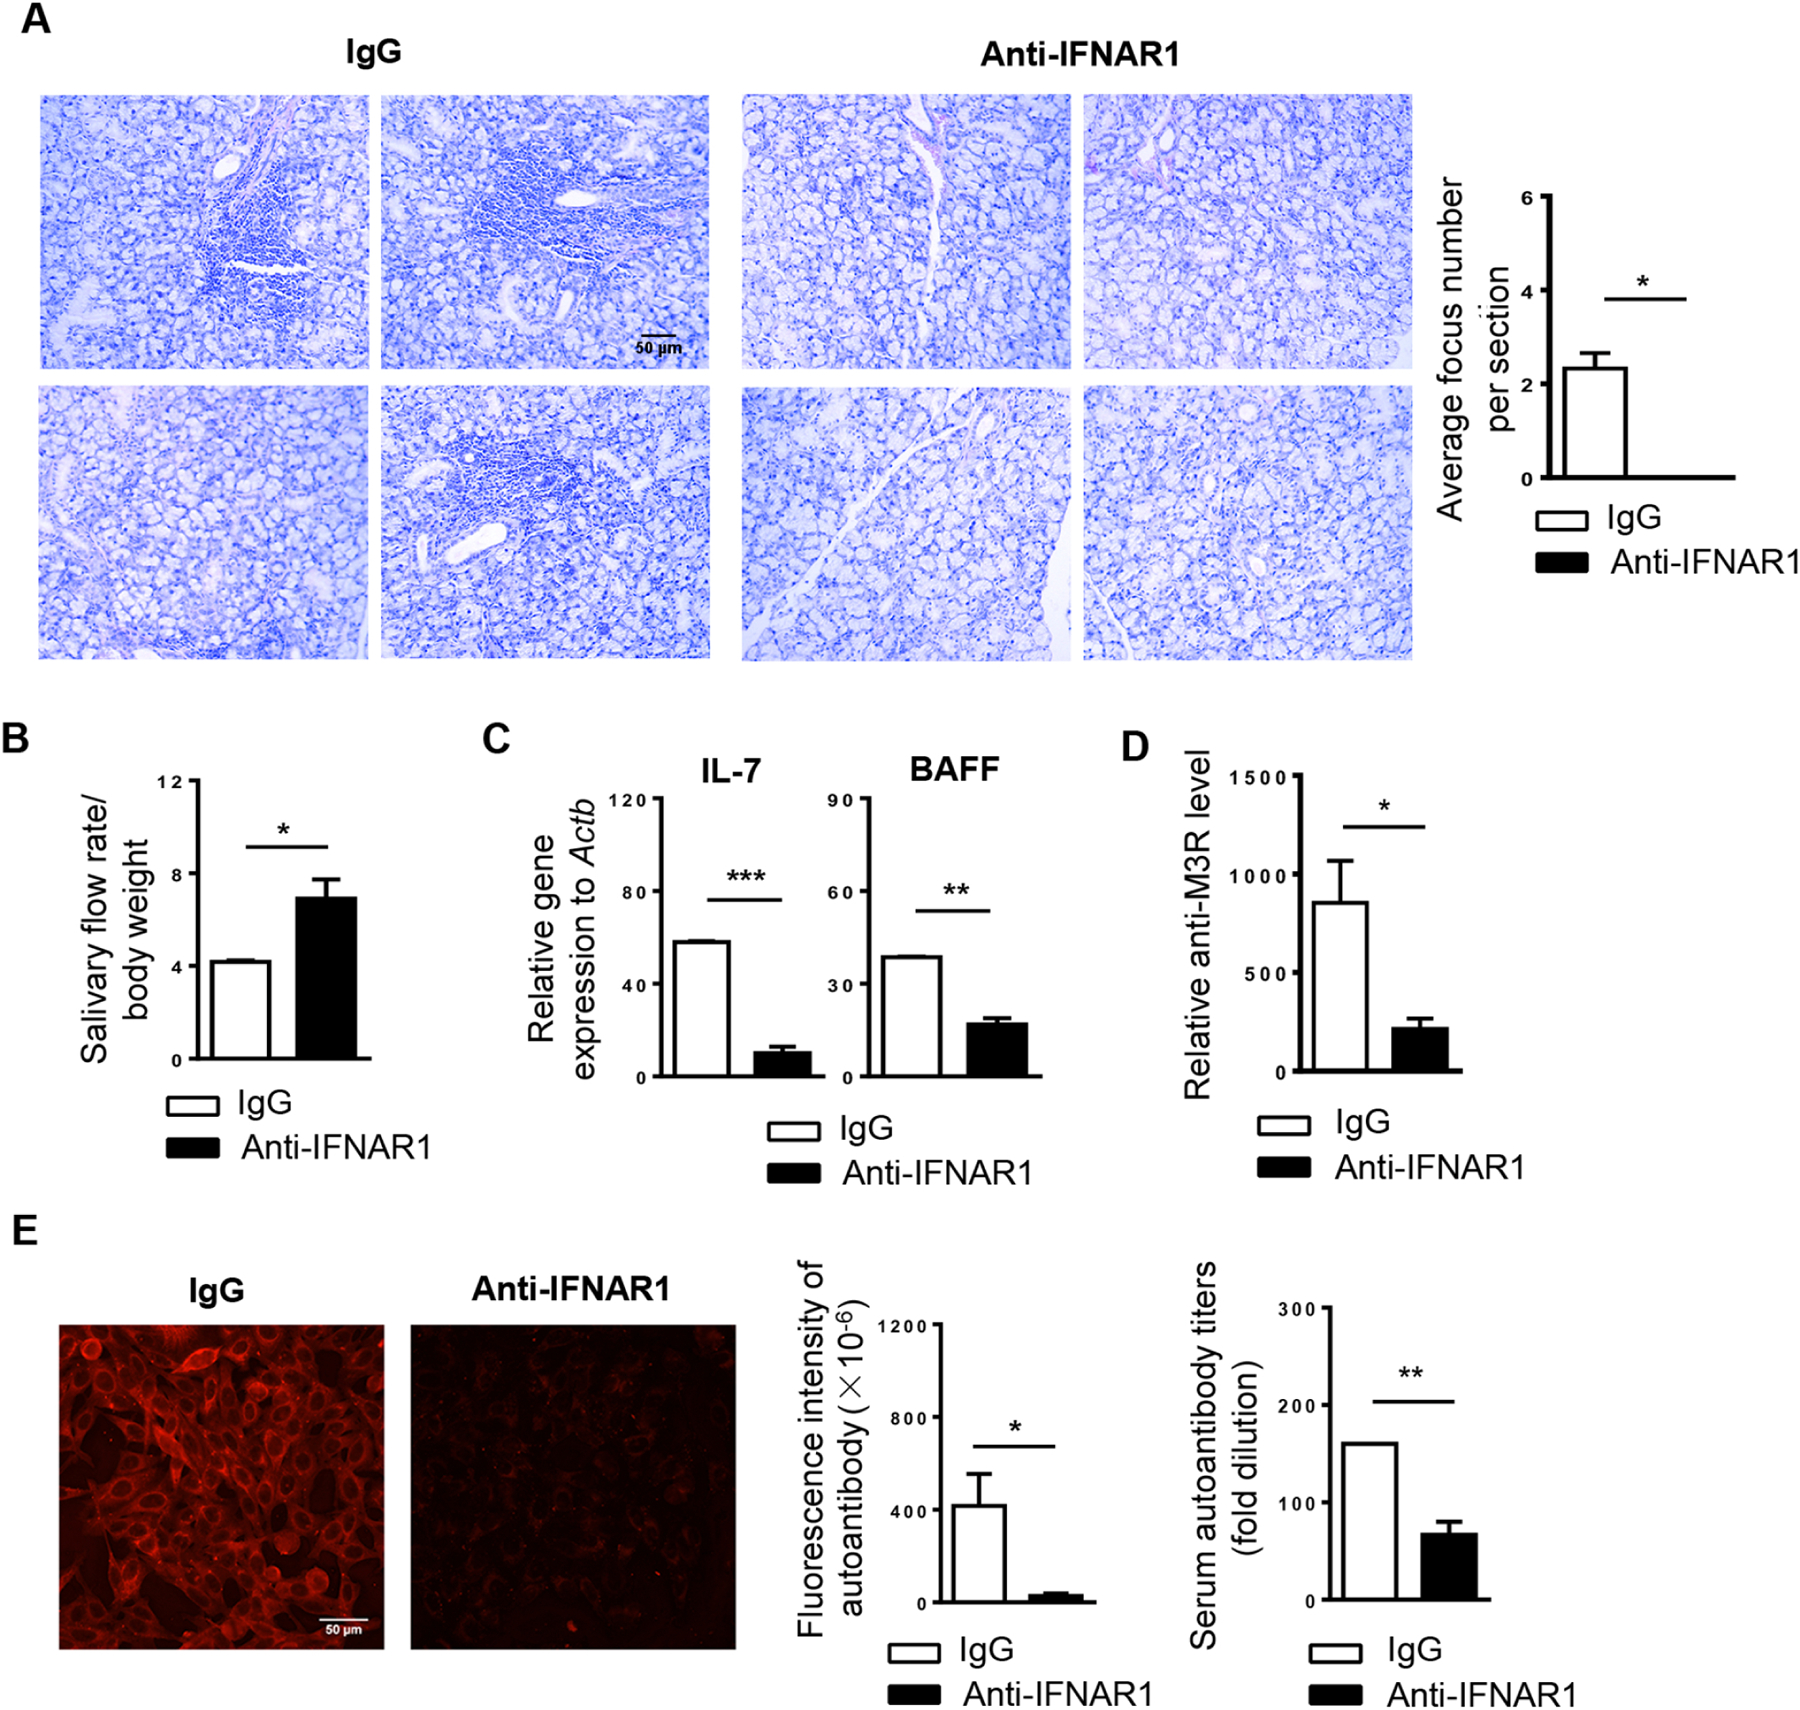
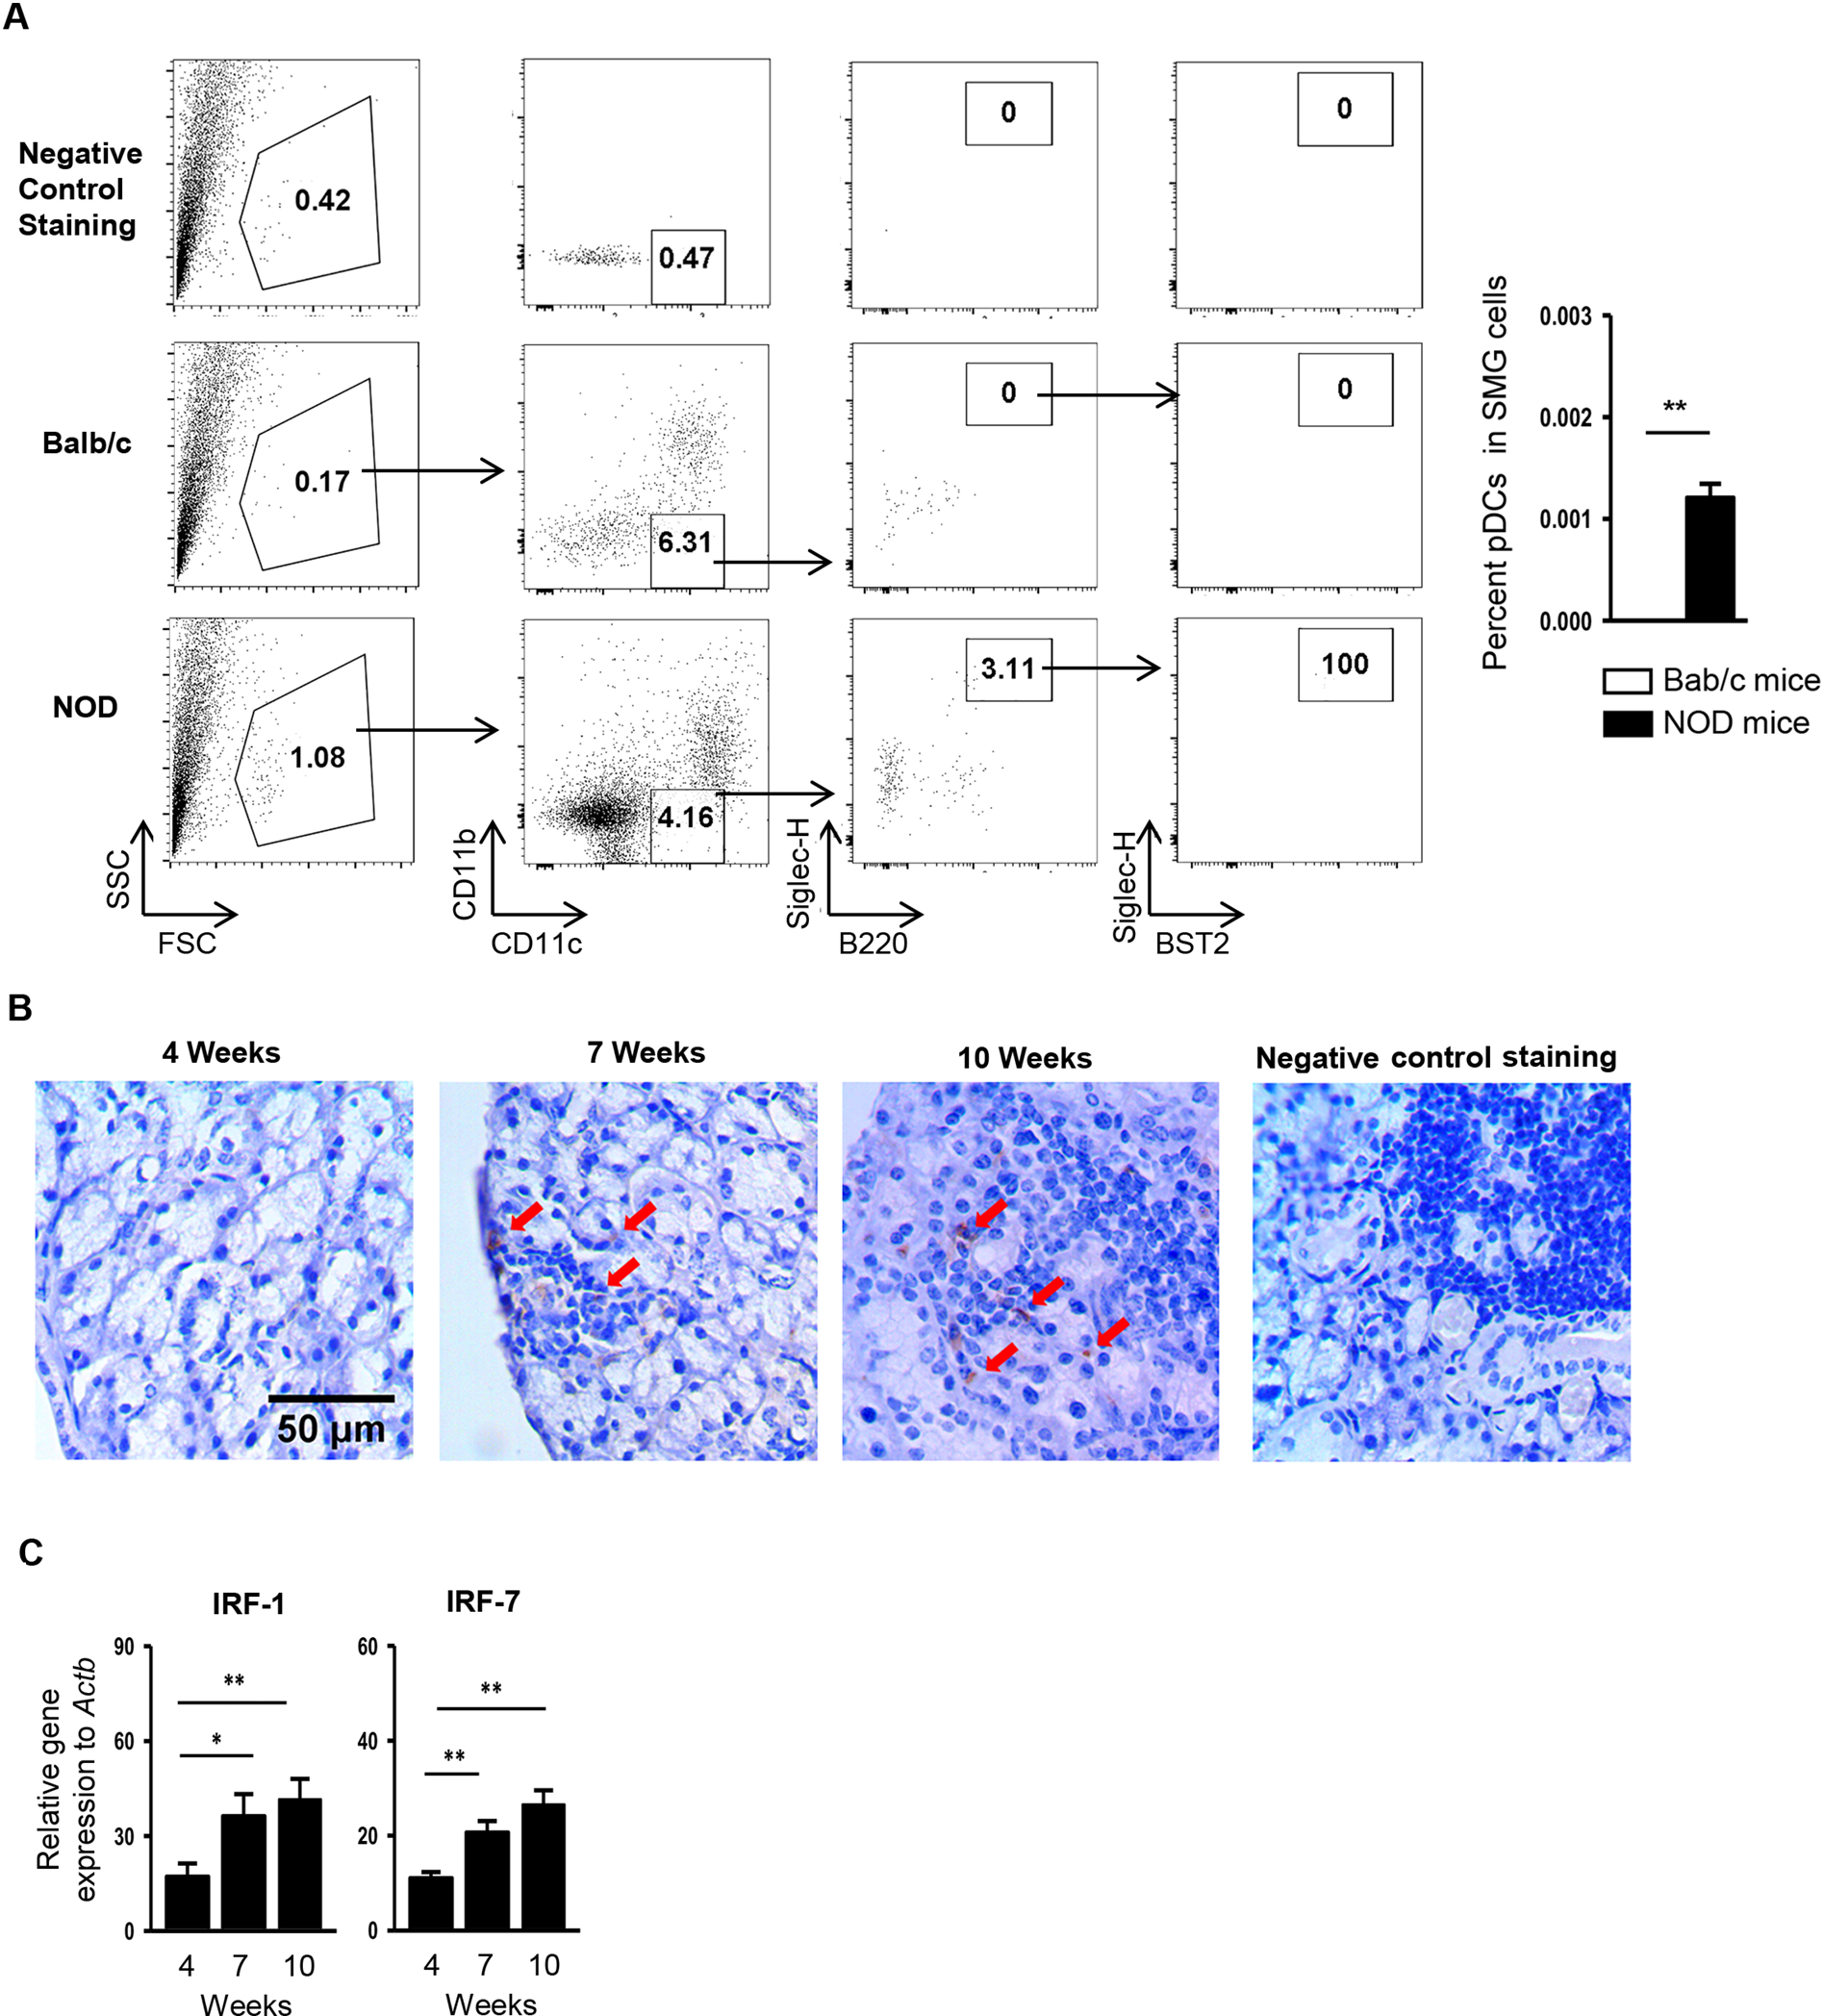
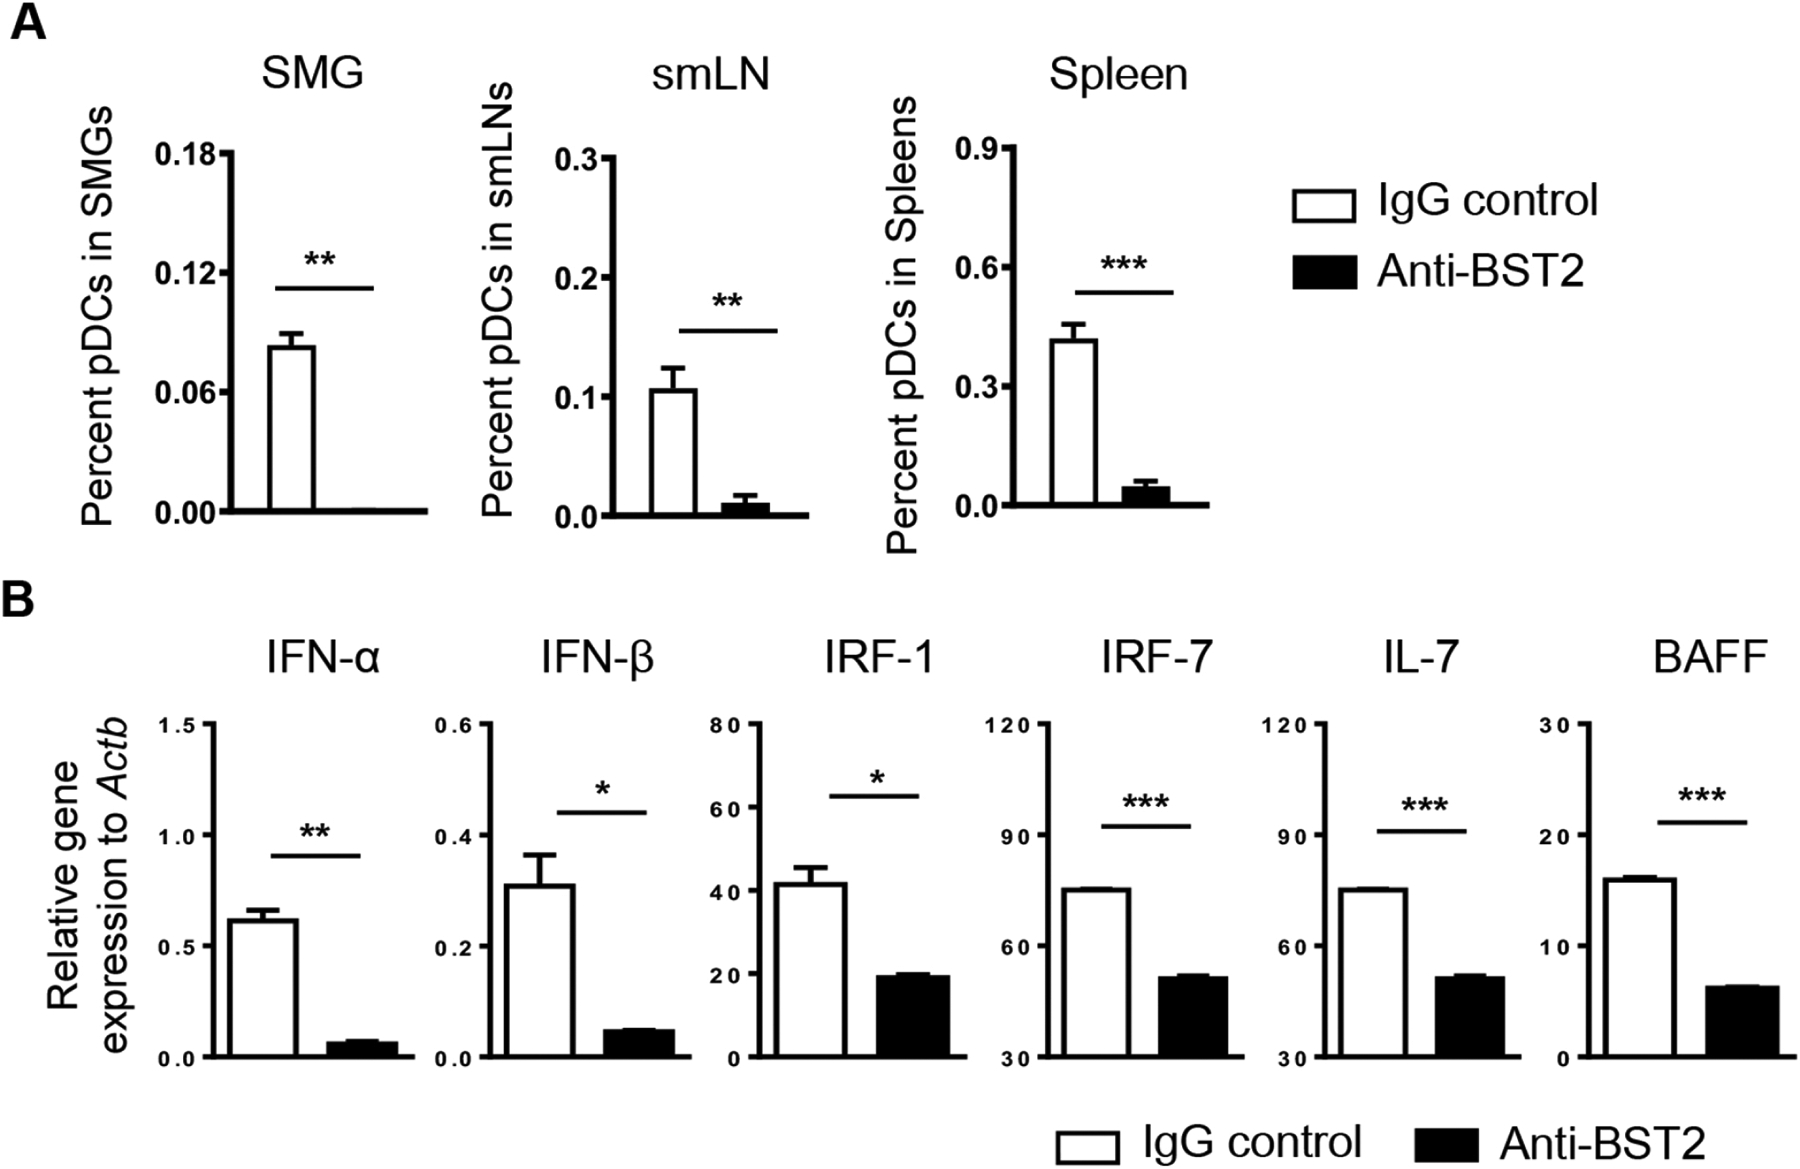
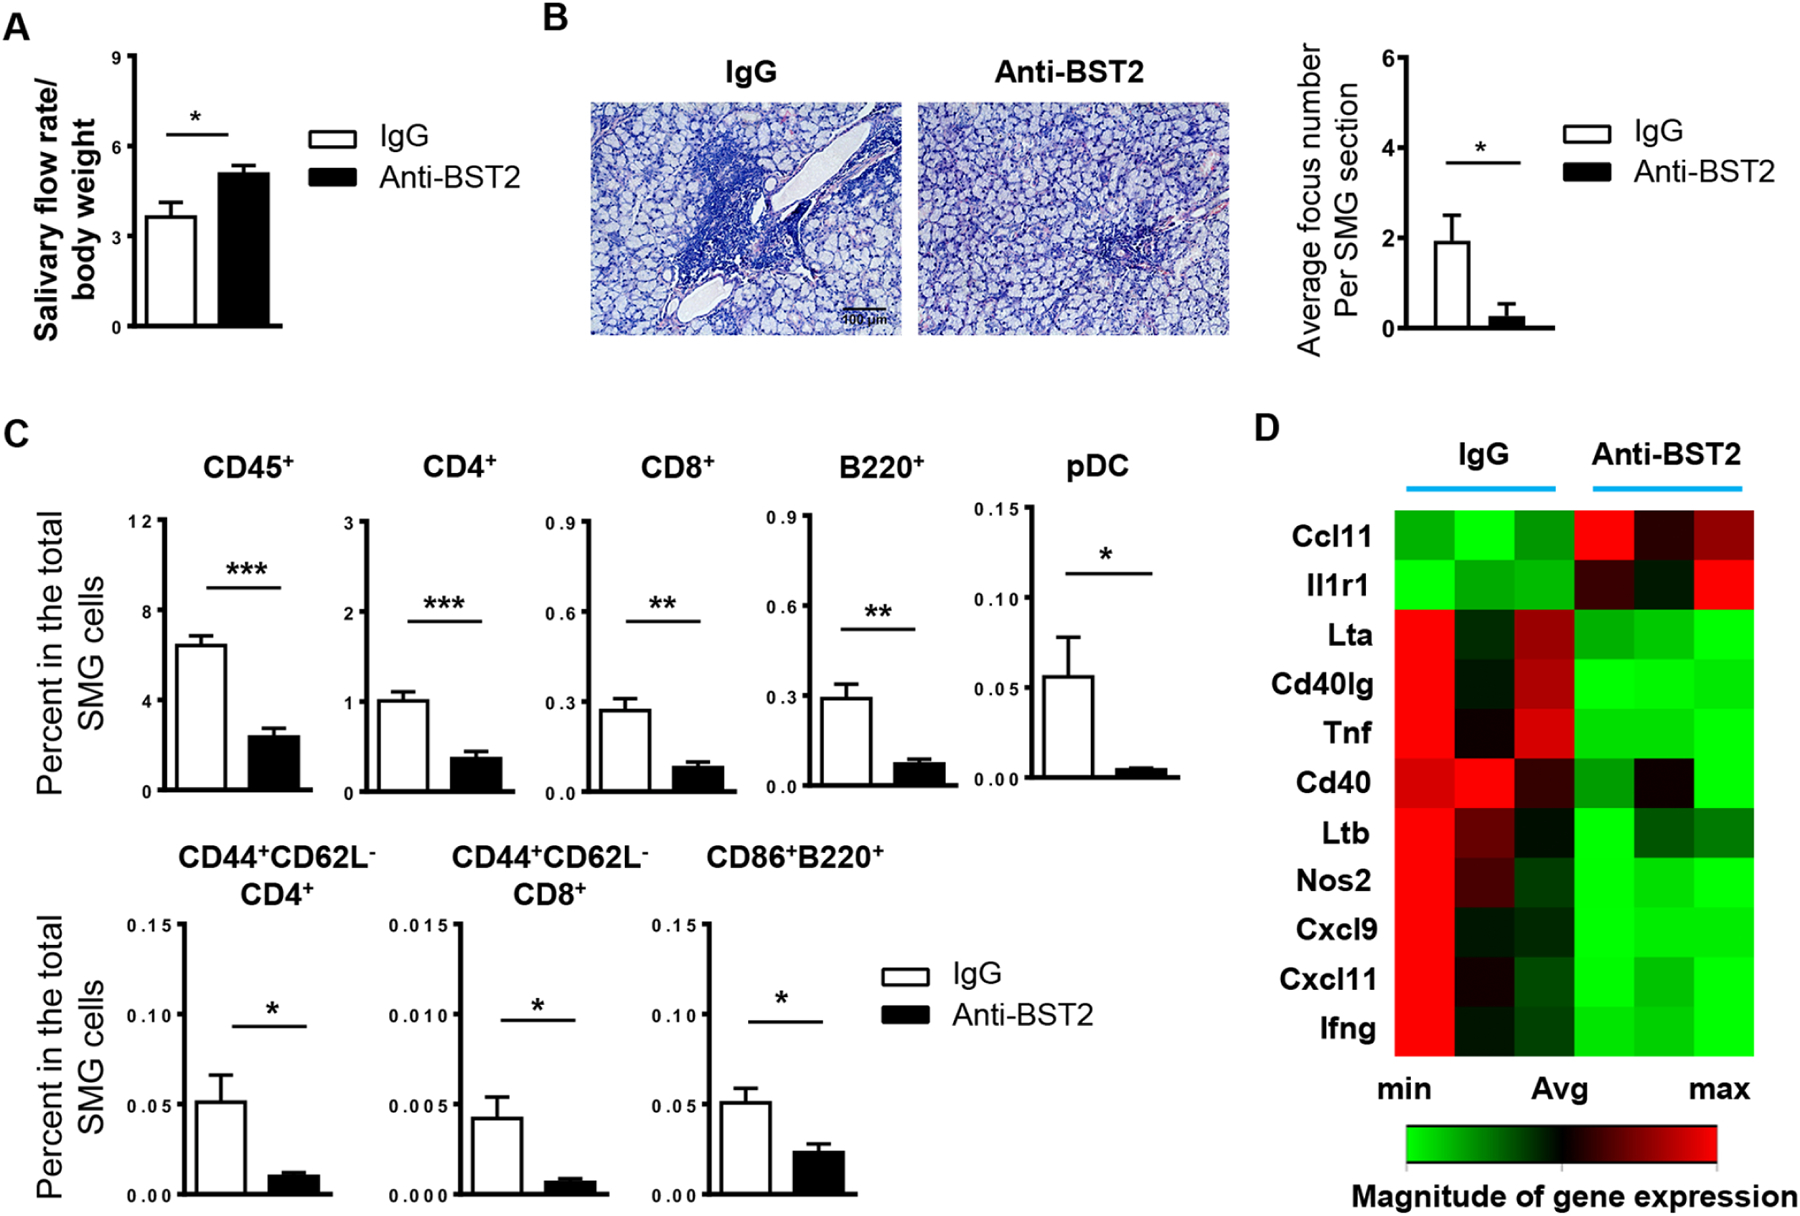
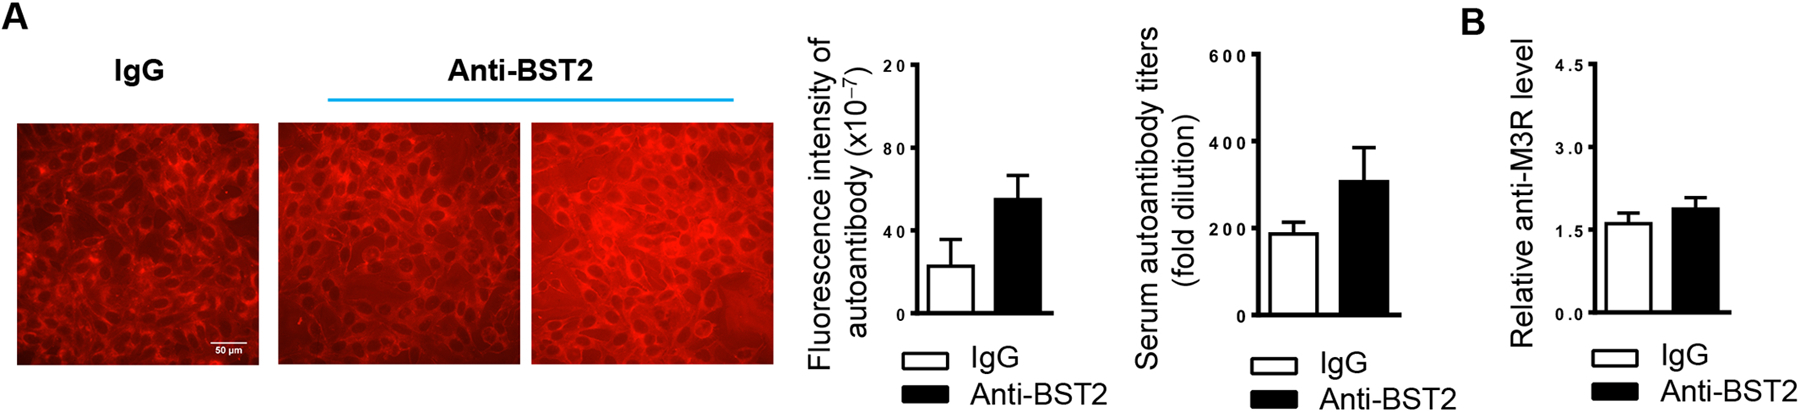
Plasmacytoid dendritic cells (pDCs) produce type I interferons (IFNs) and promote pathogenesis of multiple autoimmune diseases. Autoimmune Sjögren's syndrome (SS) primarily affects salivary and lacrimal glands, causing their inflammation, destruction and dysfunction. pDCs and type I IFN activity are elevated in salivary glands of SS patients, and this study seeks to elucidate the in vivo actions of pDCs in SS pathogenesis using the non-obese diabetic (NOD) mouse model. We confirmed the type I IFN-dependency of SS development in female NOD mice and elevation of pDC-type I IFN in their submandibular glands (SMGs). We administered a pDC-depleting anti-BST2/CD317 antibody to female NOD mice from 4 to 7 weeks of age at the early stage of SS, and assessed SS pathologies at age 10 weeks, the time of disease onset. Depletion of pDCs impeded the development of SMG inflammation and secretory dysfunction. It drastically reduced the amount of type I IFN mRNA and the number of total leukocytes, and T- and B lymphocytes in SMGs. Gene expression analyses showed that pDC depletion markedly diminished SMG expression of IL-7, BAFF, TNF-α, IFN-γ, CXCL9, CXCL11, CD40, CD40L, Lt-α, Lt-β and NOS2. Hence, pDCs critically contribute to the development and onset of SS-like salivary gland exocrinopathy.
Keywords: Autoimmune inflammation; Hyposalivation; Innate immune cells; Salivary gland; Sialadenitis; Type I interferons.
Copyright © 2021 Elsevier B.V. All rights reserved.
Conflict of interest statement
Disclosure
The authors have no competing financial interests.
Declaration of interests
The authors declare that they have no known competing financial interests or personal relationships that could have appeared to influence the work reported in this paper.
Figures
Similar articles
-
Agonist-induced 4-1BB activation prevents the development of Sjӧgren's syndrome-like sialadenitis in non-obese diabetic mice.Biochim Biophys Acta Mol Basis Dis. 2020 Mar 1;1866(3):165605. doi: 10.1016/j.bbadis.2019.165605. Epub 2019 Nov 15. Biochim Biophys Acta Mol Basis Dis. 2020. PMID: 31740402 Free PMC article.
-
Anti-IL-7 receptor-α treatment ameliorates newly established Sjögren's-like exocrinopathy in non-obese diabetic mice.Biochim Biophys Acta Mol Basis Dis. 2018 Jul;1864(7):2438-2447. doi: 10.1016/j.bbadis.2018.04.010. Epub 2018 Apr 19. Biochim Biophys Acta Mol Basis Dis. 2018. PMID: 29680668 Free PMC article.
-
Altered characteristics of regulatory T cells in target tissues of Sjögren's syndrome in murine models.Mol Immunol. 2024 Oct;174:47-56. doi: 10.1016/j.molimm.2024.08.003. Epub 2024 Aug 27. Mol Immunol. 2024. PMID: 39197397
-
Advances in cellular and molecular pathways of salivary gland damage in Sjögren's syndrome.Front Immunol. 2024 Jul 10;15:1405126. doi: 10.3389/fimmu.2024.1405126. eCollection 2024. Front Immunol. 2024. PMID: 39050857 Free PMC article. Review.
-
Immune and non-immune mediators in the fibrosis pathogenesis of salivary gland in Sjögren's syndrome.Front Immunol. 2024 Oct 14;15:1421436. doi: 10.3389/fimmu.2024.1421436. eCollection 2024. Front Immunol. 2024. PMID: 39469708 Free PMC article. Review.
Cited by
-
IFN-γ-Preconditioned Human Gingival-Derived Mesenchymal Stromal Cells Inhibit Plasmacytoid Dendritic Cells via Adenosine.Biomolecules. 2024 Jun 4;14(6):658. doi: 10.3390/biom14060658. Biomolecules. 2024. PMID: 38927060 Free PMC article.
-
Composition and regulation of the immune microenvironment of salivary gland in Sjögren's syndrome.Front Immunol. 2022 Sep 13;13:967304. doi: 10.3389/fimmu.2022.967304. eCollection 2022. Front Immunol. 2022. PMID: 36177010 Free PMC article.
-
Role of chemokines CXCL9, CXCL10, CXCL11, and CXCR3 in the serum and minor salivary gland tissues of patients with Sjögren's syndrome.Clin Exp Med. 2024 Jun 20;24(1):133. doi: 10.1007/s10238-024-01401-4. Clin Exp Med. 2024. PMID: 38900301 Free PMC article.
-
Endogenous IL-22 contributes to the pathogenesis of salivary gland dysfunction in the non-obese diabetic model of Sjögren's syndrome.Mol Immunol. 2024 Sep;173:20-29. doi: 10.1016/j.molimm.2024.06.010. Epub 2024 Jul 16. Mol Immunol. 2024. PMID: 39018744 Free PMC article.
-
Elucidating Regulatory Mechanisms of Genes Involved in Pathobiology of Sjögren's Disease: Immunostimulation Using a Cell Culture Model.Int J Mol Sci. 2025 Jun 19;26(12):5881. doi: 10.3390/ijms26125881. Int J Mol Sci. 2025. PMID: 40565345 Free PMC article.
References
Publication types
MeSH terms
Grants and funding
LinkOut - more resources
Full Text Sources
Other Literature Sources
Medical
Research Materials
