. 2022 Feb 22;6(4):1100-1114.
doi: 10.1182/bloodadvances.2021005664.

Azacitidine is a potential therapeutic drug for pyridoxine-refractory female X-linked sideroblastic anemia

Affiliations

Azacitidine is a potential therapeutic drug for pyridoxine-refractory female X-linked sideroblastic anemia

Yuki Morimoto et al. Blood Adv. .

Abstract

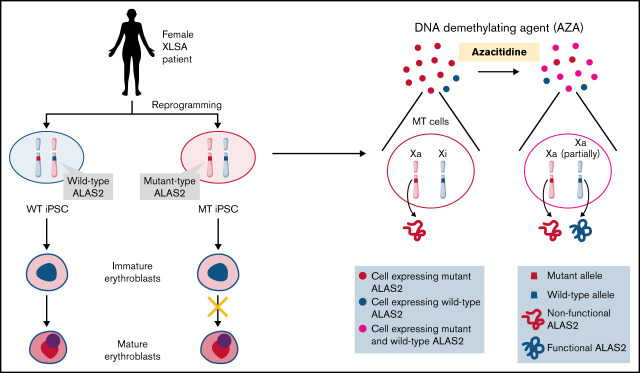
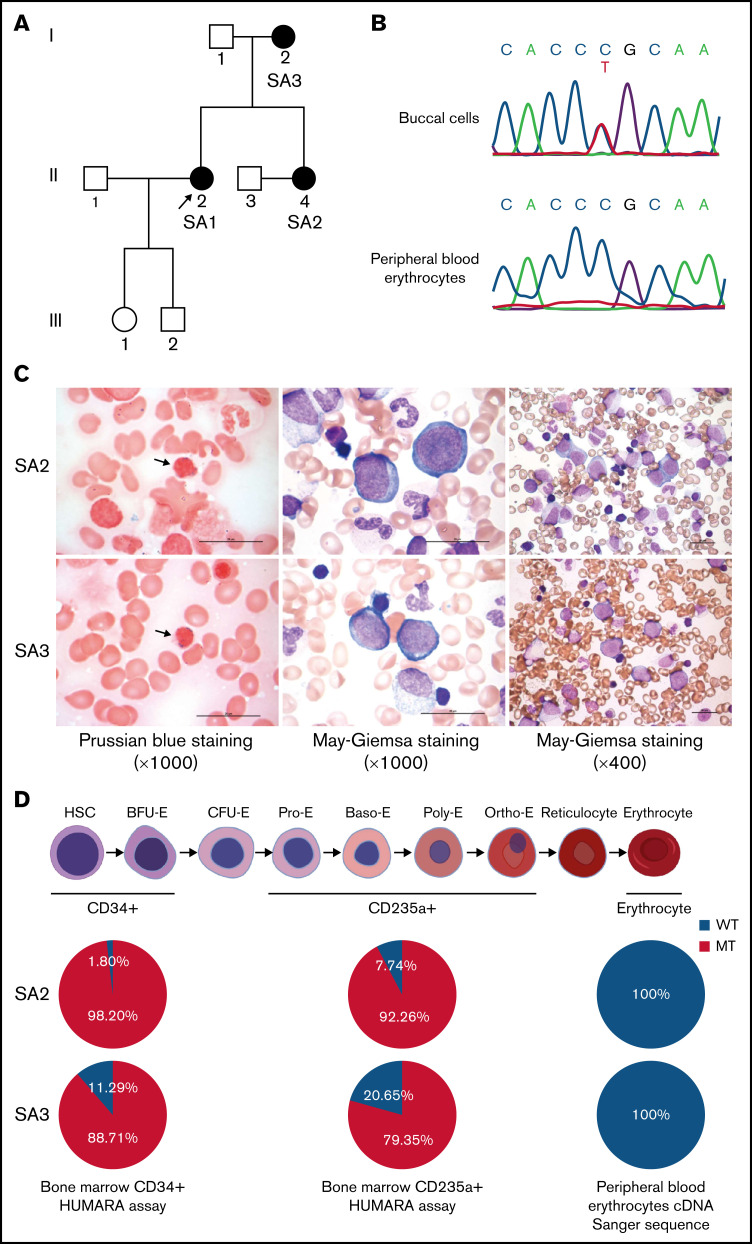
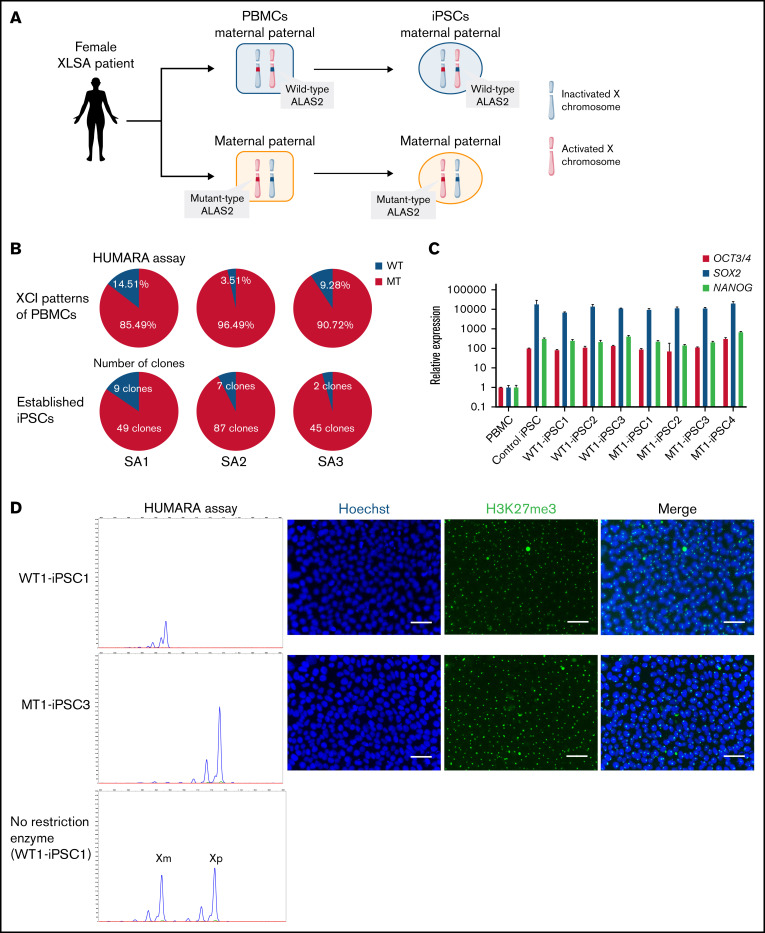
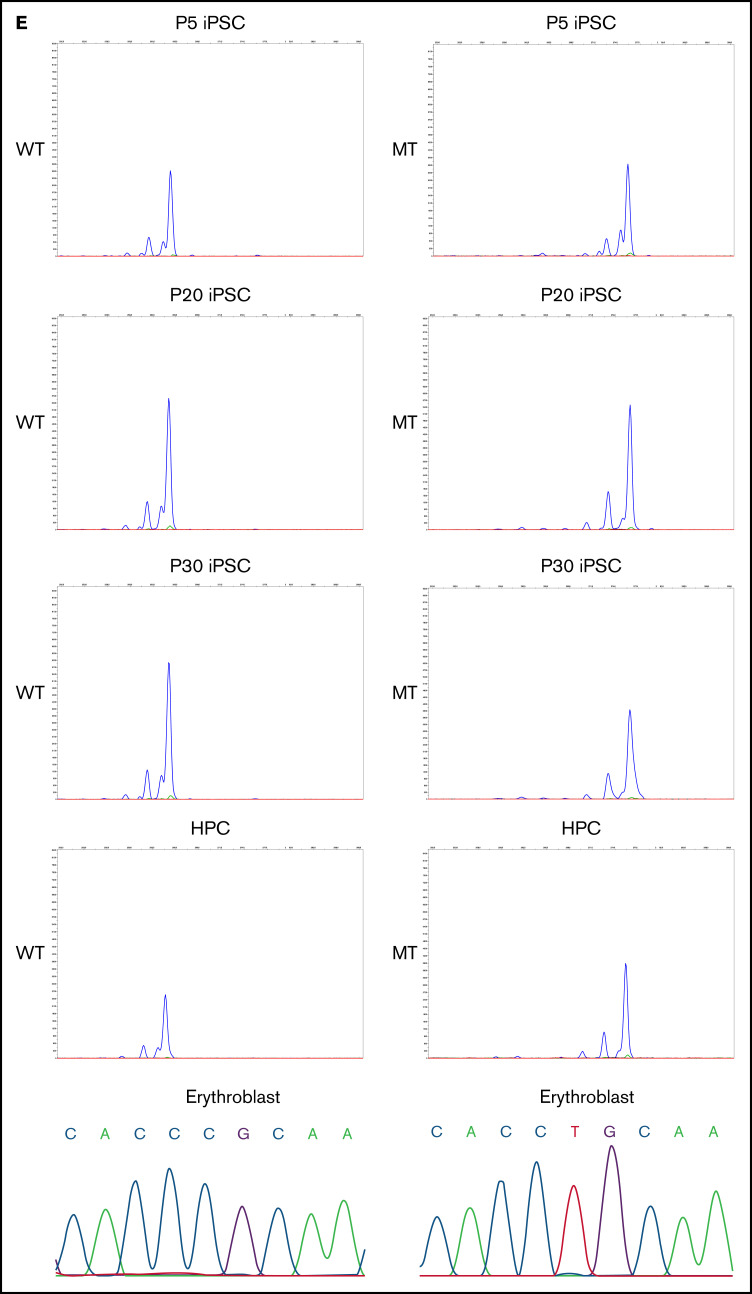
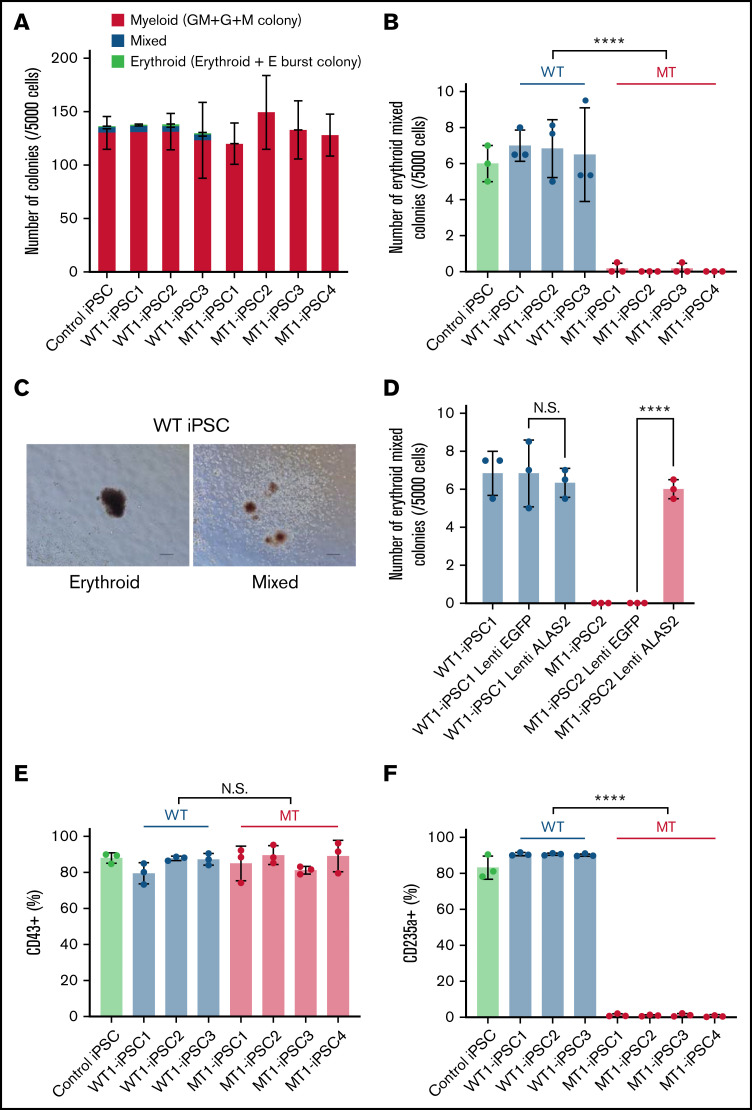
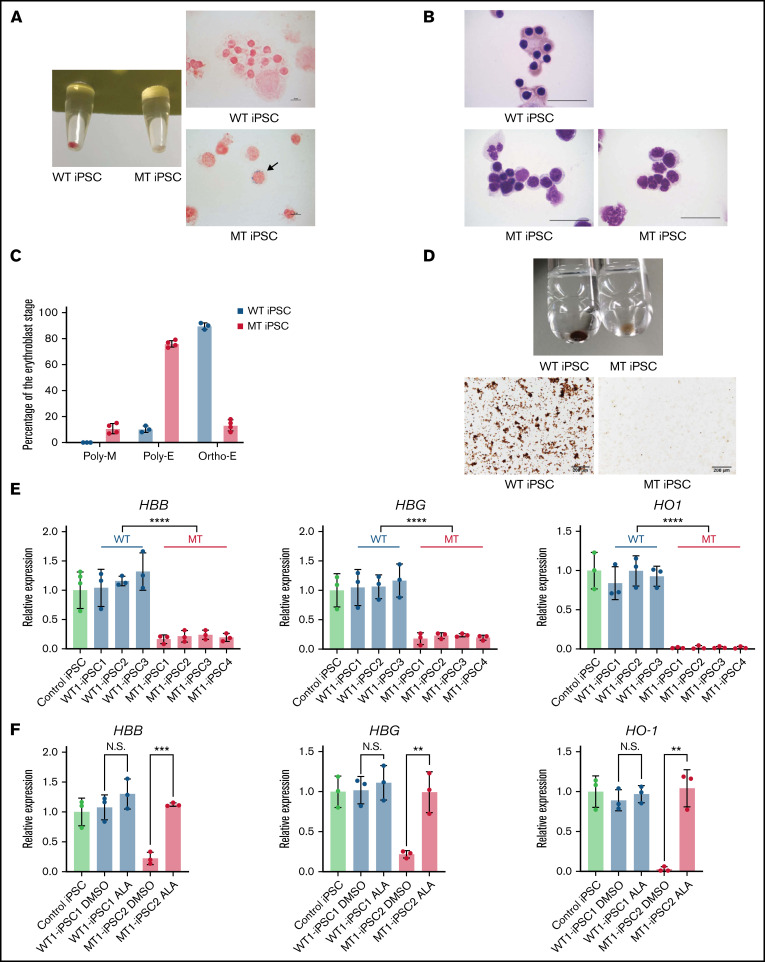
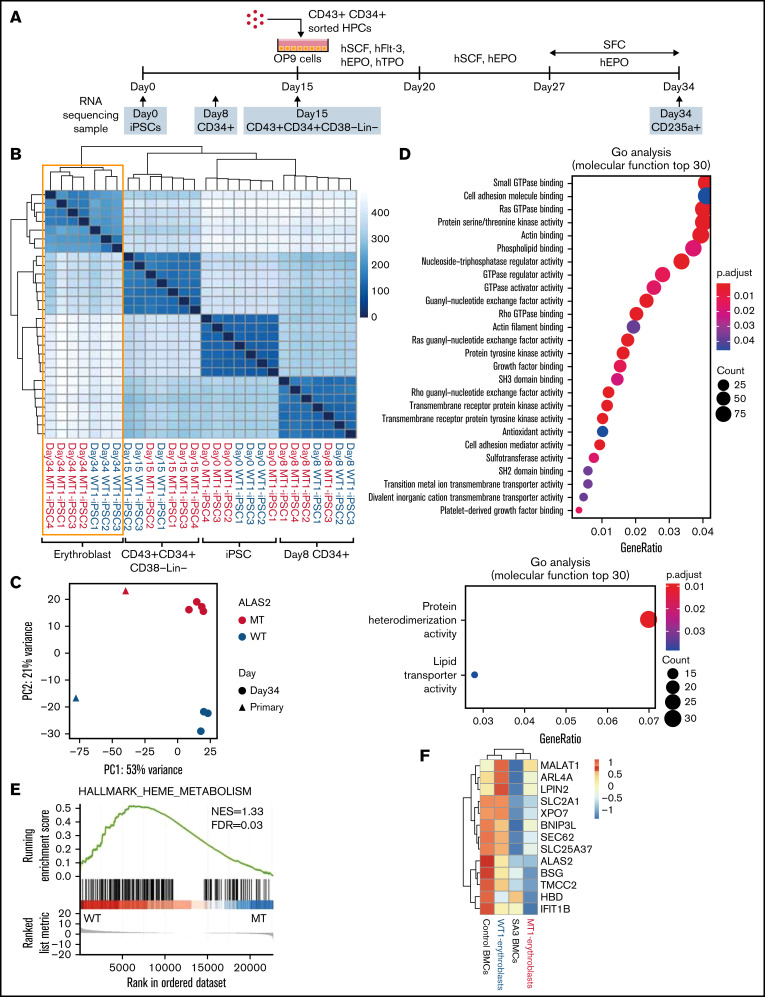
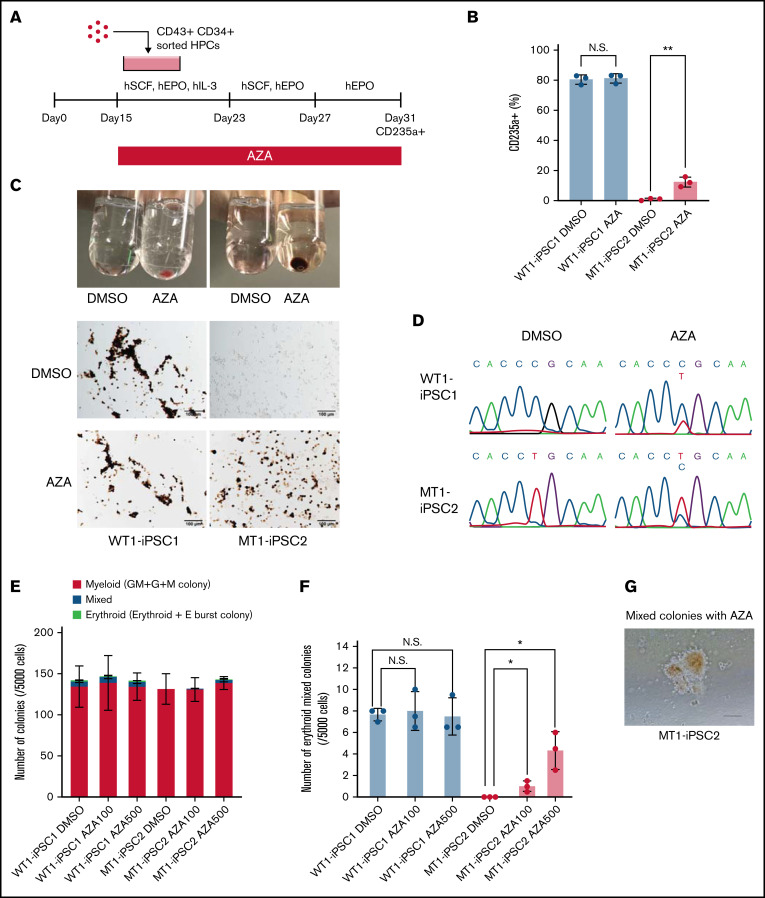
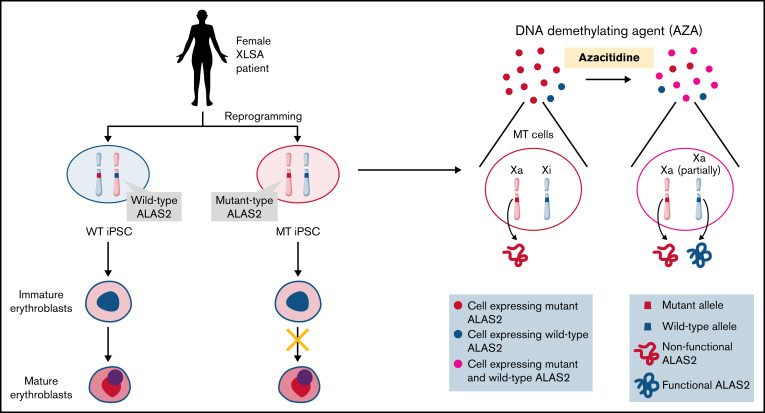
X-linked sideroblastic anemia (XLSA) is associated with mutations in the erythroid-specific δ-aminolevulinic acid synthase (ALAS2) gene. Treatment of XLSA is mainly supportive, except in patients who are pyridoxine responsive. Female XLSA often represents a late onset of severe anemia, mostly related to the acquired skewing of X chromosome inactivation. In this study, we successfully generated active wild-type and mutant ALAS2-induced pluripotent stem cell (iPSC) lines from the peripheral blood cells of an affected mother and 2 daughters in a family with pyridoxine-resistant XLSA related to a heterozygous ALAS2 missense mutation (R227C). The erythroid differentiation potential was severely impaired in active mutant iPSC lines compared with that in active wild-type iPSC lines. Most of the active mutant iPSC-derived erythroblasts revealed an immature morphological phenotype, and some showed dysplasia and perinuclear iron deposits. In addition, globin and HO-1 expression and heme biosynthesis in active mutant erythroblasts were severely impaired compared with that in active wild-type erythroblasts. Furthermore, genes associated with erythroblast maturation and karyopyknosis showed significantly reduced expression in active mutant erythroblasts, recapitulating the maturation defects. Notably, the erythroid differentiation ability and hemoglobin expression of active mutant iPSC-derived hematopoietic progenitor cells (HPCs) were improved by the administration of δ-aminolevulinic acid, verifying the suitability of the cells for drug testing. Administration of a DNA demethylating agent, azacitidine, reactivated the silent, wild-type ALAS2 allele in active mutant HPCs and ameliorated the erythroid differentiation defects, suggesting that azacitidine is a potential novel therapeutic drug for female XLSA. Our patient-specific iPSC platform provides novel biological and therapeutic insights for XLSA.


Figures

None
Graphical abstract
Figure 1.
Figure 1.
Identification of XLSA in a family harboring the heterozygous ALAS2-R227C mutation. (A) Pedigree of the family. Squares indicate males, and circles indicate females. Filled circles denote the patients confirmed by ALAS2 sequencing. The arrow indicates the proband. (B) Sanger sequencing data of ALAS2 genomic DNA from SA2 buccal cells (top) and ALAS2 cDNA from SA2 peripheral blood erythrocytes (bottom) are shown. (C) Morphology of SA2 and SA3 bone marrow cells. An increased number of ring sideroblasts was observed with Prussian blue staining (left). The arrows indicate ring sideroblasts. Megaloblastic change was detected by May Grunwald-Giemsa staining (middle and right). Magnification of the objective lens: ×100 (left and middle) and ×40 (right). Bars represent 25 μm. (D) Summary of HUMARA assays of CD34+ and CD235a+ bone marrow cells and ALAS2 cDNA Sanger sequencing of peripheral blood erythrocytes. The schematic diagram of erythropoiesis was created using BioRender.com. cDNA, complementary DNA.
Figure 2.
Figure 2.
Generation of XLSA patient-derived iPSCs and confirmation of X-chromosome inactivation. (A) Schematic representation of the iPSC generation from PBMCs of female patients with XLSA who harbored a heterozygous ALAS2 mutation. The figure was created using BioRender.com. (B) Summary of HUMARA assays of PBMCs from patients with XLSA and the percentage of MT iPSC lines among established iPSCs. (C) Expression levels of OCT3/4, SOX2, and NANOG genes in PBMCs, 1 control iPSC line derived from a healthy donor, 3 WT iPSC lines, and 4 MT iPSC lines. Expression levels of PBMCs were set to 1. Each line was tested in 3 independent experiments. (D) HUMARA assays of WT and MT iPSCs (left). The undigested control is shown at the bottom left. Representative immunofluorescence staining images for Hoechst expression and H3K27me3 expression in iPSCs derived from patients with XLSA (right). Magnification of the objective lens: ×20. Bars represent 50 μm. (E) HUMARA assays of representative iPSC lines (WT1-iPSC3 and MT1-iPSC2) after 5, 20, and 30 passages and HPCs derived from the iPSC lines. Complementary DNA Sanger sequencing data of erythroblasts derived from the iPSC lines are shown on the far right.
Figure 2.
Figure 2.
Generation of XLSA patient-derived iPSCs and confirmation of X-chromosome inactivation. (A) Schematic representation of the iPSC generation from PBMCs of female patients with XLSA who harbored a heterozygous ALAS2 mutation. The figure was created using BioRender.com. (B) Summary of HUMARA assays of PBMCs from patients with XLSA and the percentage of MT iPSC lines among established iPSCs. (C) Expression levels of OCT3/4, SOX2, and NANOG genes in PBMCs, 1 control iPSC line derived from a healthy donor, 3 WT iPSC lines, and 4 MT iPSC lines. Expression levels of PBMCs were set to 1. Each line was tested in 3 independent experiments. (D) HUMARA assays of WT and MT iPSCs (left). The undigested control is shown at the bottom left. Representative immunofluorescence staining images for Hoechst expression and H3K27me3 expression in iPSCs derived from patients with XLSA (right). Magnification of the objective lens: ×20. Bars represent 50 μm. (E) HUMARA assays of representative iPSC lines (WT1-iPSC3 and MT1-iPSC2) after 5, 20, and 30 passages and HPCs derived from the iPSC lines. Complementary DNA Sanger sequencing data of erythroblasts derived from the iPSC lines are shown on the far right.
Figure 3.
Figure 3.
Impaired erythropoiesis in MT iPSCs. (A) Colony formation assay on day 14 of hematopoietic differentiation. Each line was tested in 3 independent experiments. (B) Erythroid and mixed colony counts in panel A. (C) Representative images of erythroid (left) and mixed (right) colonies derived from WT1-iPSC2. Magnification of the objective lens: ×4. Bars represent 200 μm. (D) Erythroid and mixed colony counts in MT HPCs transduced with WT ALAS2. Each line was tested in 3 independent experiments. (E) Percentages of CD43+ hematopoietic cells. Each line was tested in 3 independent experiments. (F) Percentages of CD235a+ erythroblasts. Each line was tested in 3 independent experiments. All data are presented as the mean ± standard error of the mean. P-values were calculated by using the unpaired, 2-tailed Student t test. ****P < .0001; N.S., not significant.
Figure 4.
Figure 4.
Maturation defects of erythroblasts derived from MT iPSCs. (A) The pellets (left) and iron staining (right) of erythroblasts derived from WT1-iPSC2 and MT1-iPSC3. The arrow indicates a ring sideroblast. CD235a+ cells were sorted on day 34 by FACS. Magnification of the objective lens: ×100. Bars represent 10 μm. (B) May Grunwald-Giemsa staining of erythroblasts derived from WT1-iPSC2 (top) and MT1-iPSC4 (bottom). CD235a+ cells were sorted on day 34 by FACS. Magnification of the objective lens: ×100. Bars represent 25 μm. (C) Percentages of polychromatic megaloblasts (Poly-M), polychromatic erythroblasts (Poly-E), and orthochromatic erythroblasts (Ortho-E) from 3 WT and 4 MT iPSC lines. (D) The pellets (top) and photomicrographs (bottom) of o-dianisidine–stained erythroblasts derived from WT1-iPSC3 and MT1-iPSC3 (bottom). CD235a+ cells were sorted on day 34 by FACS. Magnification of the objective lens: ×10. Bars represent, 200 μm. (E) The expression levels of HBB, HBG, and HO1 genes in erythroblasts derived from 1 control iPSC line, 3 WT iPSC lines, and 4 MT iPSC lines. Each line was tested in 3 independent experiments. Expression levels were normalized to the level of GAPDH. (F) The expression levels of HBB, HBG, and HO1 genes in WT1-iPSC1– and MT1–iPSC2-derived erythroblasts treated with DMSO or ALA relative to the expression levels of nontreated erythroblasts derived from a control iPSC line. Each line was tested in 3 independent experiments. Expression levels were normalized to the level of GAPDH. All data are presented as the mean ± standard error of the mean. P-values were calculated by using the unpaired, 2-tailed Student t test. **P < .01; ***P < .001; ****P < .0001; N.S., not significant. DMSO, dimethyl sulfoxide.
Figure 5.
Figure 5.
Gene expression in erythroblasts derived from WT and MT iPSCs. (A) Schema of the protocol for the erythroid differentiation from iPSCs and sample collection time points. Images of HPCs and OP9 cells were created using BioRender.com. (B) A heat map of the sample-to-sample distance and hierarchical clustering of iPSCs, CD34+ cells, CD43+CD34+CD38Lin cells, and erythroblasts derived from 3 WT and 4 MT iPSC lines with RNA-seq. (C) Principal component analysis of erythroblasts derived from the 3 WT and 4 MT iPSC lines and bone marrow erythroblasts from a healthy donor and SA3. (D) Two GO analyses showing molecular function terms enriched for WT erythroblasts (top) and MT erythroblasts (bottom). Differentially expressed genes between WT erythroblasts and MT erythroblasts were used. (|fold change| >2; adjusted P < .05). (E) Gene set enrichment analysis of the heme metabolism data set showed an enrichment of WT erythroblasts. (F) A heat map of 13 genes characteristically expressed at the orthochromatic stage in the erythroblasts described in panel C. For WT1-erythroblasts and MT1-erythroblasts, the heat map shows the average expression levels of the 3 and 4 lines, respectively.
Figure 6.
Figure 6.
Amelioration of heme synthesis failure and maturation defects of MT erythroblasts with AZA treatment. (A) Schema of a protocol for erythroid differentiation with AZA administration. The image of sorted HPCs was created using BioRender.com. (B) Percentages of CD235a+ erythroblasts treated with DMSO or AZA. The generation of CD235a+ erythroblasts in MT HPCs was significantly improved after the administration of AZA, whereas the generation of CD235a+ erythroblasts in WT HPCs was unchanged. Each line was tested in 3 independent experiments. (C) The pellets of unstained (top left) and o-dianisidine–stained (top right) erythroblasts derived from MT1-iPSC2 treated with DMSO or AZA. o-Dianisidine–stained images of erythroblasts derived from WT1-iPSC1 (left) and MT1-iPSC2 (right) treated with DMSO or AZA. CD235a+ cells were sorted on day 34 using FACS. Magnification of the objective lens: ×20. Bars represent 100 μm. (D) Representative Sanger sequencing data of ALAS2 complementary DNA from erythroblasts derived from WT iPSC (WT1-iPSC1) and MT iPSC (MT1-iPSC2) lines treated with DMSO or AZA. (E) Colony formation assay on day 15 of hematopoietic differentiation in WT1-iPSC1– and MT1-iPSC2–derived HPCs treated with DMSO or AZA. Each line was tested in 3 independent experiments. AZA 100, 100 nM AZA; AZA 500, 500 nM AZA. (F) Erythroid and mixed colony counts in panel E. (G) A representative image of mixed colonies derived from MT1-iPSC2 with AZA. Magnification of the objective lens: ×4. Bars represent 200 μm. All data are presented as the mean ± standard error of the mean. P-values were calculated using 1-way analysis of variance with Tukey’s correction and an unpaired, 2-tailed Student t test. *P < .05; **P < .01; N.S., not significant. DMSO, dimethyl sulfoxide.
Figure 7.
Figure 7.
Schematic representation of our results. We established 2 types of iPSC lines derived from individual female patients with XLSA harboring the ALAS2-R227C mutation. WT iPSCs showed mature erythroid differentiation, and MT iPSCs stopped at the immature erythroblast stage, recapitulating the pathogenesis of XLSA. AZA administration reactivated the silent WT ALAS2 allele in MT HPCs and ameliorated erythroid differentiation defects. The figure was created using BioRender.com.

Similar articles

Cited by

References

    1. Bottomley SS, Fleming MD. Sideroblastic anemia: diagnosis and management. Hematol Oncol Clin North Am. 2014;28(4):653-670, v. - PubMed
    1. Yamamoto M, Yew NS, Federspiel M, Dodgson JB, Hayashi N, Engel JD. Isolation of recombinant cDNAs encoding chicken erythroid delta-aminolevulinate synthase. Proc Natl Acad Sci USA. 1985;82(11):3702-3706. - PMC - PubMed
    1. Ducamp S, Fleming MD. The molecular genetics of sideroblastic anemia. Blood. 2019;133(1):59-69. - PMC - PubMed
    1. Aivado M, Gattermann N, Rong A, et al. . X-linked sideroblastic anemia associated with a novel ALAS2 mutation and unfortunate skewed X-chromosome inactivation patterns. Blood Cells Mol Dis. 2006;37(1):40-45. - PubMed
    1. Sankaran VG, Ulirsch JC, Tchaikovskii V, et al. . X-linked macrocytic dyserythropoietic anemia in females with an ALAS2 mutation. J Clin Invest. 2015;125(4):1665-1669. - PMC - PubMed

Publication types

Supplementary concepts