

25-Hydroxycholesterol Inhibits Kaposi's Sarcoma Herpesvirus and Epstein-Barr Virus Infections and Activates Inflammatory Cytokine Responses
- PMID: 34781692
- PMCID: PMC8593836
- DOI: 10.1128/mBio.02907-21
25-Hydroxycholesterol Inhibits Kaposi's Sarcoma Herpesvirus and Epstein-Barr Virus Infections and Activates Inflammatory Cytokine Responses
Abstract
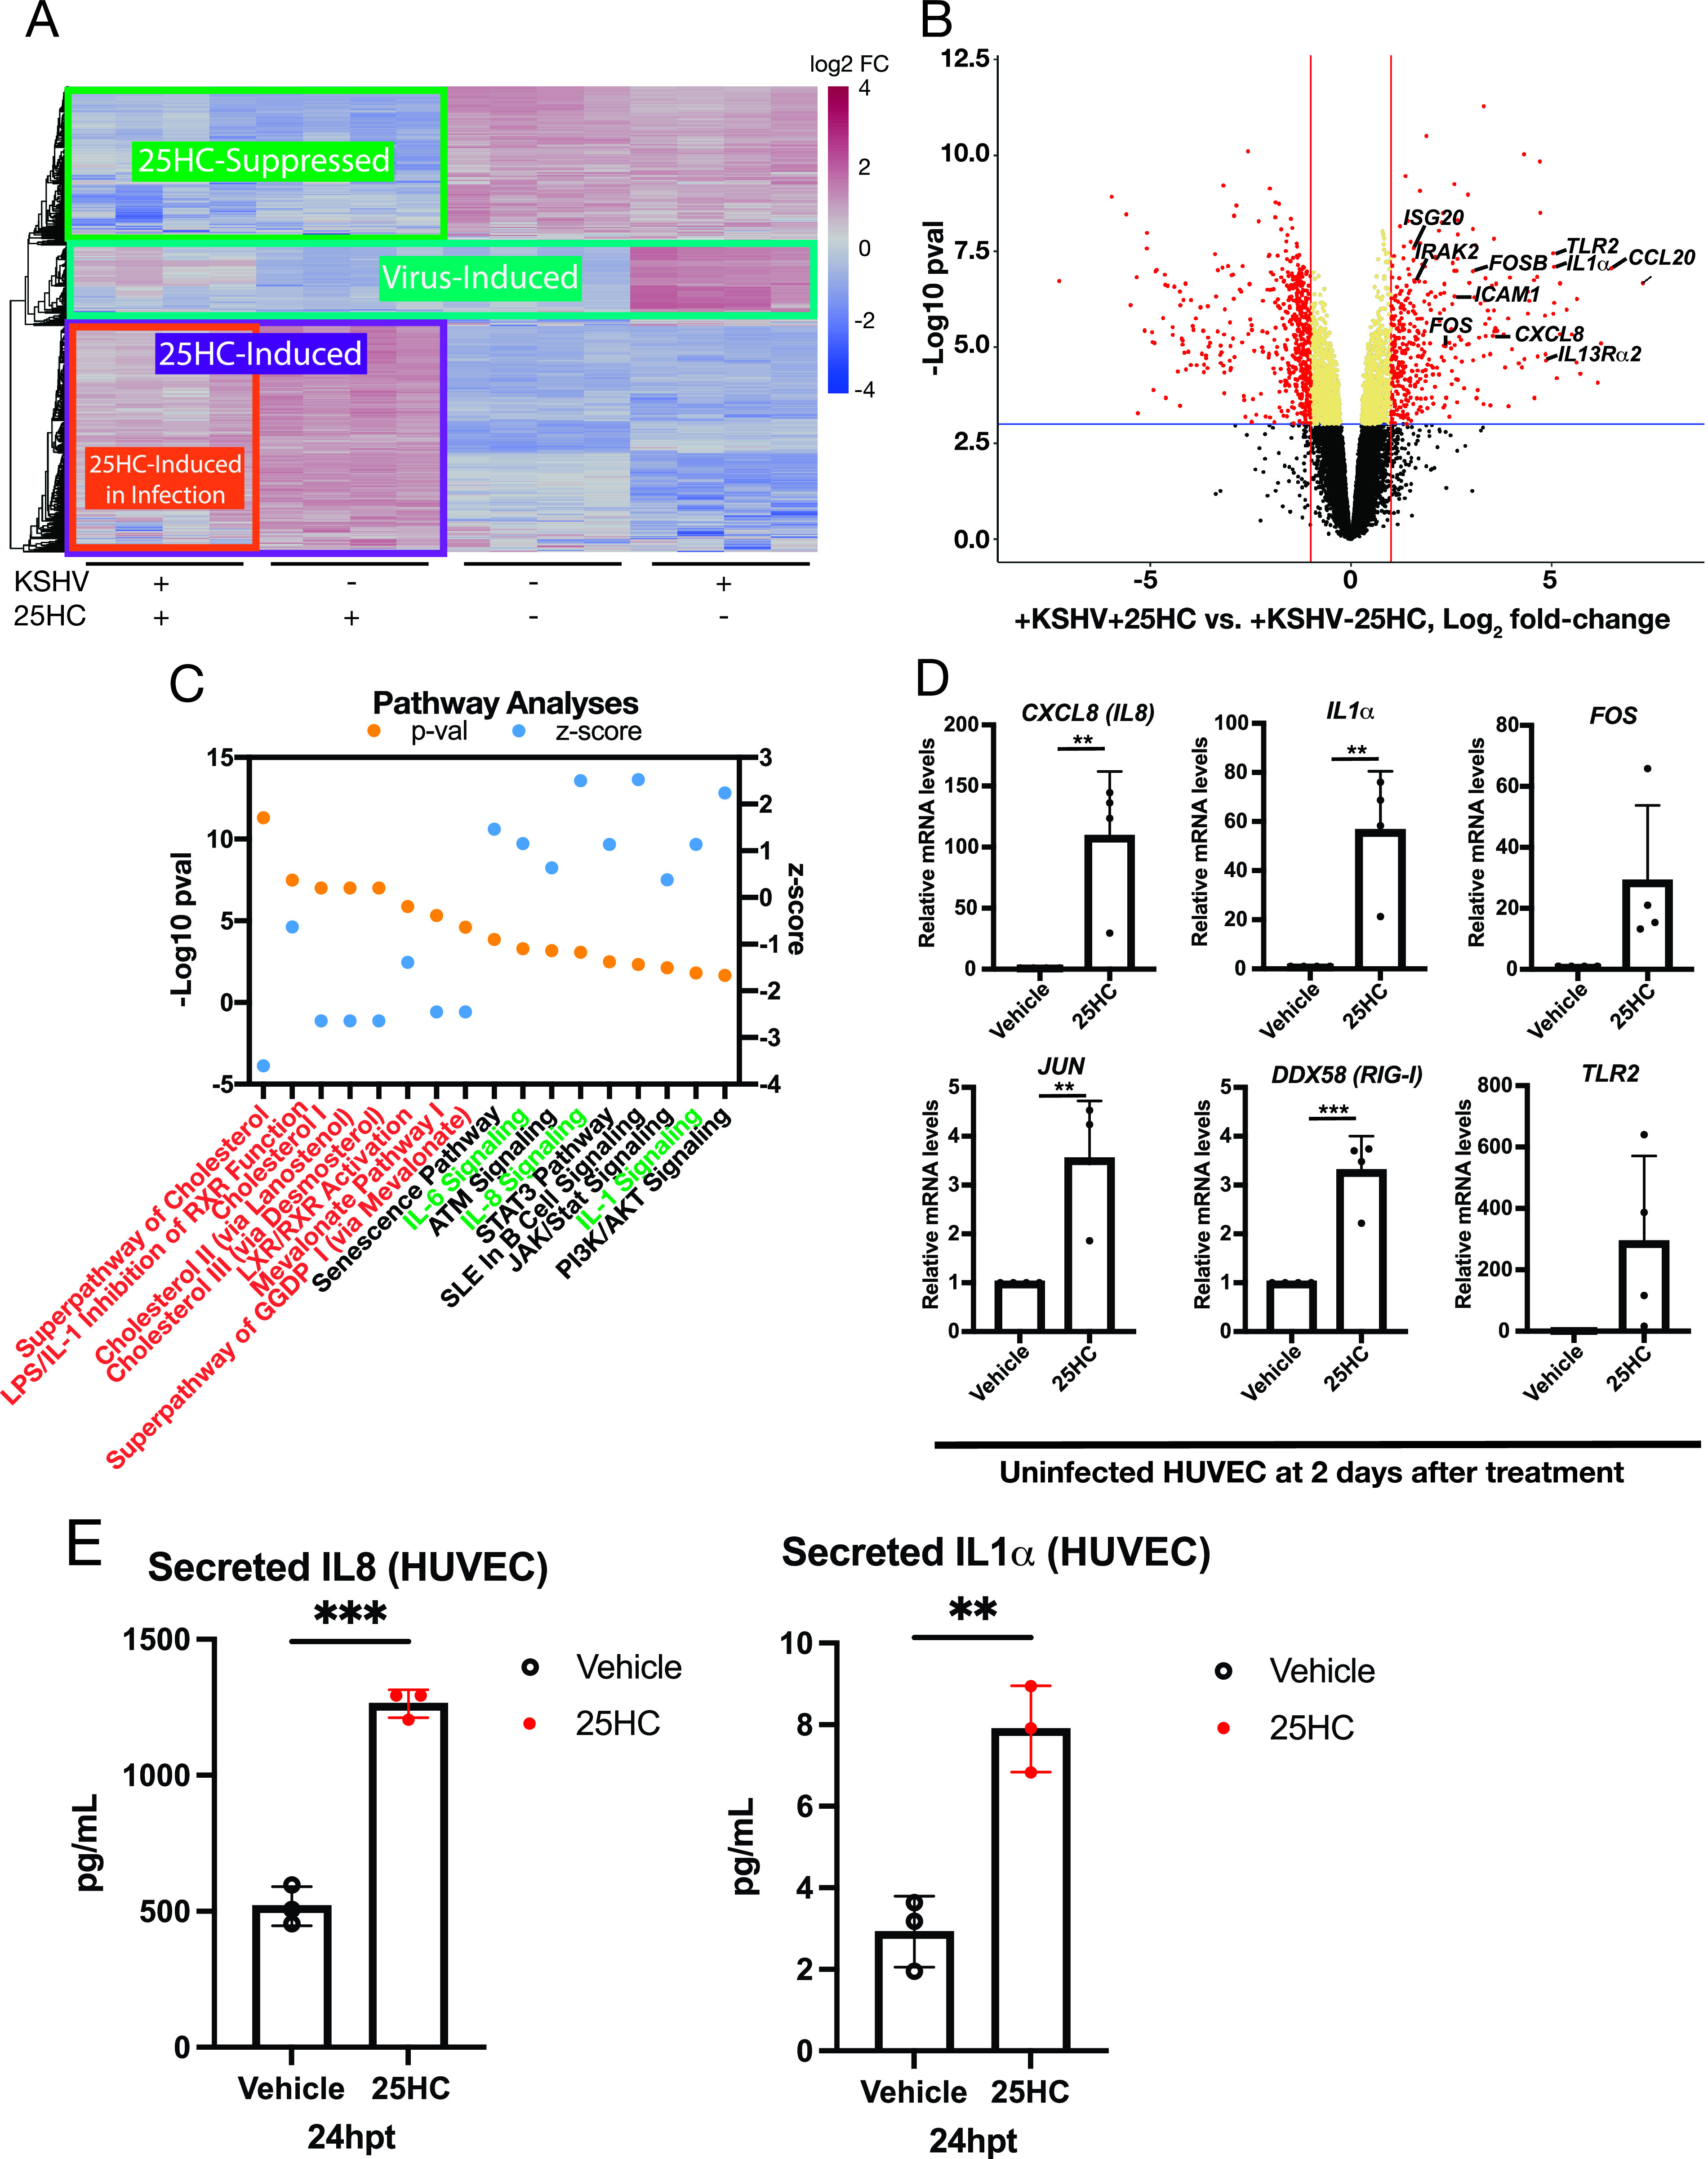
Oncogenic gammaherpesviruses express viral products during latent and lytic infection that block the innate immune response. Previously, we found that Kaposi's sarcoma herpesvirus (KSHV/human herpesvirus-8) viral microRNAs (miRNAs) downregulate cholesterol biogenesis, and we hypothesized that this prevents the production of 25-hydroxycholesterol (25HC), a cholesterol derivative. 25HC blocks KSHV de novo infection of primary endothelial cells at a postentry step and decreases viral gene expression of LANA (latency-associated nuclear antigen) and RTA. Herein we expanded on this observation by determining transcriptomic changes associated with 25HC treatment of primary endothelial cells using RNA sequencing (RNA-Seq). We found that 25HC treatment inhibited KSHV gene expression and induced interferon-stimulated genes (ISGs) and several inflammatory cytokines (interleukin 8 [IL-8], IL-1α). Some 25HC-induced genes were partially responsible for the broadly antiviral effect of 25HC against several viruses. Additionally, we found that 25HC inhibited infection of primary B cells by a related oncogenic virus, Epstein-Barr virus (EBV/human herpesvirus-4) by suppressing key viral genes such as LMP-1 and inducing apoptosis. RNA-Seq analysis revealed that IL-1 and IL-8 pathways were induced by 25HC in both primary endothelial cells and B cells. We also found that the gene encoding cholesterol 25-hydroxylase (CH25H), which converts cholesterol to 25HC, can be induced by type I interferon (IFN) in human B cell-enriched peripheral blood mononuclear cells (PBMCs). We propose a model wherein viral miRNAs target the cholesterol pathway to prevent 25HC production and subsequent induction of antiviral ISGs. Together, these results answer some important questions about a widely acting antiviral (25HC), with implications for multiple viral and bacterial infections. IMPORTANCE A cholesterol derivative, 25-hydroxycholesterol (25HC), has been demonstrated to inhibit infections from widely different bacteria and viruses, including severe acute respiratory syndrome coronavirus 2 (SARS-CoV-2). However, its mechanism of activity is still not fully understood. In this work, we look at gene expression changes in the host and virus after 25HC treatment to find clues about its antiviral activity. We likewise demonstrate that 25HC is also antiviral against EBV, a common cancer-causing virus. We compared our results with previous data from antiviral screening assays and found the same pathways resulting in antiviral activity. Together, these results bring us closer to understanding how a modified form of cholesterol works against several viruses.
Keywords: EBV; KSHV; cholesterol; innate immunity.
Figures


Similar articles
-
Viral MicroRNAs Repress the Cholesterol Pathway, and 25-Hydroxycholesterol Inhibits Infection.mBio. 2017 Jul 11;8(4):e00576-17. doi: 10.1128/mBio.00576-17. mBio. 2017. PMID: 28698273 Free PMC article.
-
Transcriptome analysis of Kaposi's sarcoma-associated herpesvirus during de novo primary infection of human B and endothelial cells.J Virol. 2015 Mar;89(6):3093-111. doi: 10.1128/JVI.02507-14. Epub 2014 Dec 31. J Virol. 2015. PMID: 25552714 Free PMC article.
-
Reduction of Kaposi's Sarcoma-Associated Herpesvirus Latency Using CRISPR-Cas9 To Edit the Latency-Associated Nuclear Antigen Gene.J Virol. 2019 Mar 21;93(7):e02183-18. doi: 10.1128/JVI.02183-18. Print 2019 Apr 1. J Virol. 2019. PMID: 30651362 Free PMC article.
-
Lytic cycle switches of oncogenic human gammaherpesviruses.Adv Cancer Res. 2007;97:81-109. doi: 10.1016/S0065-230X(06)97004-3. Adv Cancer Res. 2007. PMID: 17419942 Review.
-
[Epstein-Barr virus (EBV) and Kaposi's sarcoma-associated herpesvirus (KSHV, HHV-8)].Uirusu. 2010 Dec;60(2):237-45. doi: 10.2222/jsv.60.237. Uirusu. 2010. PMID: 21488336 Review. Japanese.
Cited by
-
Peroxisomal very long-chain fatty acid transport is targeted by herpesviruses and the antiviral host response.Commun Biol. 2022 Sep 9;5(1):944. doi: 10.1038/s42003-022-03867-y. Commun Biol. 2022. PMID: 36085307 Free PMC article.
-
25-Hydroxycholesterol in health and diseases.J Lipid Res. 2024 Jan;65(1):100486. doi: 10.1016/j.jlr.2023.100486. Epub 2023 Dec 16. J Lipid Res. 2024. PMID: 38104944 Free PMC article. Review.
-
Revealing the characteristics of ZIKV infection through tissue-specific transcriptome sequencing analysis.BMC Genomics. 2022 Oct 8;23(1):697. doi: 10.1186/s12864-022-08919-5. BMC Genomics. 2022. PMID: 36209057 Free PMC article.
-
Oxysterols in Infectious Diseases.Adv Exp Med Biol. 2024;1440:125-147. doi: 10.1007/978-3-031-43883-7_7. Adv Exp Med Biol. 2024. PMID: 38036878
-
25-hydroxycholesterol: an integrator of antiviral ability and signaling.Front Immunol. 2023 Sep 13;14:1268104. doi: 10.3389/fimmu.2023.1268104. eCollection 2023. Front Immunol. 2023. PMID: 37781400 Free PMC article. Review.
References
-
- de Veer MJ, Holko M, Frevel M, Walker E, Der S, Paranjape JM, Silverman RH, Williams BR. 2001. Functional classification of interferon-stimulated genes identified using microarrays. J Leukoc Biol 69:912–920. - PubMed
Publication types
MeSH terms
Substances
Grants and funding
LinkOut - more resources
Full Text Sources
Molecular Biology Databases
Miscellaneous
