. 2021 Dec 21;12(6):e0249021.
doi: 10.1128/mBio.02490-21. Epub 2021 Nov 16.

HIV Proviral Burden, Genetic Diversity, and Dynamics in Viremic Controllers Who Subsequently Initiated Suppressive Antiretroviral Therapy

Affiliations

HIV Proviral Burden, Genetic Diversity, and Dynamics in Viremic Controllers Who Subsequently Initiated Suppressive Antiretroviral Therapy

F Harrison Omondi et al. mBio. .

Abstract

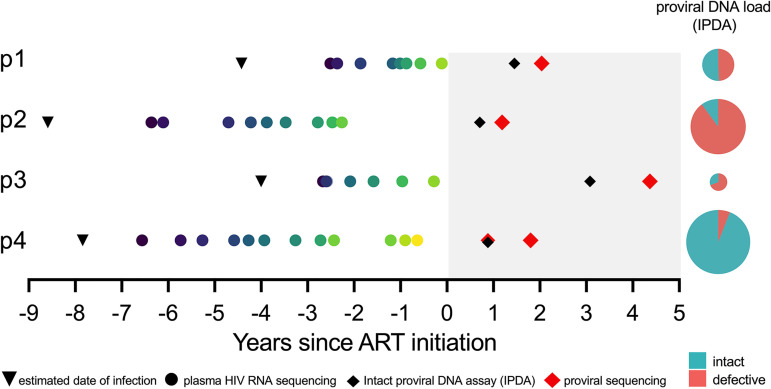
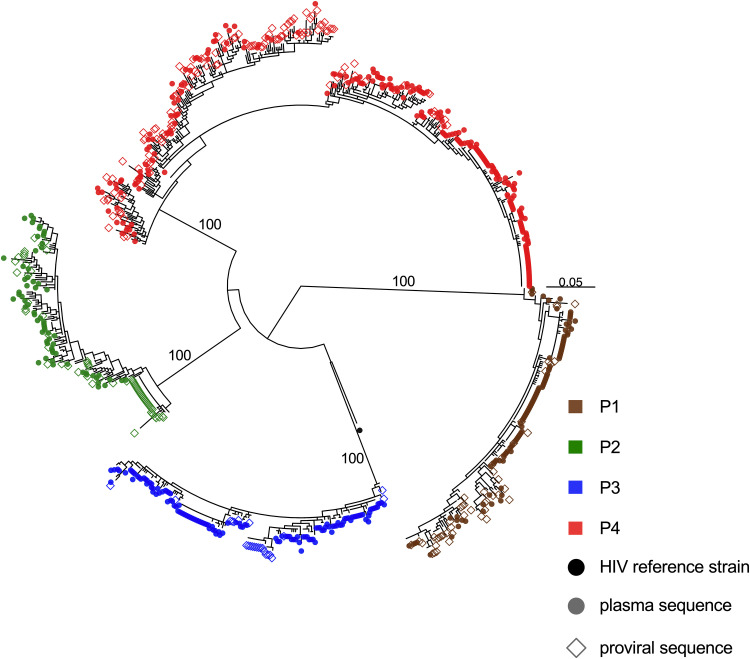
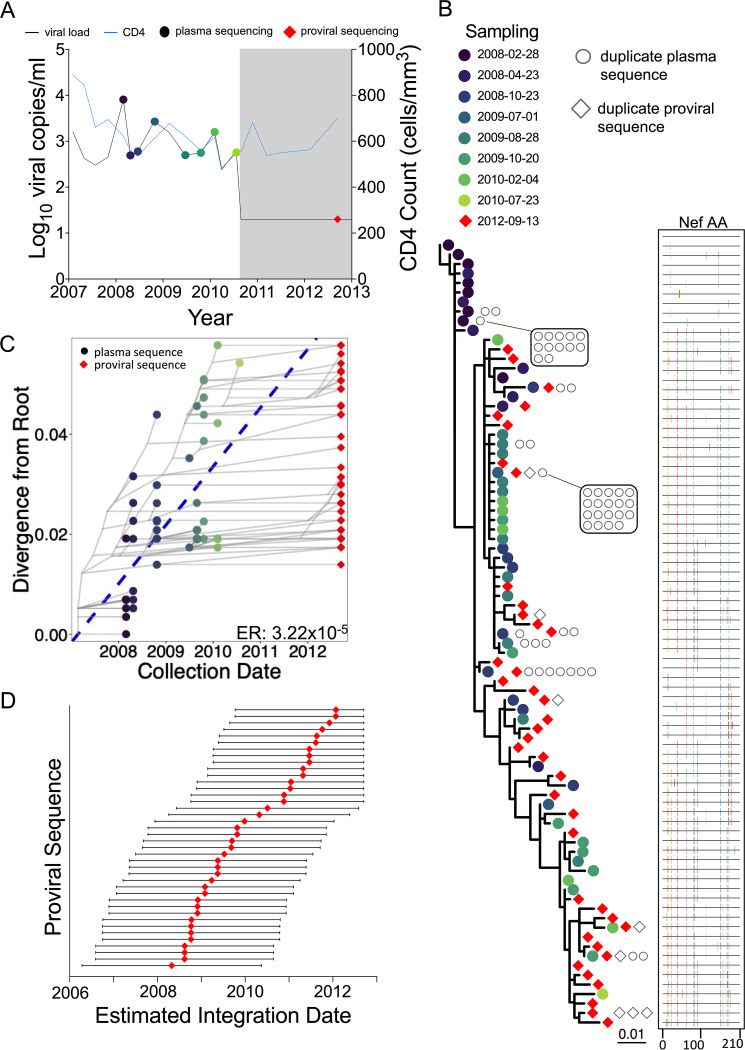
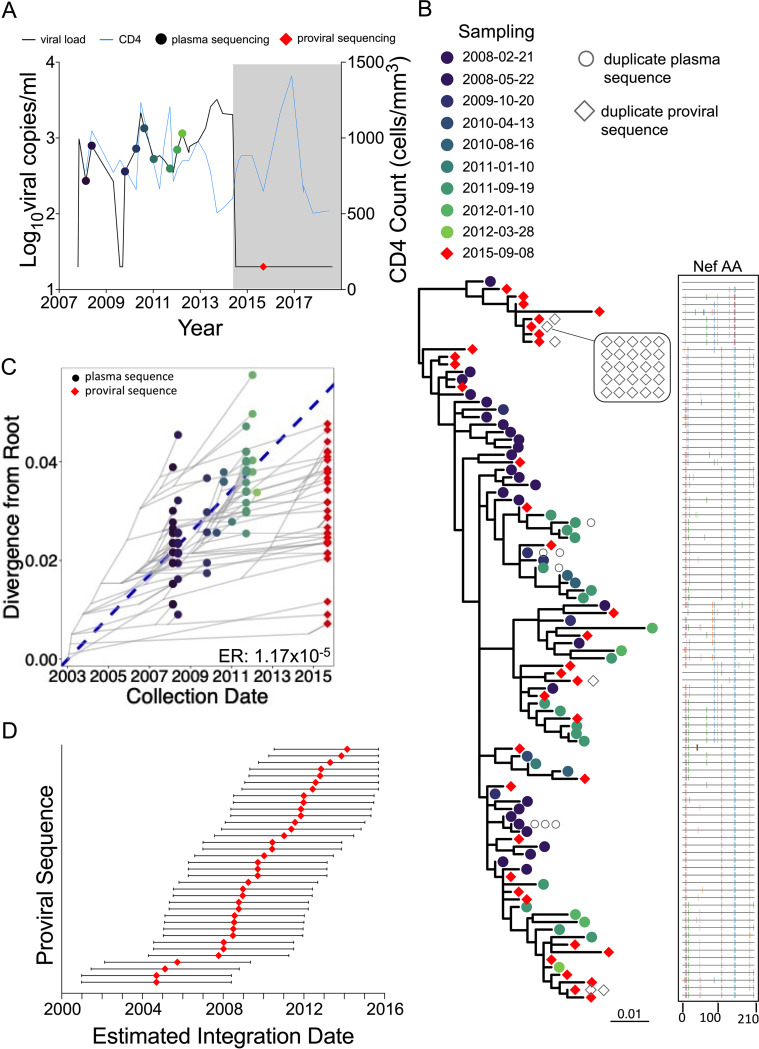
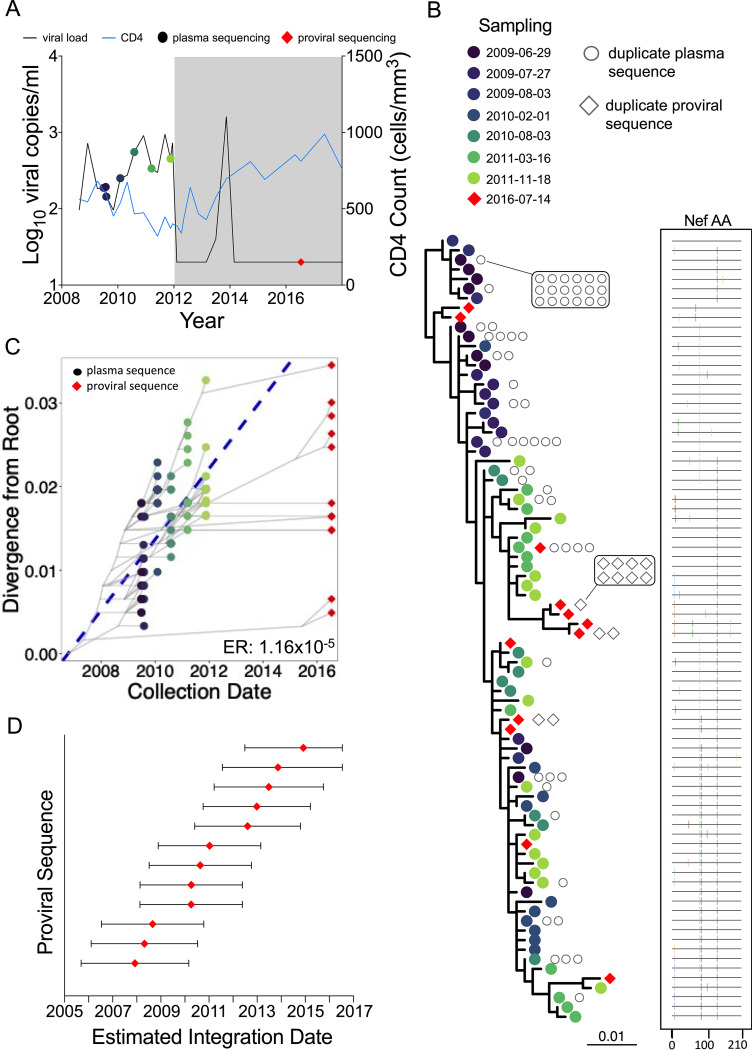
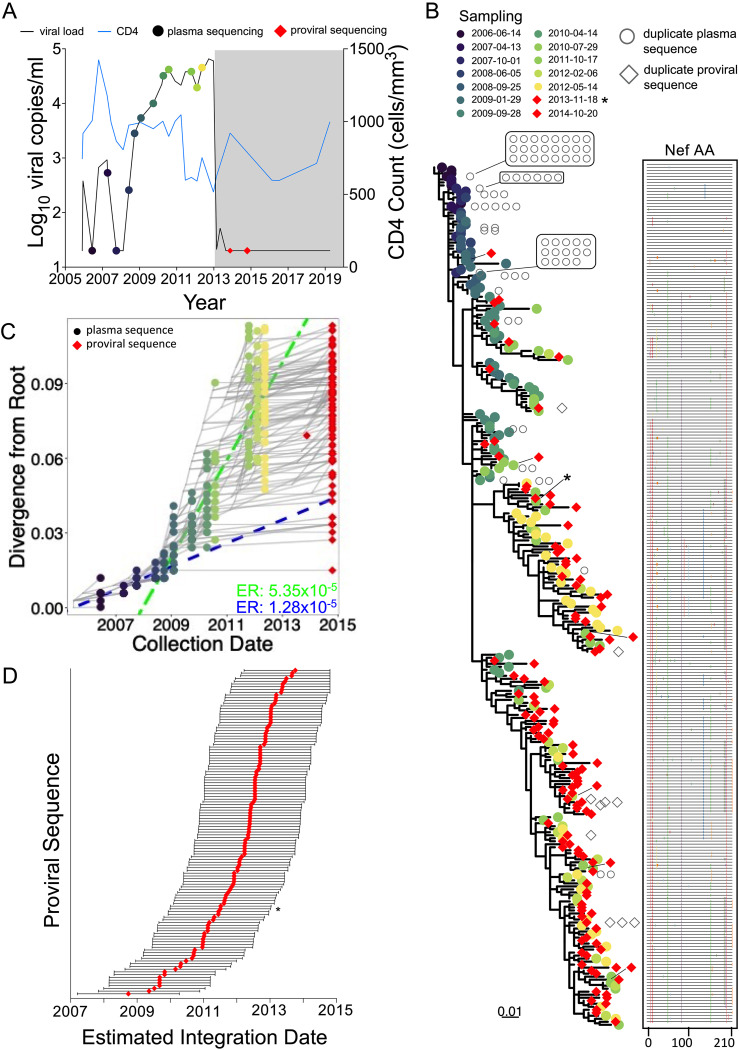
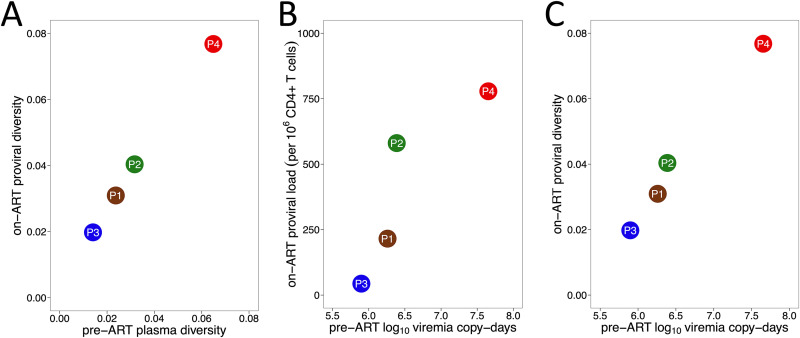
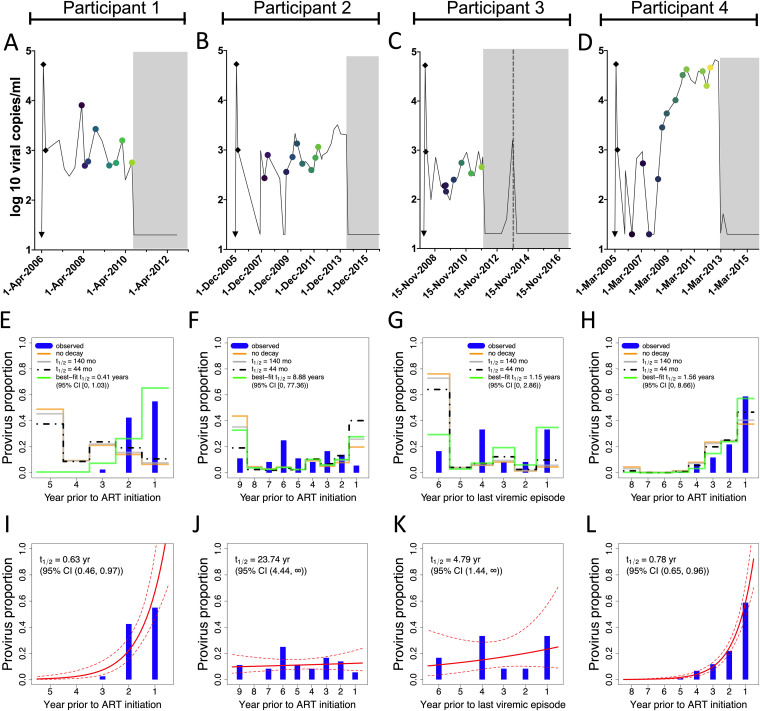
Curing HIV will require eliminating the reservoir of integrated, replication-competent proviruses that persist despite antiretroviral therapy (ART). Understanding the burden, genetic diversity, and longevity of persisting proviruses in diverse individuals with HIV is critical to this goal, but these characteristics remain understudied in some groups. Among them are viremic controllers-individuals who naturally suppress HIV to low levels but for whom therapy is nevertheless recommended. We reconstructed within-host HIV evolutionary histories from longitudinal single-genome amplified viral sequences in four viremic controllers who eventually initiated ART and used this information to characterize the age and diversity of proviruses persisting on therapy. We further leveraged these within-host proviral age distributions to estimate rates of proviral turnover prior to ART. This is an important yet understudied metric, since pre-ART proviral turnover dictates reservoir composition at ART initiation (and thereafter), which is when curative interventions, once developed, would be administered. Despite natural viremic control, all participants displayed significant within-host HIV evolution pretherapy, where overall on-ART proviral burden and diversity broadly reflected the extent of viral replication and diversity pre-ART. Consistent with recent studies of noncontrollers, the proviral pools of two participants were skewed toward sequences that integrated near ART initiation, suggesting dynamic proviral turnover during untreated infection. In contrast, proviruses recovered from the other two participants dated to time points that were more evenly spread throughout infection, suggesting slow or negligible proviral decay following deposition. HIV cure strategies will need to overcome within-host proviral diversity, even in individuals who naturally controlled HIV replication before therapy. IMPORTANCE HIV therapy is lifelong because integrated, replication-competent viral copies persist within long-lived cells. To cure HIV, we need to understand when these viral reservoirs form, how large and genetically diverse they are, and how long they endure. Elite controllers-individuals who naturally suppress HIV to undetectable levels-are being intensely studied as models of HIV remission, but viremic controllers, individuals who naturally suppress HIV to low levels, remain understudied even though they too may hold valuable insights. We combined phylogenetics and mathematical modeling to reconstruct proviral seeding and decay from infection to therapy-mediated suppression in four viremic controllers. We recovered diverse proviruses persisting during therapy that broadly reflected HIV's within-host evolutionary history, where the estimated half-lives of the persistent proviral pool during untreated infection ranged from <1 year to negligible. Cure strategies will need to contend with proviral diversity and between-host heterogeneity, even in individuals who naturally control HIV.

Keywords: genetic diversity; human immunodeficiency virus; proviral burden and dynamics; proviral half-life; viremic controllers.


Figures

FIG 1
FIG 1
Participant (p1 to p4) sampling timeline and reservoir quantification. The timeline is depicted as years since ART initiation. Shading represents ART. Inverted black triangles denote the clinically estimated date of infection. Colored circles denote pre-ART plasma samples from which HIV RNA sequences were isolated. Red diamonds denote cell samples on ART from which proviral sequences were isolated. Black diamonds denote proviral quantification dates using the intact proviral DNA assay (IPDA). IPDA results are shown as pie charts, where the pie size denotes the total proviral burden and the colored slices denote intact and defective HIV genome proportions (actual values shown in Table 1).
FIG 2
FIG 2
Between-host HIV phylogeny. Shown is the maximum likelihood phylogeny inferred from 546 plasma HIV RNA sequences (circles) and 267 proviral DNA sequences (open diamonds) isolated from participants. Numbers on internal branches indicate bootstrap values supporting within-host monophyletic clades. The scale is in estimated substitutions per nucleotide site. The phylogeny is midpoint rooted. The black dot represents the HIV-1 subtype B reference strain HXB2.
FIG 3
FIG 3
Participant 1. (A) Clinical history and sampling timeline. Throughout all figures, circles denote plasma HIV RNA sampling and diamonds denote HIV DNA sampling. Shading represents ART. Undetectable viral loads are shown as 20 (1.3 log10) copies/ml. (B) Maximum likelihood within-host phylogeny and corresponding amino acid highlighter plot. In the phylogeny, colored circles denote distinct pre-ART plasma HIV RNA sequences and red diamonds indicate distinct proviral sequences sampled during suppressive ART. Sequences that were recovered repeatedly are shown as open gray circles (for plasma HIV RNA) and diamonds (for proviruses) adjacent to the relevant tip. The root represents the inferred most recent common ancestor of the data set, representing the phylogenetically inferred transmitted founder virus event. The highlighter plot is ordered according to the phylogeny and depicts amino acid sequences. The top sequence serves as the reference, where colored ticks in sequences beneath it denote nonsynonymous substitutions with respect to the reference. (C) HIV sequence divergence-versus-time plot. The blue dashed line represents the linear model relating the root-to-tip distances of distinct pre-ART plasma HIV RNA sequences (colored circles) to their sampling times. This model is then used to convert the root-to-tip distances of distinct proviral sequences sampled during ART (red diamonds) to their original integration dates. The slope of the regression line, which represents the inferred within-host evolutionary rate (ER) in estimated substitutions per nucleotide site per day, is shown at the bottom right. Faint gray lines denote the ancestral relationships between HIV sequences. (D) Integration date point estimates (and 95% confidence intervals) for distinct proviral sequences recovered from this participant.
FIG 4
FIG 4
Participant 2. The panels are as described in the legend to Fig. 3.
FIG 5
FIG 5
Participant 3. The panels are as described in the legend to Fig. 3.
FIG 6
FIG 6
Participant 4. The panels are as described in the legend of Fig. 3, with the following additions. In panels B and D, the red diamond indicated by an asterisk represents the genomically intact HIV sequence isolated from the 2013 sample. In panel C, two linear models were fit to the data, encompassing the viremic control (blue dashed line) and the “loss-of-control” (green dashed line) periods. Corresponding evolutionary rates are shown in the bottom right corner in matching colors. The regression for the control period was performed using plasma time points 14 June 2006 (i.e., 2006-06-14) to 25 September 2008, while post-control period regression was performed using plasma time points 29 January 2009 to 14 May 2012.
FIG 7
FIG 7
Correlates of proviral burden and diversity. (A) Relationship between pre-ART plasma HIV RNA diversity and proviral diversity on ART. (B) Relationship between total area under the plasma viral load curve pre-ART, measured in log10 viremia copy days, and total proviral burden during ART. (C) Relationship between total area under the plasma viral load curve pre-ART and overall proviral diversity during ART, where the latter is measured as average patristic (tip-to-tip phylogenetic) distance between all distinct proviral sequences recovered from each participant.
FIG 8
FIG 8
Pre-ART proviral decay rate estimates. (A to D) Viral load histories, with engrafted “peak viremia” kinetics from the literature (shown as black diamonds), for participants 1 (A), 2 (B), 3 (C, where the dotted line represents the viremic episode after ART that serves as the reference point in this analysis), and 4 (D). (E to H) Phylogenetically determined proviral ages and predicted proviral age distributions under different rates of proviral decay for participants 1 to 4. Blue histograms denote the proportion of each participant’s distinct proviruses that dated to each year prior to ART initiation, data that are derived from the integration date point estimates in Fig. 3D, 4D, 5D, and 6D, respectively. The yellow line indicates each participant’s model-predicted proviral deposition. The gray and dashed black lines predict what the proviral age distributions would be at the time of sampling had proviral decay subsequently occurred under half-lives of 140 or 44 months following deposition (these half-lives represent published on-ART estimates of total DNA [26] and replication-competent reservoir [25] decay, respectively). The green line represents the model-predicted proviral age distributions under the pre-ART proviral decay rate that best fit each participant's observed data. (I to L) Best-fit half-lives estimated directly from each participant’s observed proviral age distributions using a Poisson generalized linear model (red line) along with 95% confidence intervals (dotted lines).

References

    1. Finzi D, Hermankova M, Pierson T, Carruth LM, Buck C, Chaisson RE, Quinn TC, Chadwick K, Margolick J, Brookmeyer R, Gallant J, Markowitz M, Ho DD, Richman DD, Siliciano RF. 1997. Identification of a reservoir for HIV-1 in patients on highly active antiretroviral therapy. Science 278:1295–1300. doi: 10.1126/science.278.5341.1295. - DOI - PubMed
    1. Wong JK, Hezareh M, Günthard HF, Havlir DV, Ignacio CC, Spina CA, Richman DD. 1997. Recovery of replication-competent HIV despite prolonged suppression of plasma viremia. Science 278:1291–1295. doi: 10.1126/science.278.5341.1291. - DOI - PubMed
    1. Chun TW, Stuyver L, Mizell SB, Ehler LA, Mican JAM, Baseler M, Lloyd AL, Nowak MA, Fauci AS. 1997. Presence of an inducible HIV-1 latent reservoir during highly active antiretroviral therapy. Proc Natl Acad Sci USA 94:13193–13197. doi: 10.1073/pnas.94.24.13193. - DOI - PMC - PubMed
    1. Sanchez G, Xu X, Chermann JC, Hirsch I. 1997. Accumulation of defective viral genomes in peripheral blood mononuclear cells of human immunodeficiency virus type 1-infected individuals. J Virol 71:2233–2240. doi: 10.1128/JVI.71.3.2233-2240.1997. - DOI - PMC - PubMed
    1. Bruner KM, Murray AJ, Pollack RA, Soliman MG, Laskey SB, Capoferri AA, Lai J, Strain MC, Lada SM, Hoh R, Ho YC, Richman DD, Deeks SG, Siliciano JD, Siliciano RF. 2016. Defective proviruses rapidly accumulate during acute HIV-1 infection. Nat Med 22:1043–1049. doi: 10.1038/nm.4156. - DOI - PMC - PubMed

Publication types

MeSH terms

Substances