. 2021 Nov 15;40(1):362.
doi: 10.1186/s13046-021-02166-4.

Alternative splicing of NF-YA promotes prostate cancer aggressiveness and represents a new molecular marker for clinical stratification of patients

Affiliations

Alternative splicing of NF-YA promotes prostate cancer aggressiveness and represents a new molecular marker for clinical stratification of patients

Silvia Belluti et al. J Exp Clin Cancer Res. .

Abstract

Background: Approaches based on expression signatures of prostate cancer (PCa) have been proposed to predict patient outcomes and response to treatments. The transcription factor NF-Y participates to the progression from benign epithelium to both localized and metastatic PCa and is associated with aggressive transcriptional profile. The gene encoding for NF-YA, the DNA-binding subunit of NF-Y, produces two alternatively spliced transcripts, NF-YAs and NF-YAl. Bioinformatic analyses pointed at NF-YA splicing as a key transcriptional signature to discriminate between different tumor molecular subtypes. In this study, we aimed to determine the pathophysiological role of NF-YA splice variants in PCa and their association with aggressive subtypes.

Methods: Data on the expression of NF-YA isoforms were extracted from the TCGA (The Cancer Genome Atlas) database of tumor prostate tissues and validated in prostate cell lines. Lentiviral transduction and CRISPR-Cas9 technology allowed the modulation of the expression of NF-YA splice variants in PCa cells. We characterized 3D cell cultures through in vitro assays and RNA-seq profilings. We used the rank-rank hypergeometric overlap approach to identify concordant/discordant gene expression signatures of NF-YAs/NF-YAl-overexpressing cells and human PCa patients. We performed in vivo studies in SHO-SCID mice to determine pathological and molecular phenotypes of NF-YAs/NF-YAl xenograft tumors.

Results: NF-YA depletion affects the tumorigenic potential of PCa cells in vitro and in vivo. Elevated NF-YAs levels are associated to aggressive PCa specimens, defined by Gleason Score and TNM classification. NF-YAl overexpression increases cell motility, while NF-YAs enhances cell proliferation in PCa 3D spheroids and xenograft tumors. The transcriptome of NF-YAs-spheroids has an extensive overlap with localized and metastatic human PCa signatures. According to PCa PAM50 classification, NF-YAs transcript levels are higher in LumB, characterized by poor prognosis compared to LumA and basal subtypes. A significant decrease in NF-YAs/NF-YAl ratio distinguishes PCa circulating tumor cells from cancer cells in metastatic sites, consistently with pro-migratory function of NF-YAl. Stratification of patients based on NF-YAs expression is predictive of clinical outcome.

Conclusions: Altogether, our results indicate that the modulation of NF-YA isoforms affects prostate pathophysiological processes and contributes to cancer-relevant phenotype, in vitro and in vivo. Evaluation of NF-YA splicing may represent a new molecular strategy for risk assessment of PCa patients.

Keywords: Alternative splicing; Genome editing; NF-Y; Prostate cancer; Transcriptome profiling.


Conflict of interest statement

The authors declare that they have no competing interests.

Figures
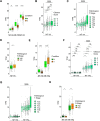
Fig. 1
Fig. 1
Expression of NF-YA and its splice variants in prostate cancer samples. A Expression levels of NF-YA, NF-YB and NF-YC measured as transcripts per million (TPM) in prostate adenocarcinoma (PRAD) patients compared to normal ones. N = normal samples, T = tumor samples. Wilcoxon test T vs N: **p < 0.01, ****p < 0.0001. B Transcript levels (TPM) of NF-Y subunits in PRAD patients according to Gleason Score stratification. Wilcoxon test T vs N: **p < 0.01, ***p < 0.001, ****p < 0.0001, ns, not significant. Jonckheere trend test: §§§§ p < 0.0001. C NF-YA expression levels in PRAD samples stratified by pathological T stage. Jonckheere trend test: §§§§ p < 0.0001. D NF-YA expression levels in PRAD samples stratified by pathological N stage. Wilcoxon test N1 vs N0: **p < 0.01. E Transcript levels (TPM) of NF-YAs and NF-YAl in PRAD patients compared to normal ones from TCGA data set. N = normal samples, T = tumor samples. Wilcoxon test T vs N: ****p < 0.0001. F TPM of NF-YAs and NF-YAl in PRAD patients according to Gleason Score stratification. Wilcoxon test: **p < 0.01, ***p < 0.001, ****p < 0.0001, ns, not significant. Jonckheere trend test: §§§§ p < 0.0001. G Transcript levels (TPM) of NF-YA isoforms according to pathological T stage. Jonckheere trend test: §§§§ p < 0.0001. H Transcript levels (TPM) of NF-YA isoforms according to pathological N stage. Wilcoxon test N1 vs N0: *p < 0.05, **p < 0.01
Fig. 2
Fig. 2
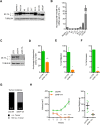
Effects of NF-YA inactivation in tumor prostate cells. A Expression of NF-YA splice variants in prostate epithelial normal and cancer cells by western blot analysis of total cellular extracts. N1 = primary healthy epithelial prostate cells, C10, C17 = primary BPH prostate cells. RWPE-1, PNT1A = normal immortalized cell lines. PC3, DU145, LNCaP = PCa cell lines. Tubulin was used as loading control of total cellular extracts. B Expression levels of NF-YA isoforms quantified by RT-qPCR and reported as fold change of NF-YAs/NF-YAl mRNA ratio vs N1 cell line levels, arbitrarily set at 1. Rpl21 was used as reference gene. C Western blot analysis of NF-YA expression in PC3 cells untreated (CTR) or infected with scramble (shCTR) or NF-YA-targeting shRNA (shNF-YA). Tubulin was used as loading control. D Colony number of shCTR and shNF-YA cells cultured in anchorage-independent growth conditions. Data represent mean ± SEM (unpaired t-test: ***p < 0.001, n = 4). E Percentage of cell migration of shCTR and shNF-YA cells measured by transwell assay. Data represent mean ± SEM (unpaired t-test: *p < 0.05, n = 3). F Percentage of cell invasion of shCTR and shNF-YA cells measured by transwell assay. Data represent mean ± SEM (unpaired t-test: **p < 0.01, n = 2). G Representation of tumor incidence after 5 weeks from s.c. injection of shCTR and shNF-YA PC3 cells into SCID Hairless Outbred (SHO®) mice. H (Left panel) Volumes (mm3) of shCTR and shNF-YA xenografted tumors at the indicated time points. Data represent mean ± SEM (two-way ANOVA with Holm-Sidak’s test: **p < 0.01, ***p < 0.001, ****p < 0.0001, n = 7). (Right panel) Tumor weight of xenografted tumors isolated after 5 weeks from cell inoculation. Data represent mean ± SEM (unpaired t-test: **p < 0.01)
Fig. 3
Fig. 3
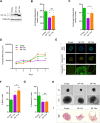
Effects of stable overexpression of NF-YA isoforms in tumor cells. A Western blot analysis of total extracts from PC3 cells stably infected with Empty, NF-YAl and NF-YAs lentiviral particles. Tubulin was used as loading control. B, C Colony number of Empty, NF-YAl and NF-YAs stable cell lines in anchorage-dependent and anchorage-independent conditions, respectively. Data represent mean ± SEM (one-way ANOVA with Fisher’s LSD test: *p < 0.05, **p < 0.01, ***p < 0.001, ns, not significant, n = 6). D Size of Empty, NF-YAl and NF-YAs MTSs calculated as projected area at the indicated time points. Data represent mean ± SEM (two-way ANOVA with Holm-Sidak’s test: *p < 0.05, **p < 0.01, ***p < 0.001, ****p < 0.0001, n between 8 and 68 spheroids from 8 independent experiments). E Representative immunofluorescence images of Ki67/Dapi and Calcein-AM/PI staining performed on Empty, NF-YAl and NF-YAs MTSs. Scale bar = 500 μm. The lower panel shows details of Calcein-AM/PI staining by confocal microscopy. Scale bar = 50 μm. F Percentage of BrdU-positive cells following incubation of MTSs with 20 μM BrdU for 16 h. Data represent mean ± SEM (one-way ANOVA with Fisher’s LSD test: **p < 0.01, ****p < 0.0001, n = 4). G Percentage of AnnexinV-positive cells identified by cytofluorimetric analysis of MTSs. Data represent mean ± SEM (one-way ANOVA with Fisher’s LSD test: *p < 0.05, ns, not significant, n = 3). H Optical microscopy images representative of Empty, NF-YAs and NF-YAl MTSs morphology. Scale bar 4X = 500 μm, scale bar 10X = 250 μm (I) Representative images of H&E stained sections of MTSs. Scale bar = 100 μm
Fig. 4
Fig. 4
Effect of CRISPR-Cas9-mediated knock out of endogenous NF-YA in NF-YAs-overexpressing PC3 cells. A Western blot analysis of NF-YA isoforms in total cellular extracts from NF-YAs and NF-YAs-only (CRISPR-Cas9 edited clone #11 and #23) PC3 cells. Tubulin was used as loading control. B Optical microscopy images representative of the morphology of two different NF-YAs clones cultured as MTSs. The arrows indicate structures budding from MTS core. Scale bar 4X = 500 μm, scale bar 10X = 250 μm. C Rate of growth (%) of xenograft tumors measured for 5 consecutive weeks from s.c. inoculation of NF-YAs and NF-YAs-only edited PC3 cells into SCID Hairless Outbred (SHO®) mice. Data represent mean ± SEM (Two-way ANOVA with Holm-Sidak’s test n = 4)
Fig. 5
Fig. 5
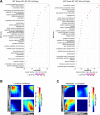
Expression profiles of NF-YAs and NF-YAl overexpressing MTSs. A Top 25 enriched GO terms of up regulated genes in NF-YAl (left panel) and NF-YAs (right panel) overexpressing PC3 MTSs versus Empty control ones. The size of each circle represents the number of genes included in each GO term and the color of the circle indicates the adjusted p value. B Comparison of gene expression signatures between NF-YAl vs NF-YAs MTSs and Localized vs Benign prostate tissues [38] by RRHO analysis. C Comparison of gene expression signatures between NF-YAl vs NF-YAs MTSs and Metastatic vs Localized prostate tissues [38] by RRHO analysis
Fig. 6
Fig. 6
Effect of NF-YAs and NF-YAl overexpression on tumor growth and cell dissemination in vivo. A Weight (mg) of xenograft tumors at 5 weeks from s.c. inoculation of Empty, NF-YAl and NF-YAs PC3 cells into SCID Hairless Outbred (SHO®) mice. Data represent mean ± SEM (one-way ANOVA with Fisher’s LSD test: *p < 0.05, ns, not significant, n = 8). B Rate of growth (%) of Empty, NF-YAs and NF-YAl xenograft tumors at the indicated time points following s.c. inoculation of transduced PC3 cells. Data represent mean ± SEM (two-way ANOVA with Holm-Sidak’s test: *p < 0.05, n = 8) C Representative H&E-stained FFPE sections of 5 weeks xenograft tumors at low (left panel) and high (middle panel) magnifications. Immunohistochemical detection of Ki67 in xenograft tumors (right panel). D Western blot of total extracts from PC3 tumor xenograft with the indicated antibodies. Tubulin has been used as loading control. Quantification of band intensities was performed with ImageJ software and relative phospho-AKT(Ser473) levels are indicated, after normalization to Tubulin and AKT expression (E) Representation of the incidence of spontaneous cell dissemination to lung tissue in mice after 5 weeks from s.c. injection of Empty, NF-YAl, NF-YAs PC3 cells. Cell dissemination has been identified by the detection of human genomic DNA through Alu-qPCR in mouse lung tissues. F RT-qPCR analysis of the indicated transcripts in xenograft tumors harvested following 5 weeks from s.c. injection. Rps20 and b-Actin were used as reference genes and normalized mRNA levels are reported as fold change vs Empty biological group, arbitrarily set at 1. Data represent mean ± SEM (one-way ANOVA with Tukey’s test: *p < 0.05, **p < 0.01, ***p < 0.001, ****p < 0.0001, n = 5)
Fig. 7
Fig. 7
Activity of NF-YAs and NF-YAl overexpression in cell migration and 3D invasion. A Percentage of cell migration of Empty, NF-YAl and NF-YAs cells measured by transwell assay. Data represent mean ± SEM (one-way ANOVA with Fisher’s LSD test: *p < 0.05, **p < 0.01, ns, not significant, n = 4). B Confluent cells were seeded into Ibidi wound-healing chambers and images were acquired at 0, 18, 20 and 22 h after the culture chambers were removed. (Left panel) Quantification of migration is shown as residual wound area compared to the initial gap, arbitrarily set at 100%. Data represent mean ± SEM (two-way ANOVA with Fisher’s LSD test: *p < 0.05, **p < 0.01 n = 6). (Right panel) Representative images of cell migration in wound-healing assay. C (Left panel) Representative phase contrast microscopy images of Empty, NF-YAl and NF-YAs MTSs. Spheroid invasion of MTSs included for 7 days in 1 mg/ml growth factors-enriched Matrigel. (Right panel) The histogram represents the percentage of invasion area vs total area of MTSs. Data represent mean ± SEM (unpaired t-test: *p < 0.05, ns, not significant, n = 3). D Phase contrast microscopy images representative of the invasive behaviour of MTSs when embedded into 5 mg/ml growth factors-reduced Matrigel surrounded by high-serum culture medium as chemoattractant for 7 and 11 days (n = 4). Scale bar = 500 μm
Fig. 8
Fig. 8
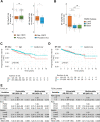
Lower NF-YAs/NF-YAl ratio distinguishes PCa CTCs from Met. CRPC and high NF-YAs predicts the clinical outcome of PCa patients. A Left panel: Ratio of NF-YAs/NF-YAl transcripts in Met. CRPC samples compared to TCGA primary adenocarcinomas. Box plots were obtained following log2 transformation of TPM and z-score normalization of processed datasets. Right panel: Ratio of NF-YA isoforms in Met. CRPC samples compared to PCa CTCs. Raw counts of both datasets were normalized with DESeq2 algorithm and the Variance Stabilizing Transformed (vst) is represented. B Log transformed TPM and z-score normalization of NF-YAs/NF-YAl ratio in PRAD samples, stratified according to PAM50 subtypes. Wilcoxon test: ****p < 0.0001, ns, not significant. C, D Kaplan-Meier analysis of progression-free interval (PFI) in TCGA PRAD patients stratified according to high and medium/low expression of NF-YAs and NF-YAl, respectively. P values for the log rank tests are indicated. E Univariable and multivariable hazard ratio (HR) analyses of different prognostic parameters and NF-YAs expression in PRAD patients. Left table includes all patients; right table includes a subset of patients who have received either radiotherapy or chemotherapy
Fig. 9
Fig. 9
Schematic representation of biological properties of PCa cells overexpressing different NF-YA isoforms. Localized and metastatic PCa tumors are mainly composed by cells expressing high levels of NF-YAs (NF-YAshigh), which is fundamental for their survival and enhances proliferation and interaction with ECM. Both NF-YAshigh and NF-YAlhigh cells are able to invade ECM with different patterns and form distant lung metastases. NF-YAlhigh cells have increased migration ability, consistently with higher NF-YAl expression in PCa CTCs. Stratification of patients based on NF-YAshigh signature predicts poor clinical outcome. Created with BioRender.com (Biorender, RRID:SCR_018361)

Similar articles

Cited by

References

    1. Shoag J, Barbieri CE. Clinical variability and molecular heterogeneity in prostate cancer. Asian J Androl. 2016;18:543. - PMC - PubMed
    1. Xin L. Cells of origin for cancer: an updated view from prostate cancer. Oncogene. 2013;32:3655–3663. - PMC - PubMed
    1. Wang ZA, Mitrofanova A, Bergren SK, Abate-Shen C, Cardiff RD, Califano A, et al. Lineage analysis of basal epithelial cells reveals their unexpected plasticity and supports a cell-of-origin model for prostate cancer heterogeneity. Nat Cell Biol. 2013;15:274–283. - PMC - PubMed
    1. Sboner A, Demichelis F, Calza S, Pawitan Y, Setlur SR, Hoshida Y, et al. Molecular sampling of prostate cancer: a dilemma for predicting disease progression. BMC Med Genomics. 2010;3:8. - PMC - PubMed
    1. Zhao SG, Chang SL, Erho N, Yu M, Lehrer J, Alshalalfa M, et al. Associations of luminal and basal subtyping of prostate Cancer with prognosis and response to androgen deprivation therapy. JAMA Oncol. 2017;3:1663–1672. - PMC - PubMed