. 2022 Mar 1;20(3):485-497.
doi: 10.1158/1541-7786.MCR-21-0266.

Mechanical Stress Signaling in Pancreatic Cancer Cells Triggers p38 MAPK- and JNK-Dependent Cytoskeleton Remodeling and Promotes Cell Migration via Rac1/cdc42/Myosin II

Affiliations

Mechanical Stress Signaling in Pancreatic Cancer Cells Triggers p38 MAPK- and JNK-Dependent Cytoskeleton Remodeling and Promotes Cell Migration via Rac1/cdc42/Myosin II

Maria Kalli et al. Mol Cancer Res. .

Abstract

Advanced or metastatic pancreatic cancer is highly resistant to existing therapies, and new treatments are urgently needed to improve patient outcomes. Current studies focus on alternative treatment approaches that target the abnormal microenvironment of pancreatic tumors and the resulting elevated mechanical stress in the tumor interior. Nevertheless, the underlying mechanisms by which mechanical stress regulates pancreatic cancer metastatic potential remain elusive. Herein, we used a proteomic assay to profile mechanical stress-induced signaling cascades that drive the motility of pancreatic cancer cells. Proteomic analysis, together with selective protein inhibition and siRNA treatments, revealed that mechanical stress enhances cell migration through activation of the p38 MAPK/HSP27 and JNK/c-Jun signaling axes, and activation of the actin cytoskeleton remodelers: Rac1, cdc42, and myosin II. In addition, mechanical stress upregulated transcription factors associated with epithelial-to-mesenchymal transition and stimulated the formation of stress fibers and filopodia. p38 MAPK and JNK inhibition resulted in lower cell proliferation and more effectively blocked cell migration under mechanical stress compared with control conditions. The enhanced tumor cell motility under mechanical stress was potently reduced by cdc42 and Rac1 silencing with no effects on proliferation. Our results highlight the importance of targeting aberrant signaling in cancer cells that have adapted to mechanical stress in the tumor microenvironment, as a novel approach to effectively limit pancreatic cancer cell migration.

Implications: Our findings highlight that mechanical stress activated the p38 MAPK and JNK signaling axis and stimulated pancreatic cancer cell migration via upregulation of the actin cytoskeleton remodelers cdc42 and Rac1.


Figures

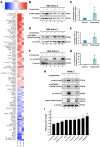
Figure 1. A RPPA was performed to reveal the mechanical stress–induced mechanism in pancreatic cancer cell lines. A, Heatmap showing proteins exhibiting the largest fold increases (red) or decreases (blue) in compressed MIA PaCa-2 pancreatic cancer cells relative to the control cells. Proteins were analyzed by RPPA and paired t test was performed to identify proteins that are differently expressed between compressed and uncompressed cells. Values in the heatmap represent the log2 ratio (compressed/uncompressed) of expression level for each protein in each condition (three biological replicates representing three columns). Differences were considered significant with P < 0.05. Immunoblotting was performed using the same lysates (MIA PaCa-2) that were analyzed by RPPA, to validate the activation of phospho-HSP27 (S82; B and C), phospho-p38 MAPK (Thr180/Tyr182; D and E) and phospho-c-Jun (S73; F and G) Graphs represent the average fold change ±SE in each lane normalized to β-tubulin between control and compressed cells as quantified by ImageJ (three biological replicates; n = 3). Asterisks (*) indicate statistically significant changes between control and compressed cells (P < 0.05 in Student t test). H, Validation of phospho-HSP27, -p38 MAPK, -c-Jun and -JNK, in PANC-1 pancreatic cancer cells from two biological replicates. Numbers in gray font indicate the fold change between control and compressed cells as quantified by ImageJ. I, Pathway score analysis was calculated as the average sum of expression level of all members in each pathway, and then normalized to the uncompressed expression level. The protein members of the pathways are shown in Supplementary Fig. S2.
Figure 1.
A RPPA was performed to reveal the mechanical stress–induced mechanism in pancreatic cancer cell lines. A, Heatmap showing proteins exhibiting the largest fold increases (red) or decreases (blue) in compressed MIA PaCa-2 pancreatic cancer cells relative to the control cells. Proteins were analyzed by RPPA and paired t test was performed to identify proteins that are differently expressed between compressed and uncompressed cells. Values in the heatmap represent the log2 ratio (compressed/uncompressed) of expression level for each protein in each condition (three biological replicates representing three columns). Differences were considered significant with P < 0.05. Immunoblotting was performed using the same lysates (MIA PaCa-2) that were analyzed by RPPA, to validate the activation of phospho-HSP27 (S82; B and C), phospho-p38 MAPK (Thr180/Tyr182; D and E) and phospho-c-Jun (S73; F and G) Graphs represent the average fold change ±SE in each lane normalized to β-tubulin between control and compressed cells as quantified by ImageJ (three biological replicates; n = 3). Asterisks (*) indicate statistically significant changes between control and compressed cells (P < 0.05 in Student t test). H, Validation of phospho-HSP27, -p38 MAPK, -c-Jun and -JNK, in PANC-1 pancreatic cancer cells from two biological replicates. Numbers in gray font indicate the fold change between control and compressed cells as quantified by ImageJ. I, Pathway score analysis was calculated as the average sum of expression level of all members in each pathway, and then normalized to the uncompressed expression level. The protein members of the pathways are shown in Supplementary Fig. S2.
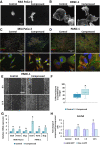
Figure 2. Mechanical stress induces cytoskeletal changes and cell contraction in pancreatic cancer cells promoting their migratory ability. Phalloidin staining was performed to monitor cell shape, actin cytoskeleton organization of control (0 mmHg) and compressed (4 mmHg) MIA PaCa-2 (A) and PANC-1 (B) cancer cells. Scale bar 0.1 mm. Staining for phospho-myosin II (Ser1943) was performed to show actomyosin contractility in control and compressed MIA PaCa-2 (C) and PANC-1 (D) cells. Scale bar 1 and 0.1 mm, respectively. E, PANC-1 cells were compressed by 4.0 mmHg in low-serum medium and then subjected to a scratch wound healing assay for 16 hours. Control cells (0 mmHg) were compressed by an agarose cushion only. Scale bar: 0.2 mm. F, Graph showing the average percentage of wound closure ±SE as quantified using ImageJ software. Statistically significant difference in wound closure of compressed PANC-1 cells compared with control cells is indicated with an asterisk (*) (n ≥ 10; three biological replicates; P < 0.05 in Student t test). G, Relative mRNA expression of EMT markers Snail, Twist, Slug as quantified by qPCR in MIA PaCa-2 and PANC-1 cells. Each bar indicates the mean fold change ±SE of three independent experiments (n = 9). Asterisk (*) indicates a statistically significant difference (P < 0.05 in Student t test). H, G-LISA was performed to analyze activation of cdc42 and Rac-1 small GTPases in compressed (4.0 mmHg) cells at different timepoints. Assay was performed in triplicates and graphs represent the average fold change ±SE of each protein in compressed relative to uncompressed (control) cells. Asterisk (*) indicates a statistically significant difference (P < 0.05 in Student t test).
Figure 2.
Mechanical stress induces cytoskeletal changes and cell contraction in pancreatic cancer cells promoting their migratory ability. Phalloidin staining was performed to monitor cell shape, actin cytoskeleton organization of control (0 mmHg) and compressed (4 mmHg) MIA PaCa-2 (A) and PANC-1 (B) cancer cells. Scale bar 0.1 mm. Staining for phospho-myosin II (Ser1943) was performed to show actomyosin contractility in control and compressed MIA PaCa-2 (C) and PANC-1 (D) cells. Scale bar 1 and 0.1 mm, respectively. E, PANC-1 cells were compressed by 4.0 mmHg in low-serum medium and then subjected to a scratch wound healing assay for 16 hours. Control cells (0 mmHg) were compressed by an agarose cushion only. Scale bar: 0.2 mm. F, Graph showing the average percentage of wound closure ±SE as quantified using ImageJ software. Statistically significant difference in wound closure of compressed PANC-1 cells compared with control cells is indicated with an asterisk (*) (n ≥ 10; three biological replicates; P < 0.05 in Student t test). G, Relative mRNA expression of EMT markers Snail, Twist, Slug as quantified by qPCR in MIA PaCa-2 and PANC-1 cells. Each bar indicates the mean fold change ±SE of three independent experiments (n = 9). Asterisk (*) indicates a statistically significant difference (P < 0.05 in Student t test). H, G-LISA was performed to analyze activation of cdc42 and Rac-1 small GTPases in compressed (4.0 mmHg) cells at different timepoints. Assay was performed in triplicates and graphs represent the average fold change ±SE of each protein in compressed relative to uncompressed (control) cells. Asterisk (*) indicates a statistically significant difference (P < 0.05 in Student t test).
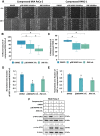
Figure 3. The p38 MAPK/HSP27 and JNK/c-Jun pathways are necessary for both proliferation and migration of pancreatic cancer cells under mechanical stress. A, MIA PaCa-2 and PANC-1 cells were pretreated with 15 μmol/L p38 MAPK inhibitor (SB202190), JNK inhibitor (SP600125) or equal volume of DMSO and subjected to a scratch wound healing assay under 4.0 mmHg of compression. Pictures from at least four different fields were taken from three biological replicates. Scale bar: 0.2 mm. White dashed line shows the difference in wound closure between 0 and 16 hours. Graph showing the average ±SE percentage wound closure of compressed MIA PaCa-2 (B) and PANC-1 (C) treated with DMSO or inhibitors from three biological replicates (n ≥ 12). Asterisk (*) indicates a statistically significant difference (P < 0.05 in one-way ANOVA analysis). Graph showing the average Ki67 area fraction in compressed MIA PaCa-2 (D) and PANC-1 (E) cells treated with DMSO, p38 MAPK or JNK inhibitor from at least 10 different fields/condition from two biological replicates as quantified automatically using an in-house code in MATLAB. Asterisk (*) indicates a statistically significant difference in Student t test (P < 0.05). F, Representative immunoblotting showing phosphorylated HSP27 (Ser 82) and c-Jun (S73) in control and compressed MIA PaCa-2 cells treated with 15 μmol/L of each inhibitor or equal volume of DMSO. Antibody against β-actin was used as a loading control. Quantification of each antibody compared with loading control was quantified by ImageJ and it is indicated by numbers in gray font.
Figure 3.
The p38 MAPK/HSP27 and JNK/c-Jun pathways are necessary for both proliferation and migration of pancreatic cancer cells under mechanical stress. A, MIA PaCa-2 and PANC-1 cells were pretreated with 15 μmol/L p38 MAPK inhibitor (SB202190), JNK inhibitor (SP600125) or equal volume of DMSO and subjected to a scratch wound healing assay under 4.0 mmHg of compression. Pictures from at least four different fields were taken from three biological replicates. Scale bar: 0.2 mm. White dashed line shows the difference in wound closure between 0 and 16 hours. Graph showing the average ±SE percentage wound closure of compressed MIA PaCa-2 (B) and PANC-1 (C) treated with DMSO or inhibitors from three biological replicates (n ≥ 12). Asterisk (*) indicates a statistically significant difference (P < 0.05 in one-way ANOVA analysis). Graph showing the average Ki67 area fraction in compressed MIA PaCa-2 (D) and PANC-1 (E) cells treated with DMSO, p38 MAPK or JNK inhibitor from at least 10 different fields/condition from two biological replicates as quantified automatically using an in-house code in MATLAB. Asterisk (*) indicates a statistically significant difference in Student t test (P < 0.05). F, Representative immunoblotting showing phosphorylated HSP27 (Ser 82) and c-Jun (S73) in control and compressed MIA PaCa-2 cells treated with 15 μmol/L of each inhibitor or equal volume of DMSO. Antibody against β-actin was used as a loading control. Quantification of each antibody compared with loading control was quantified by ImageJ and it is indicated by numbers in gray font.
Figure 4. p38 MAPK/HSP27 and JNK/c-Jun signaling axes promote mechanical stress–induced actin cytoskeleton remodeling. Representative images of phalloidin staining in control and compressed MIA PaCa-2 (A) and PANC-1 (B) cells treated with DMSO, p38 MAPK or JNK inhibitors. In each panel, the first row shows representative images at the end of the wound healing assay, while the second row shows cells at the wound edge in higher magnification (scale bar: 1 and 0.1 mm, respectively). Yellow arrows indicate cell protrusions (lamellipodia, filopodia) that are necessary for cell migration.
Figure 4.
p38 MAPK/HSP27 and JNK/c-Jun signaling axes promote mechanical stress–induced actin cytoskeleton remodeling. Representative images of phalloidin staining in control and compressed MIA PaCa-2 (A) and PANC-1 (B) cells treated with DMSO, p38 MAPK or JNK inhibitors. In each panel, the first row shows representative images at the end of the wound healing assay, while the second row shows cells at the wound edge in higher magnification (scale bar: 1 and 0.1 mm, respectively). Yellow arrows indicate cell protrusions (lamellipodia, filopodia) that are necessary for cell migration.
Figure 5. The Rac-1- and cdc42-small GTPases mediate mechanical stress-induced pancreatic cancer cell migration. Rac1 (A) and cdc42 (B) mRNA expression was quantified by qPCR in both MIA PaCa-2 and PANC-1. Each bar indicates the mean fold change ±SE of two biological replicates (n = 6). Asterisk (*) indicates a statistically significant difference (P < 0.05 in one-way ANOVA analysis). C, MIA PaCa-2 and PANC-1 pancreatic cancer cells were treated with siRNA against RAC1 (siRac1) or CDC42 (sicdc42) and then subjected to a scratch wound healing assay for 16 hours under 0.0 or 4.0 mmHg of compression in 2% FBS containing DMEM. Control cells were treated with stealth siRNA (siCTRL). Scale bar: 0.1 mm. Graphs showing the percentage ±SE wound closure of MIA PaCa-2 (D) and PANC-1 (E) as quantified using ImageJ software. Statistically significant difference in wound closure of compressed siRac1- or sicdc42-treated cells compared to siCTRL-treated cells is indicated with an asterisk (*) (two biological replicates; n ≥ 6; P < 0.05 in one-way ANOVA analysis). F, Graph showing the average ±SE Ki67 area fraction in MIA PaCa-2 and PANC-1 control and compressed cells treated with siCTRL, siRac1, or sicdc42 from at least five different fields/condition from two biological replicates as quantified automatically using an in-house code in MATLAB. No statistically significant changes were observed.
Figure 5.
The Rac-1- and cdc42-small GTPases mediate mechanical stress-induced pancreatic cancer cell migration. Rac1 (A) and cdc42 (B) mRNA expression was quantified by qPCR in both MIA PaCa-2 and PANC-1. Each bar indicates the mean fold change ±SE of two biological replicates (n = 6). Asterisk (*) indicates a statistically significant difference (P < 0.05 in one-way ANOVA analysis). C, MIA PaCa-2 and PANC-1 pancreatic cancer cells were treated with siRNA against RAC1 (siRac1) or CDC42 (sicdc42) and then subjected to a scratch wound healing assay for 16 hours under 0.0 or 4.0 mmHg of compression in 2% FBS containing DMEM. Control cells were treated with stealth siRNA (siCTRL). Scale bar: 0.1 mm. Graphs showing the percentage ±SE wound closure of MIA PaCa-2 (D) and PANC-1 (E) as quantified using ImageJ software. Statistically significant difference in wound closure of compressed siRac1- or sicdc42-treated cells compared to siCTRL-treated cells is indicated with an asterisk (*) (two biological replicates; n ≥ 6; P < 0.05 in one-way ANOVA analysis). F, Graph showing the average ±SE Ki67 area fraction in MIA PaCa-2 and PANC-1 control and compressed cells treated with siCTRL, siRac1, or sicdc42 from at least five different fields/condition from two biological replicates as quantified automatically using an in-house code in MATLAB. No statistically significant changes were observed.
Figure 6. Rac-1 and cdc42 small GTPases mediate actin cytoskeleton remodeling and contractility to induce cell migration under stress. Representative images of phalloidin and phospho-myosin II (p-myosin II) staining in compressed MIA PaCa-2 (A) and PANC-1 (B) cells treated with siCTRL, siRac-1, or sicdc42. In each panel, the first row shows representative images at the end of the wound healing assay, while the second row shows cells at the wound edge in higher magnification (scale bar: 1 and 0.1 mm, respectively). Yellow arrows indicate cell protrusions that are necessary for cell migration. Third row shows p-myosin II and phalloidin staining in high magnification (scale bar: 0.1 mm).
Figure 6.
Rac-1 and cdc42 small GTPases mediate actin cytoskeleton remodeling and contractility to induce cell migration under stress. Representative images of phalloidin and phospho-myosin II (p-myosin II) staining in compressed MIA PaCa-2 (A) and PANC-1 (B) cells treated with siCTRL, siRac-1, or sicdc42. In each panel, the first row shows representative images at the end of the wound healing assay, while the second row shows cells at the wound edge in higher magnification (scale bar: 1 and 0.1 mm, respectively). Yellow arrows indicate cell protrusions that are necessary for cell migration. Third row shows p-myosin II and phalloidin staining in high magnification (scale bar: 0.1 mm).
Figure 7. Mechanical stress–induced signaling pathway adaptation that drives pancreatic cancer cell migration. Mechanical compressive forces are generated during pancreatic tumor growth in the restricted environment of a host tissue. These forces transmit the respective solid stress intracellularly, by activation of JNK/c-Jun, p38 MAPK/HSP27, Rac1, and cdc42. The activation of p38 MAPK/HSP27 and JNK/c-Jun signaling axes can regulate cell adaptation to the new environment by driving their proliferation under compression. Rac1 and cdc42 are activated in turn, and can regulate actin cytoskeleton remodeling for the formation of cell protrusions changing progressively the cell shape. Rac1 and cdc42 also mediate actomyosin contractility, to eventually promote pancreatic cancer cell migration under compression.
Figure 7.
Mechanical stress–induced signaling pathway adaptation that drives pancreatic cancer cell migration. Mechanical compressive forces are generated during pancreatic tumor growth in the restricted environment of a host tissue. These forces transmit the respective solid stress intracellularly, by activation of JNK/c-Jun, p38 MAPK/HSP27, Rac1, and cdc42. The activation of p38 MAPK/HSP27 and JNK/c-Jun signaling axes can regulate cell adaptation to the new environment by driving their proliferation under compression. Rac1 and cdc42 are activated in turn, and can regulate actin cytoskeleton remodeling for the formation of cell protrusions changing progressively the cell shape. Rac1 and cdc42 also mediate actomyosin contractility, to eventually promote pancreatic cancer cell migration under compression.

References

    1. Aier I, Semwal R, Sharma A, Varadwaj PK. A systematic assessment of statistics, risk factors, and underlying features involved in pancreatic cancer. Cancer Epidemiol 2019;58:104–10. - PubMed
    1. Stylianopoulos T, Munn LL, Jain RK. Reengineering the physical microenvironment of tumors to improve drug delivery and efficacy: from mathematical modeling to bench to bedside. Trends Cancer 2018;4:292–319. - PMC - PubMed
    1. Nia HT, Munn LL, Jain RK. Physical traits of cancer. Science 2020;370:eaaz0868. - PMC - PubMed
    1. Provenzano PP, Cuevas C, Chang AE, Goel VK, Von Hoff DD, Hingorani SR. Enzymatic targeting of the stroma ablates physical barriers to treatment of pancreatic ductal adenocarcinoma. Cancer Cell 2012;21:418–29. - PMC - PubMed
    1. Chauhan VP, Martin JD, Liu H, Lacorre DA, Jain SR, Kozin SV, et al. . Angiotensin inhibition enhances drug delivery and potentiates chemotherapy by decompressing tumour blood vessels. Nat Commun 2013;4:2516. - PMC - PubMed

Publication types

MeSH terms