. 2022 Mar 1;20(3):456-467.
doi: 10.1158/1541-7786.MCR-21-0366.

Chk1 Inhibition Potently Blocks STAT3 Tyrosine705 Phosphorylation, DNA-Binding Activity, and Activation of Downstream Targets in Human Multiple Myeloma Cells

Affiliations

Chk1 Inhibition Potently Blocks STAT3 Tyrosine705 Phosphorylation, DNA-Binding Activity, and Activation of Downstream Targets in Human Multiple Myeloma Cells

Liang Zhou et al. Mol Cancer Res. .

Abstract

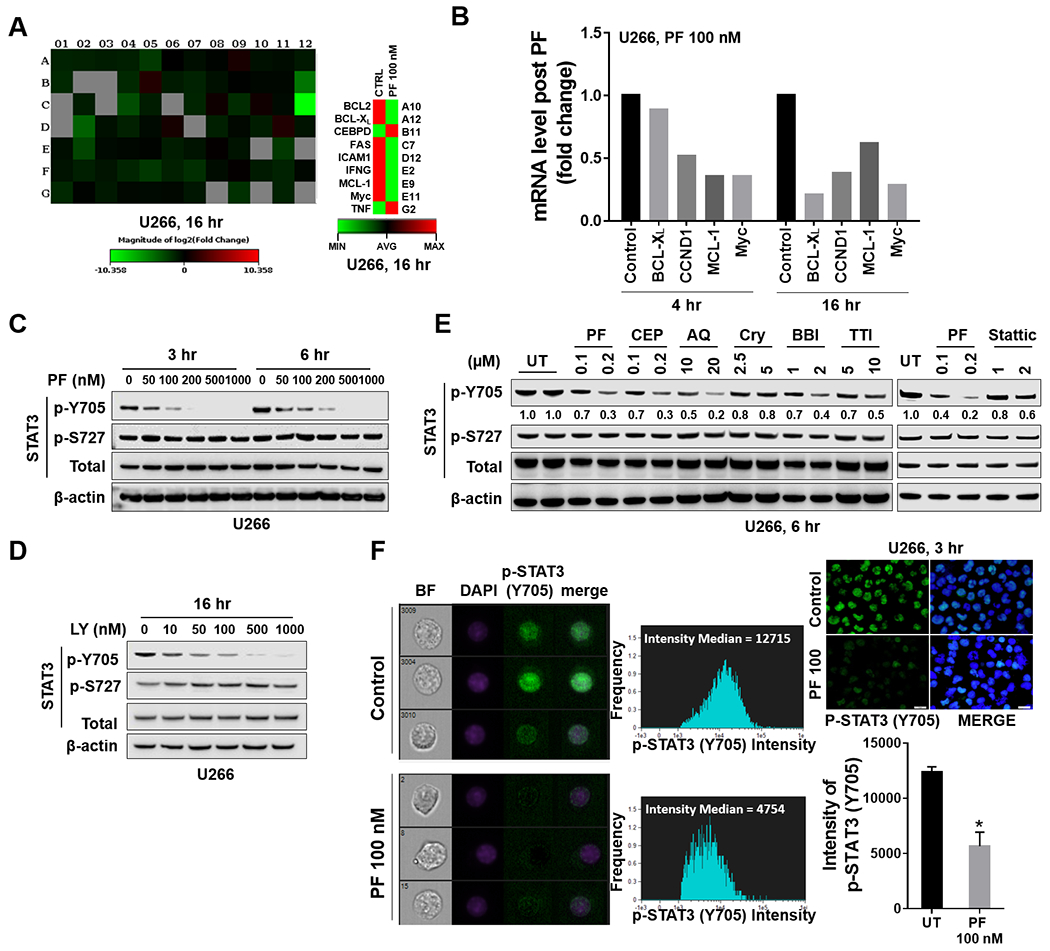
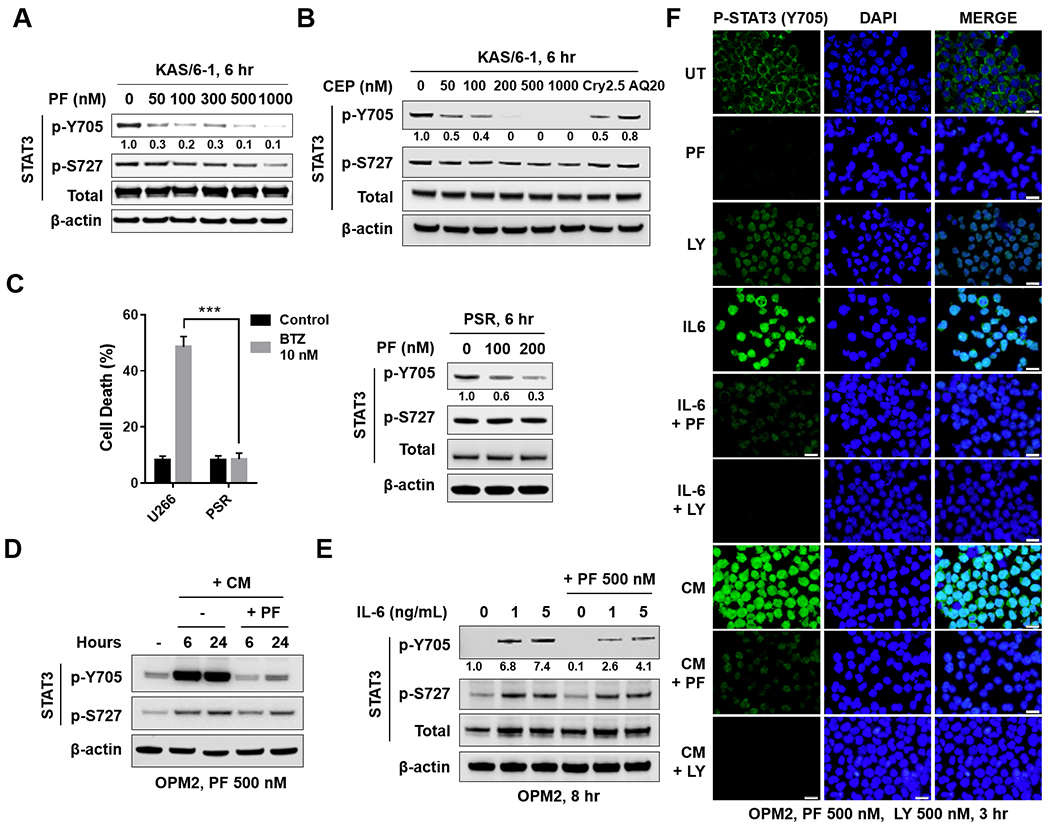
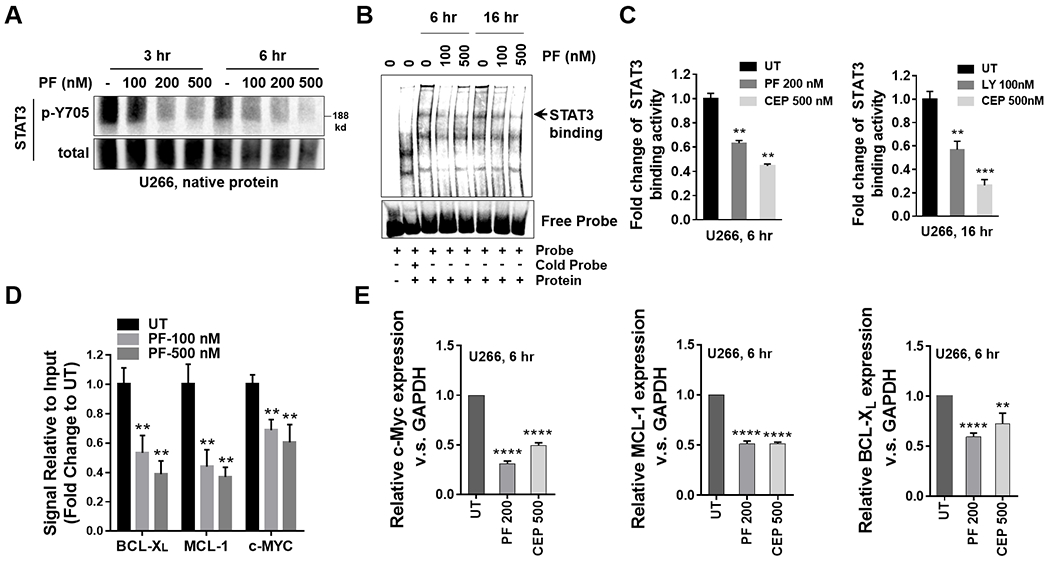
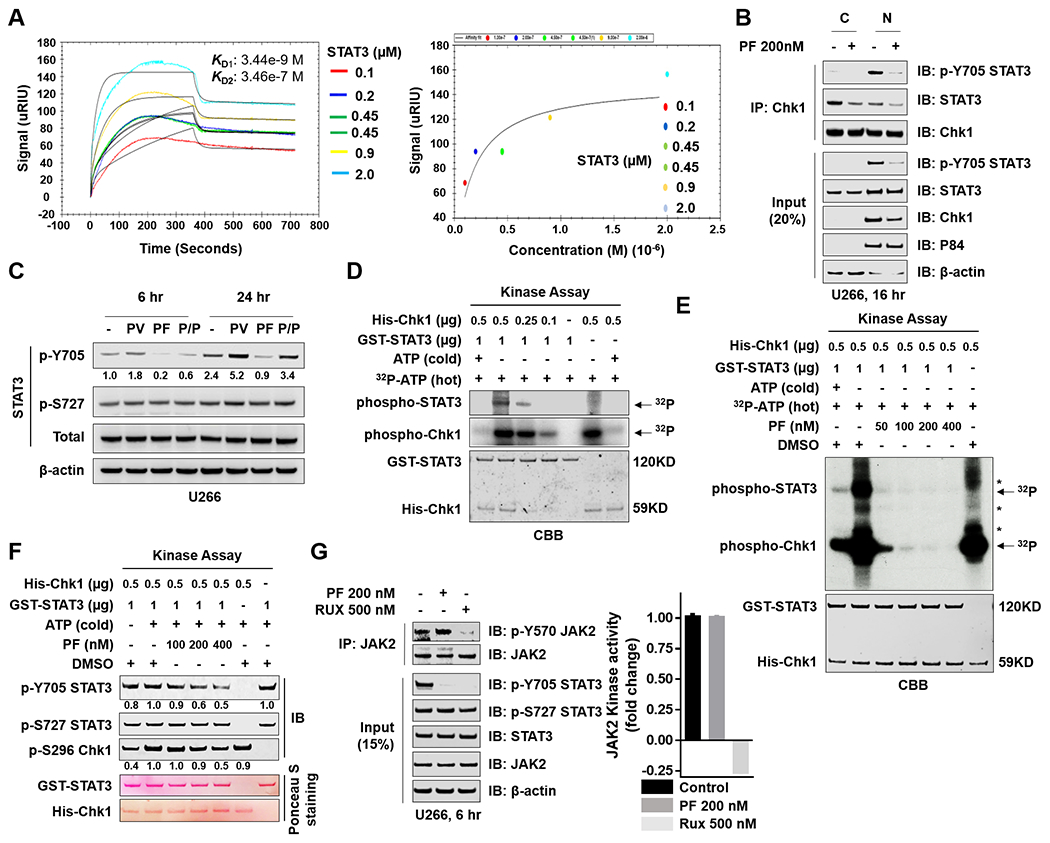
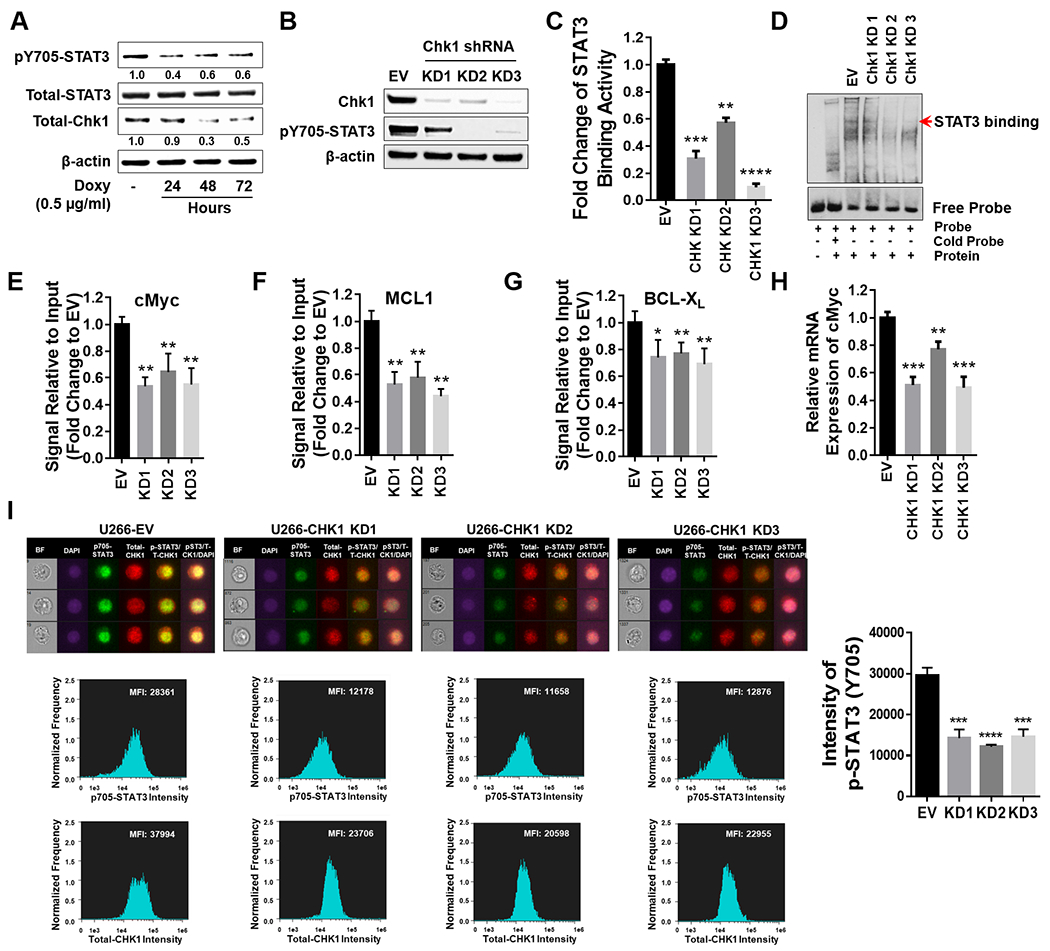
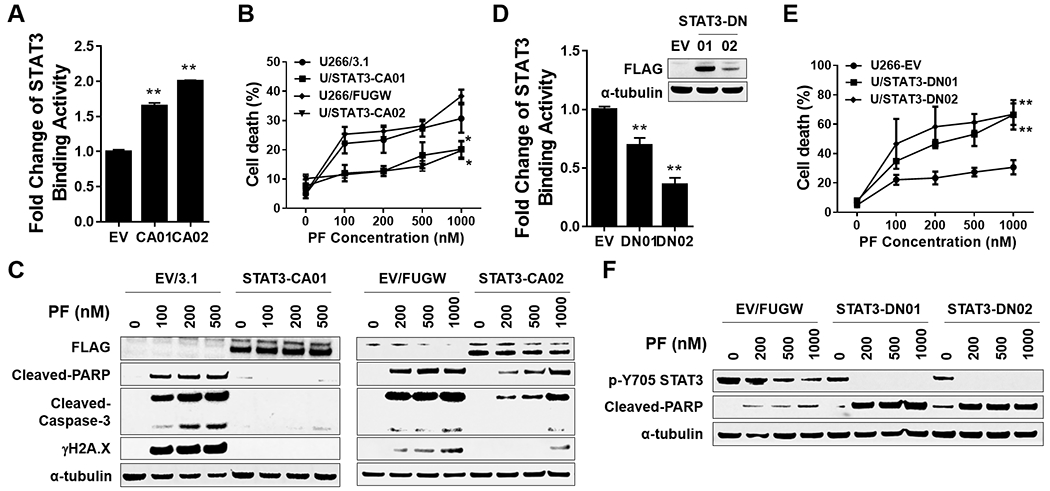
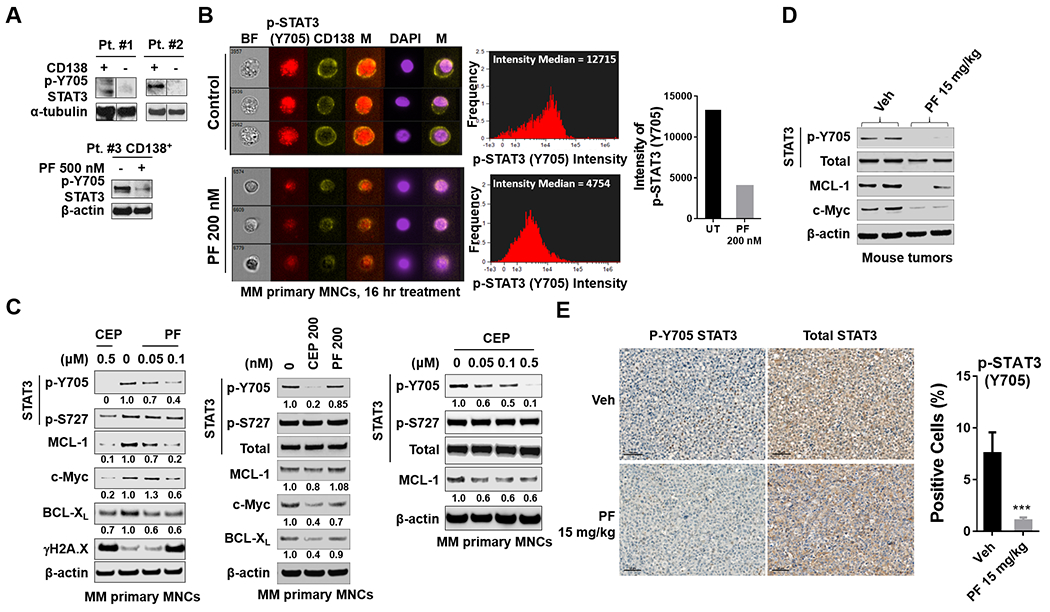
The relationship between the checkpoint kinase Chk1 and the STAT3 pathway was examined in multiple myeloma cells. Gene expression profiling of U266 cells exposed to low (nmol/L) Chk1 inhibitor [PF-477736 (PF)] concentrations revealed STAT3 pathway-related gene downregulation (e.g., BCL-XL, MCL-1, c-Myc), findings confirmed by RT-PCR. This was associated with marked inhibition of STAT3 Tyr705 (but not Ser727) phosphorylation, dimerization, nuclear localization, DNA binding, STAT3 promoter activity by chromatin immunoprecipitation assay, and downregulation of STAT-3-dependent proteins. Similar findings were obtained in other multiple myeloma cells and with alternative Chk1 inhibitors (e.g., prexasertib, CEP3891). While PF did not reduce GP130 expression or modify SOCS or PRL-3 phosphorylation, the phosphatase inhibitor pervanadate antagonized PF-mediated Tyr705 dephosphorylation. Significantly, PF attenuated Chk1-mediated STAT3 phosphorylation in in vitro assays. Surface plasmon resonance analysis suggested Chk1/STAT3 interactions and PF reduced Chk1/STAT3 co-immunoprecipitation. Chk1 CRISPR knockout or short hairpin RNA knockdown cells also displayed STAT3 inactivation and STAT3-dependent protein downregulation. Constitutively active STAT3 diminished PF-mediated STAT3 inactivation and downregulate STAT3-dependent proteins while significantly reducing PF-induced DNA damage (γH2A.X formation) and apoptosis. Exposure of cells with low basal phospho-STAT3 expression to IL6 or human stromal cell conditioned medium activated STAT3, an event attenuated by Chk1 inhibitors. PF also inactivated STAT3 in primary human CD138+ multiple myeloma cells and tumors extracted from an NSG multiple myeloma xenograft model while inhibiting tumor growth.

Implications: These findings identify a heretofore unrecognized link between the Chk1 and STAT3 pathways and suggest that Chk1 pathway inhibitors warrant attention as novel and potent candidate STAT3 antagonists in myeloma.


Conflict of interest statement

Conflict-of-interest disclosure: The authors declare no potential conflicts of interest.

Figures

Figure 1.
Figure 1.. Chk1 inhibitors block tyrosine phosphorylation of STAT3 (p-Y705) in MM cells.
A, U266 cells were treated with 100 nM PF-477736 (PF) for 4 and 16 hr. Gene expression profiling was performed using Human Signal Transduction PathwayFinder R2 PCR Array (84 genes). The heat map shows absolute mRNA copy numbers, which were calculated from PCR cycle thresholds (Ct) and generated from Qiagen RT² Profiler PCR Data Analysis Web page. B, Fold-change of STAT3 pathway-related genes upon PF stimulation in U266 cells as compared to untreated controls. C-E, Western blot analysis of p-Y705 STAT3, p-S727 STAT3, and total STAT3 in U266 cells treated with indicated doses of PF, LY, or other STAT3 inhibitors. CEP = CEP-3891; AQ = Atovaquone; Cry = Cryptotanshinone; BBI = BBI-608; TTI = TTI-101. β-actin controls were assayed to ensure equivalent loading and transfer. Images were quantified and analyzed by using ImageJ software. Data was normalized by the ratio of indicated protein and β-actin vs control. F, Untreated and treated (PF 100 nM, 3 hr) cells were stained with p-Y705 STAT3 and DAPI, and then visualized by fluorescence microscope and by ImageStream and representative cells are shown (BF = brightfield; Scale bar = 20 μM). Histogram of p-Y705 STAT3 intensity and fold change were shown. Representative data of at least three replicates. *, P < 0.05.
Figure 2.
Figure 2.. Chk1 inhibitors block tyrosine phosphorylation of STAT3 (p-Y705) in multiple MM cell lines.
A, B and C (right panel), KAS/6–1, or PSR cells were treated with the indicated concentrations of PF, CEP, Cry 2.5 μM, or AQ 20 μM for 6 hr. Western blot analysis of p-Y705 STAT3, p-S727 STAT3, and total STAT3 were performed. β-actin controls were assayed to ensure equivalent loading and transfer. C (left panel), Bortezomib-resistant PS-R cells were exposed (24 hr) to 10 nM bortezomib (BTZ), followed by flow cytometry to monitor the percentage of apoptotic (7-AAD+) cells. Values represent the means ± S.D. for three experiments performed in triplicate. *** = P < 0.001. D, OPM2 cells were pretreated with HS-5 conditioned medium for 16 hr, and then treated with 500 nM PF for 6 and 24 hr. Western blot analysis was carried out to as mentioned in A-C. E, OPM2 cells were pretreated with IL-6 (1 ng/ml or 5 ng/ml) for 15 min, and then treated with 500 nM PF for 8 hr. Western blot analysis was carried out as in A-C. Images were quantified and analyzed using ImageJ software. Data was normalized by the ratio of indicated protein/β-actin vs control. F, OMP2 cells were pretreated with CM or IL-6 as in D and E, Immunofluorescence staining was performed to monitor p-Y705 STAT3.
Figure 3.
Figure 3.. Chk1 inhibitors disrupt STAT3 activation in MM cells.
A, U266 cells were treated with indicated concentrations of PF for 3 and 6 hr. Native nuclear protein extracts were prepared and were separated on a 6% native PAGE gel. Electrophoresis was performed in the absence of SDS. Proteins were immunoblotted with p-Y705 STAT3 and total STAT3. Total STAT3 served as a loading control. B, Nuclear extracts from U266 cells treated with the indicated concentrations of PF for 6 and 16 hr were subjected to EMSA analysis. C, U266 cells were treated with indicated concentrations of PF, CEP or LY for 6 and 16 hr. A STAT3 DNA-binding ELISA assay was employed to evaluate the ability of STAT3 in cellular nuclear extracts to bind to its corresponding consensus sequence that had been immobilized on a 96-well plate. D, U266 cells were treated with the indicated concentrations of PF for 16 hr. ChIP experiments were performed to detect the presence of STAT3 at the promotors of the BCL-XL, MCL-1, and c-Myc genes after treatment with PF. Data was normalized with non-immune IgG (negative control) and STAT3 antibody, and the relative fold- change (vs untreated controls; UT) is presented. E, Relative mRNA expressions of c-Myc, MCL-1 and BCL-XL were determined by real-time reverse transcription-PCR analysis. GAPDH served as an internal control. **, P < 0.01; ***, P < 0.001; ****, P < 0.0001.
Figure 4.
Figure 4.. Mechanisms of STAT3 inhibition by Chk1 inhibitors.
A, Surface plasmon resonance (SPR) analyses is shown to monitor Chk1 and STAT3 interactions. SPR characterizes the interaction between Chk1 and STAT3 by detecting the soluble STAT3 (analyte) binding to immobilized Chk1 on a carboxymethyl dextran sensor chip. The STAT3 was injected over the Chk1 surface in a series of concentrations (0.1, 0.2, 0.45, 0.45, 0.9 and 2 μM that are labeled with different colors). (Left panel) The data were fit to a 1:2 binding model in a kinetic analysis evaluation graph; the black lines show the global 1:2 model fit). The binding constants are reported in the insets. (Right panel) Equilibrium fit plot displays the STAT3 concentration-response curve between Chk1 and STAT3 obtained from affinity SPR analysis. B, U266 cells were treated with 200 nM PF for 16 hr. Nuclear and cytoplasmic extracts were collected for performance of co-immunoprecipitation assays. Chk1 pull-down proteins were immunoblotted with p-Y705 STAT3, total STAT3, and Chk1. Total lysates were immunoblotted for p-Y705 STAT3, total STAT3, and Chk1. P84 and β-actin were used as controls for nuclear and cytoplasmic protein levels, respectively. C, U266 cells were treated with 100 μM pervanadate (PV) and 50 nM PF for 6 hr and 24 hr. Western blot analysis of p-Y705 STAT3, p-S727 STAT3, and total STAT3 were then performed. β-actin controls were assayed to ensure equivalent loading and transfer. D and E, Purified His-Chk1 was used in an in vitro kinase assay using purified GST-STAT3 as substrate. Kinase assay products were separated by SDS-PAGE (6–12%) and visualized by autoradiography (P) and Coomassie-brilliant blue (CBB). F, A kinase assay was performed as in E in the presence or absence of cold ATP, and kinase assay products were transferred to a nitrocellulose membrane and immunoblotted with p-Y705 STAT3, p-S727 STAT3, and p-S296 Chk1. Ponceau S stained blots served as loading controls. G, (left panel) U266 cells were treated with 200 nM PF or 500 nM Rux (ruxolitinib) for 6 hr, followed by lysis and immunoprecipitation with JAK2. The blots were probed for p-Y570 JAK2 and total JAK2. Total lysates were immunoblotted for p-Y705 STAT3, p-S727 STAT3, total STAT3, and JAK2. β-actin was used as a loading control. (right panel) A non-radioactive JAK2 kinase assay was performed. The graph was generated by expressing fold-phosphorylation changes (normalized to control). Images were quantified and analyzed using ImageJ software. Data were normalized by the ratio of the indicated protein/β-actin or Ponceau S staining vs control.
Figure 5.
Figure 5.. Chk1 plays a critical role in regulating STAT3 signaling.
A, U266 cells were transfected with a Tet-on inducible Chk1 shRNA. Doxycycline (0.5 μg/ml) induced cells were collected at 24, 48 and 72 hr. Total lysates were immunoblotted for p-Y705 STAT3, total STAT3, and Chk1. β-actin was used as a loading control. Images were quantified and analyzed using ImageJ software. Data was normalized by the ratio of indicated protein/β-actin vs control. B-I, U266 cells were transfected with a lentivirus harboring Chk1 shRNA. B, Western blot analyses of Chk1 and p-Y705 STAT3 were performed. β-actin controls were assayed to ensure equivalent loading and transfer. C, The STAT3 DNA-binding ELISA was used to evaluate the ability of STAT3 in cellular nuclear extracts to bind to its corresponding consensus sequence immobilized on a 96-well plate. D, EMSA assay of DNA-binding activity of STAT3 in Chk1 knock-down cells. E-G, ChIP experiments were performed to detect the presence of STAT3 at the promotor regions of BCL-XL, MCL-1, and c-Myc in Chk1 knockdown cells. Data was normalized with non-immune IgG (negative control) and STAT3 antibody, and relative fold change (vs UT) is presented. H, Relative mRNA expression of c-Myc was determined by real-time reverse transcription-PCR analysis. GAPDH served as an internal control. Relative fold change (vs EV) is presented. I, Cells were stained with p-Y705 STAT3, Chk1 and DAPI, and then visualized by fluorescence microscope and by ImageStream and representative cells are shown (BF = brightfield). Histograms of p-Y705 STAT3 intensity and fold change are shown. Representative data for at least three replicates. *, P < 0.05; ** = P < 0.01; ***, P < 0.001; **** = P < 0.0001.
Figure 6.
Figure 6.. STAT3 inhibition by Chk1 inhibitor through a STAT3-dependent manner.
A-C, U266 were transfected with pcDNA3.1 (empty vector) or pcDNA-STAT3 CA (FLAG fusion), and STAT3-CA01 was selected. STAT3-CA02 was selected in U266 cells infected with a lentivirus harboring STAT3 CA (FLAG fusion). A, The STAT3 DNA-binding ELISA was used to evaluate STAT3 activity in STAT3-CA cell. B, cells were exposed (24 hr) to indicated concentrations of PF, followed by flow cytometry to monitor the percentage of apoptotic (7-AAD+) cells. Values represent the means ± S.D. for three experiments performed in triplicate. * = P < 0.05; ** = P < 0.01. C, Western blot analysis of FLAG, cleaved-PARP, cleaved-Caspase-3, and γH2A.X was performed. α-tubulin controls were assayed to ensure equivalent loading and transfer. D-F, U266 cells infected with a lentivirus harboring STAT3 DN (FLAG fusion). STAT3-CA01/02 were selected. Assays were performed as in A-C, ** = P < 0.01.
Figure 7.
Figure 7.. Chk1 inhibitors decrease p-Y705 STAT3 expression in primary human MM cells ex-vivo and in mice in vivo.
A (upper panel), CD138+ and CD138 MNCs were isolated from MM primary samples. (lower panel) Isolated CD138+ MNCs (mononuclear cells) were treated with 500 nM PF for 16 hr. Western blot analysis of p-Y705 STAT3 and p-S727 STAT3 were then performed. α-tubulin and β-actin controls were assayed to ensure equivalent loading and transfer. A black border indicates that the blots were cut and spliced from the same membrane and after the same exposure interval. B, Isolated MM primary mononuclear cells (MNCs) were stained with p-Y705 STAT3, CD138 and DAPI, and then visualized by fluorescence microscopy and by ImageStream; representative cells are shown (BF = brightfield). Histograms of p-Y705 STAT3 intensity and fold change are shown. C, Isolated MM primary MNCs were treated with indicated doses of PF and CEP for 16 hr. Western blot analysis of p-Y705 STAT3, p-S727 STAT3, STAT3, c-Myc, MCL-1, BCL-XL, and γH2A.X were performed. β-actin controls were assayed to ensure equivalent loading and transfer. D, NOD-SCID IL2Rgammanull mice were subcutaneously injected with 5×10⁶ U266 cells into the flank. When tumors grew to 10 mm (length), PF (15 mg/kg) was administrated (i.p.) for 3 days. Control animals received equal volumes of vehicle. Western blot analysis was performed to monitor the indicated candidate pharmacodynamic markers, identified from in vitro experiments, in tumors excised from representative mice. Images were quantified and analyzed using ImageJ software. Data was normalized by determining the ratio of the indicated protein/β-actin vs control. E, Tumor sections from vehicle and PF-treated mice were stained with p-Y705 STAT3 antibody. Sections were visualized and images captured usingVectra® Polaris Imaging System (Akoya Biosciences) research microscope and quantified using the Polaris software program. Scale bar = 50 μm. ***= P < 0.001.

Similar articles

Cited by

References

    1. Siveen KS, Sikka S, Surana R, et al. Targeting the STAT3 signaling pathway in cancer: role of synthetic and natural inhibitors. Biochim Biophys Acta. 2014;1845(2):136–154. - PubMed
    1. Chong PSY, Chng WJ, de Mel S. STAT3: A Promising Therapeutic Target in Multiple Myeloma. Cancers (Basel). 2019;11(5). - PMC - PubMed
    1. Jung SH, Ahn SY, Choi HW, et al. STAT3 expression is associated with poor survival in non-elderly adult patients with newly diagnosed multiple myeloma. Blood Res. 2017;52(4):293–299. - PMC - PubMed
    1. Johnson DE, O’Keefe RA, Grandis JR. Targeting the IL-6/JAK/STAT3 signalling axis in cancer. Nat Rev Clin Oncol. 2018;15(4):234–248. - PMC - PubMed
    1. Aziz MH, Hafeez BB, Sand JM, et al. Protein kinase Cvarepsilon mediates Stat3Ser727 phosphorylation, Stat3-regulated gene expression, and cell invasion in various human cancer cell lines through integration with MAPK cascade (RAF-1, MEK1/2, and ERK1/2). Oncogene. 2010;29(21):3100–3109. - PMC - PubMed

Publication types