. 2021 Nov 23;118(47):e2109671118.
doi: 10.1073/pnas.2109671118.

Staphylococcal ClpXP protease targets the cellular antioxidant system to eliminate fitness-compromised cells in stationary phase

Affiliations

Staphylococcal ClpXP protease targets the cellular antioxidant system to eliminate fitness-compromised cells in stationary phase

Abdulelah A Alqarzaee et al. Proc Natl Acad Sci U S A. .

Abstract

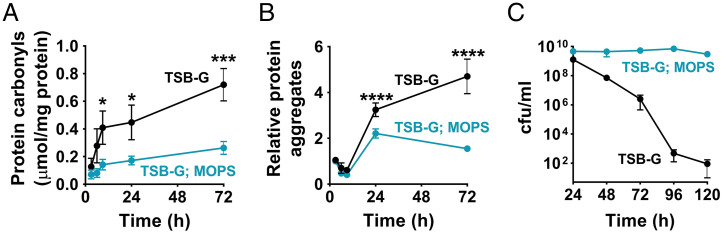
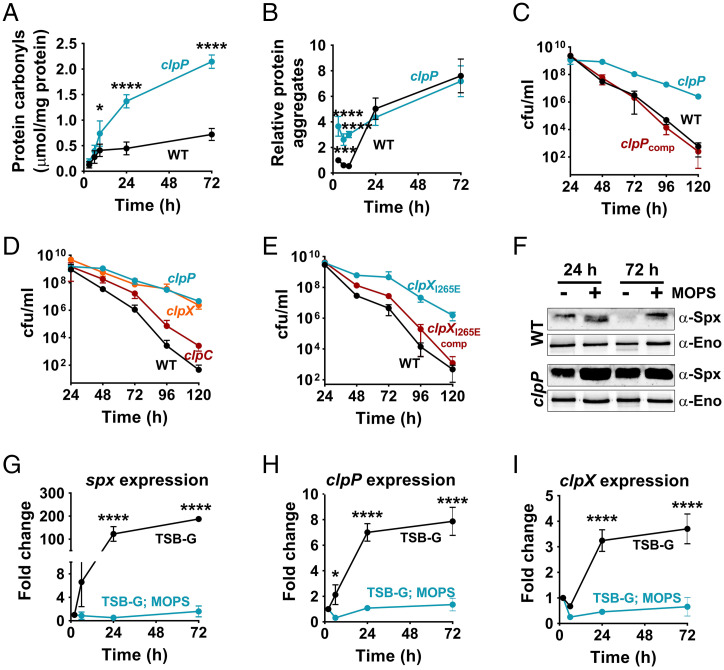
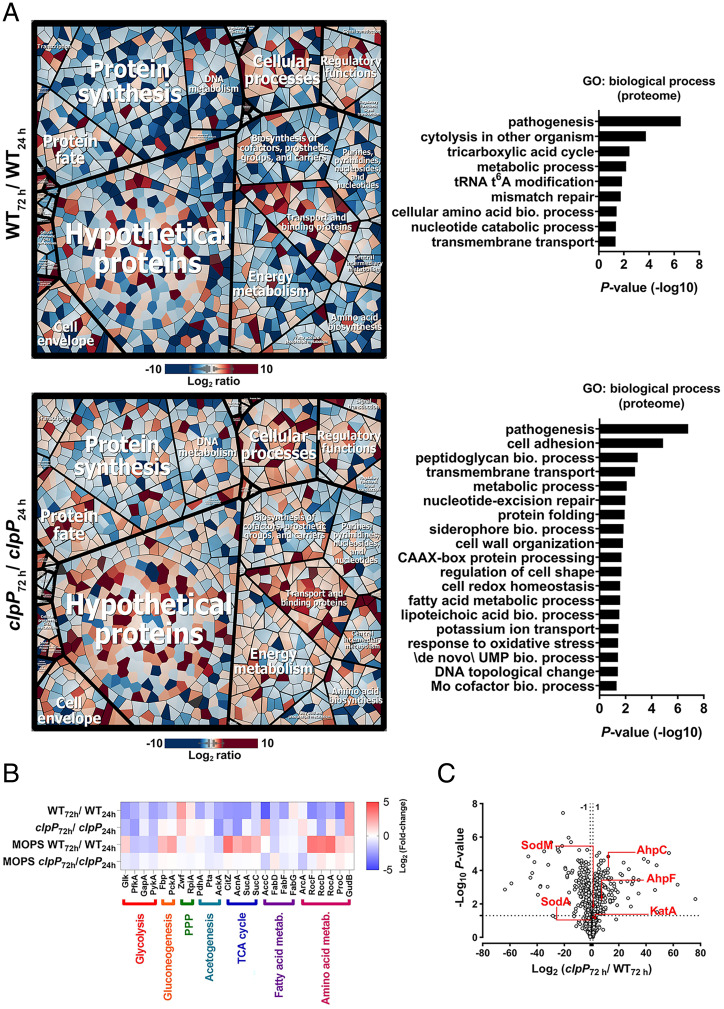
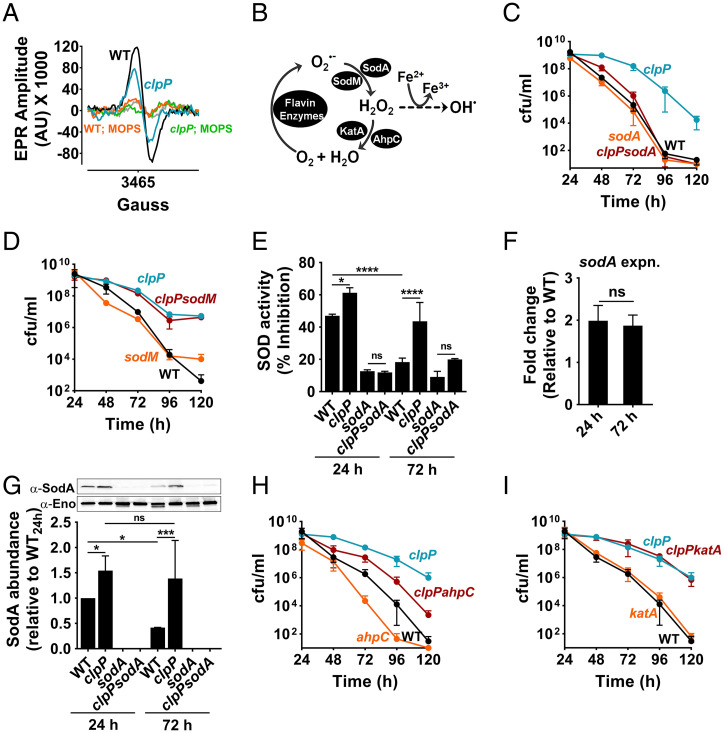
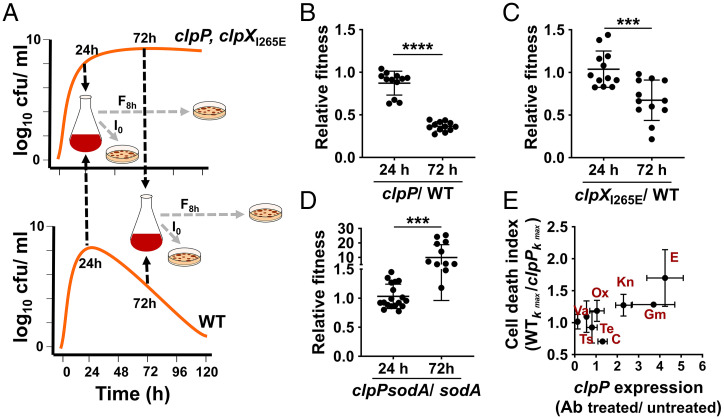
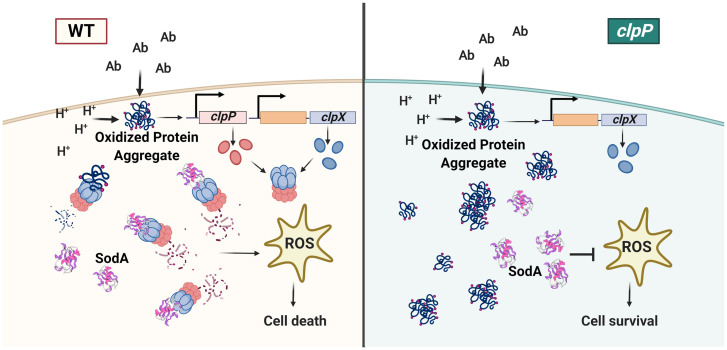
The transition from growth to stationary phase is a natural response of bacteria to starvation and stress. When stress is alleviated and more favorable growth conditions return, bacteria resume proliferation without a significant loss in fitness. Although specific adaptations that enhance the persistence and survival of bacteria in stationary phase have been identified, mechanisms that help maintain the competitive fitness potential of nondividing bacterial populations have remained obscure. Here, we demonstrate that staphylococci that enter stationary phase following growth in media supplemented with excess glucose, undergo regulated cell death to maintain the competitive fitness potential of the population. Upon a decrease in extracellular pH, the acetate generated as a byproduct of glucose metabolism induces cytoplasmic acidification and extensive protein damage in nondividing cells. Although cell death ensues, it does not occur as a passive consequence of protein damage. Instead, we demonstrate that the expression and activity of the ClpXP protease is induced, resulting in the degeneration of cellular antioxidant capacity and, ultimately, cell death. Under these conditions, inactivation of either clpX or clpP resulted in the extended survival of unfit cells in stationary phase, but at the cost of maintaining population fitness. Finally, we show that cell death from antibiotics that interfere with bacterial protein synthesis can also be partly ascribed to the corresponding increase in clpP expression and activity. The functional conservation of ClpP in eukaryotes and bacteria suggests that ClpP-dependent cell death and fitness maintenance may be a widespread phenomenon in these domains of life.

Keywords: Staphylococcus aureus; clpP; clpX; sodA; stationary phase fitness.


Conflict of interest statement

The authors declare no competing interest.

Figures

Fig. 1.
Fig. 1.
Acetic acid induces protein damage and cell death. The toxicity of acetic acid on staphylococci was distinguished by growth in MOPS-buffered (100 mM, pH 7.3) and -unbuffered TSB. Acetic acid remains as charged anions in MOPS-buffered media, preventing its entry into cells. (A) Protein oxidation was determined at different stages of growth by measuring the carbonyl content of intracellular proteins (n = 3, mean ± SD). (B) Protein aggregates were measured as the detergent-insoluble fraction of total intracellular proteins. The aggregates were isolated, resolved by SDS/PAGE, and quantified using ImageJ software. The fold-differences in protein aggregate levels are relative to those observed at 3 h of growth (midexponential phase). (n = 5, mean ± SD) (C) Cell viability in stationary phase was determined by enumeration of total bacterial colony forming units following dilution plating. TSB-G, TSB supplemented with 45 mM glucose. Two-way ANOVA with Sidak’s multiple comparisons posttest; *P ≤ 0.05, ***P ≤ 0.001, ****P ≤ 0.0001.
Fig. 2.
Fig. 2.
The ClpXP proteolytic activity enhances cell death. (A) Protein oxidation (n = 3, mean ± SD), (B) protein aggregation (n = 5, mean ± SD), and (C) viability of the WT and clpP mutants (n = 3, mean ± SD). (D) The cell viabilities of the clpX, clpC (n = 4, mean ± SD) and (E) clpXI265E mutants were determined in stationary phase relative to the WT strain (n = 3, mean ± SD). (F) The intracellular abundance of Spx was used as an indicator of ClpXP proteolytic activity following growth in MOPS-buffered (100 mM, pH 7.3) and unbuffered media. S. aureus Spx was detected using cross-reactive polyclonal antibodies raised against B. subtilis Spx. Enolase was detected as a loading control. (G) The fold-change in the expression of spx, (H) clpP, and (I) clpX was determined over time during different growth phases by qRT-PCR (n = 3, mean ± SD). Fold-change expression values are relative to 3 h of growth (midexponential phase). Two-way ANOVA with Sidak’s multiple comparisons posttest; *P ≤ 0.05, ***P ≤ 0.001, ****P ≤ 0.0001.
Fig. 3.
Fig. 3.
Altered proteome of stationary phase cells undergoing acetate stress. (A) Voronoi Treemaps and GO-term enrichment analysis of WT and clpP mutant are depicted. The Voronoi Treemaps were generated from log2 ratios of their respective intracellular proteins at 72 h and 24 h of growth in TSB-G. Proteins with altered ratios were clustered based on the TIGRFAM annotations and depicted as functional categories. Additional subcategories and gene ID annotations are indicated in SI Appendix, Fig. S3. (B) Heatmap representing the intracellular changes in select metabolic enzymes of WT and clpP at 72 h relative to 24 h. The corresponding reaction level differences are detailed in Dataset S7. (C) Volcano plot of the intracellular proteins in stationary phase cells. Each data point represents individual proteins organized according to their mean clpP/WT log2 fold-change ratios (y axis) following 72 h of growth in TSB-G. The horizontal dotted line indicates the cutoff for proteins that showed significantly altered abundance (P ≤ 0.05).
Fig. 4.
Fig. 4.
ClpXP targets SodA to subvert the antioxidant capacity of cells. (A) Representative EPR spectroscopic trace of ROS derived from whole cells in stationary phase (72 h). ROS was detected using the spin probe, CMH. (B) Schematic of the antioxidant enzymes of S. aureus and their target ROS. AhpC, alkylhydroperoxidase subunit; KatA, catalase; SodA/SodM, Mn-dependent superoxide dismutases. (C) Stationary phase viability of sodA and (D) sodM mutants relative to WT and clpP mutant strains (n = 3, mean ± SD). (E) SOD activity of cell extracts at 24 h and 72 h were determined as the percent inhibition of WST-1 reduction by superoxide using a commercially available kit (Sigma). WST-1, water-soluble tetrazolium salt (n = 3, mean ± SD; one-way ANOVA with Tukey's multiple comparisons test, *P ≤ 0.05, ****P ≤ 0.0001). (F) The fold-change in the expression of sodA was determined at 24 h and 72 h in the clpP mutant. The fold-change expression values were calculated relative to the WT strain at identical time-points (n = 3, mean ± SD; two-tailed unpaired t test, ns: not significant). (G) The intracellular levels of SodA were detected in various mutants by Western blot analysis using cross-reactive polyclonal antibodies raised against Bacillus anthracis SodA (Upper). Enolase was detected as a loading control. Densitometric quantification was performed by ImageJ (Lower) (n = 3, mean ± SD; one-way ANOVA with uncorrected Fisher's LSD, *P ≤ 0.05, ***P ≤ 0.001). (H) Cell viability of ahpC and (I) katA mutants in stationary phase (n = 3, mean ± SD).
Fig. 5.
Fig. 5.
ClpXP activity eliminates fitness-compromised cells in stationary phase. (A) The competitive fitness of the clpP and clpXI265E mutants that grew to stationary phase in TSB-G (24 h or 72 h) were determined relative to the WT strain harvested at identical time points in the same growth media (TSB-G). For the determination of relative fitness, coculture competitions were carried out for 8 h in fresh TSB. Initial bacterial counts (I0) and final counts after 8 h of growth (F8h) were used to measure the relative fitness (w). Relative fitness ratios of the (B) clpP to WT, (C) clpXI265E to WT, and (D) sodA to clpPsodA are depicted here. (n = 12, mean ± SD; two-tailed unpaired t test, ***P ≤ 0.001, ****P ≤ 0.0001). (E) Correlation of clpP expression and ClpP-dependent cell death. The fold-change in clpP expression was determined at 24 h after challenging WT with various antibiotics at the postexponential phase (6 h). The fold-change expression values were calculated relative to the WT strain grown to 24 h without antibiotic treatment. The cell death index reflects a measure of the ClpP-dependent cell death observed in stationary phase following antibiotic challenge. The cell death index was calculated as the ratio of the death rates (kmax) of WT and clpP mutant. A value above 1 indicates a greater rate of cell death in the WT relative to the clpP mutant. Measures of clpP expression and cell death index were determined following the growth of S. aureus in TSB. C, chloramphenicol; E, erythromycin: Gm, gentamicin: Kn, kanamycin; Ox, oxacillin; Te, tetracycline; Ts, trimethoprim; Va, vancomycin.
Fig. 6.
Fig. 6.
Model of the ClpXP mediated cell death pathway in S. aureus. S. aureus accumulates oxidized protein aggregates and turns on the expression of clpX and clpP when they encounter antibiotic (Ab) stress or undergo intracellular acidification (H+). In rapidly dividing cells that can dilute the effect of damaged proteins through cell division, the ClpXP protease may be sufficient to recycle protein aggregates and restore the fitness of cells. However, nondividing populations that contain protein aggregates undergo cell death to maintain population fitness (Left). To initiate cell death, the ClpXP protease targets the degradation of SodA, which results in lethal oxidative damage due to sustained superoxide production. In the clpP mutant (Right), the lack of protein turnover results in the retention of proteins that are highly susceptible to oxidation and aggregation. However, the increased levels and activity of SodA promote cell survival due to decreased ROS-mediated killing. This image was created with BioRender.com.

Comment in

References

    1. Kolter R., Siegele D. A., Tormo A., The stationary phase of the bacterial life cycle. Annu. Rev. Microbiol. 47, 855–874 (1993). - PubMed
    1. Lewis K., Persister cells, dormancy and infectious disease. Nat. Rev. Microbiol. 5, 48–56 (2007). - PubMed
    1. Rohmer L., Hocquet D., Miller S. I., Are pathogenic bacteria just looking for food? Metabolism and microbial pathogenesis. Trends Microbiol. 19, 341–348 (2011). - PMC - PubMed
    1. Zhang Y. J., Rubin E. J., Feast or famine: The host-pathogen battle over amino acids. Cell. Microbiol. 15, 1079–1087 (2013). - PMC - PubMed
    1. Jaishankar J., Srivastava P., Molecular basis of stationary phase survival and applications. Front. Microbiol. 8, 2000 (2017). - PMC - PubMed

Publication types