. 2021 Nov 15;12(1):6587.
doi: 10.1038/s41467-021-26731-9.

A model for learning based on the joint estimation of stochasticity and volatility

Affiliations

A model for learning based on the joint estimation of stochasticity and volatility

Payam Piray et al. Nat Commun. .

Abstract

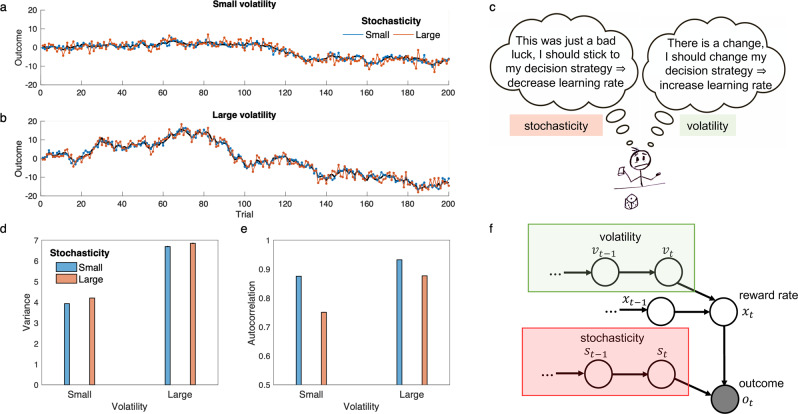
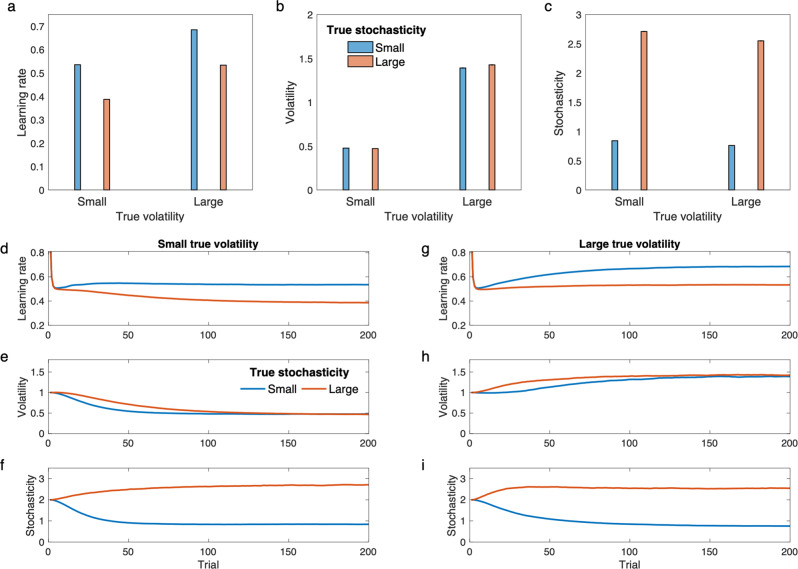
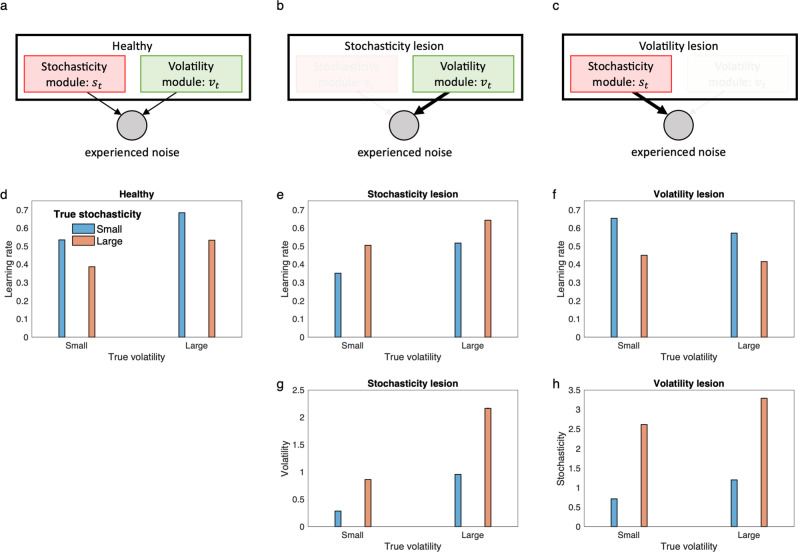
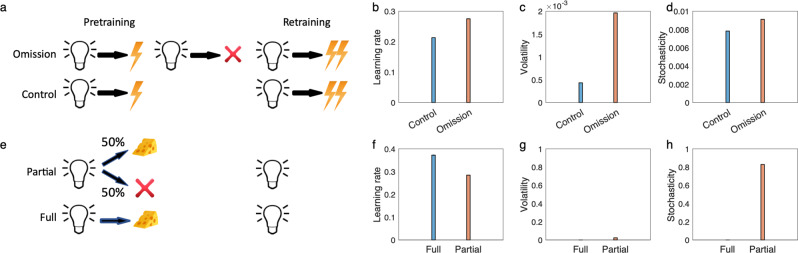
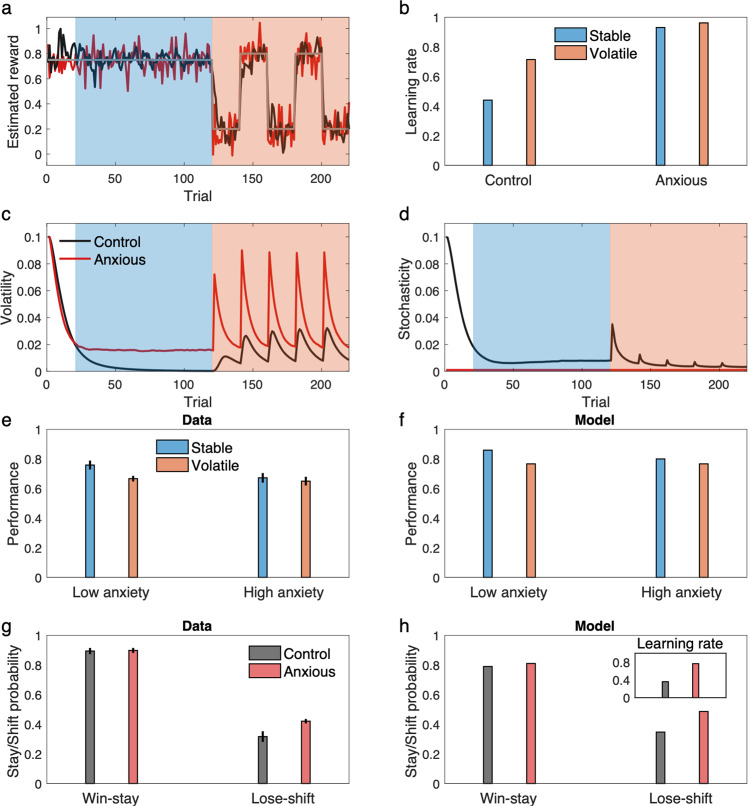
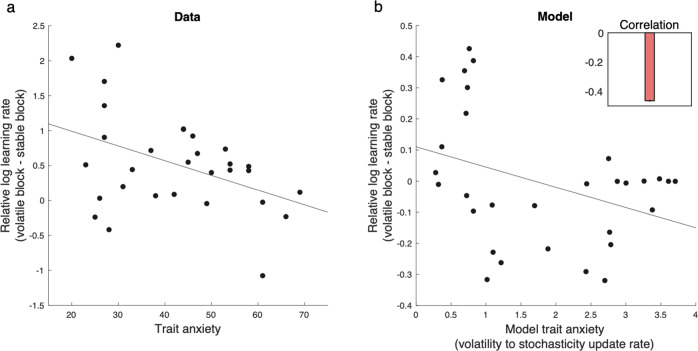
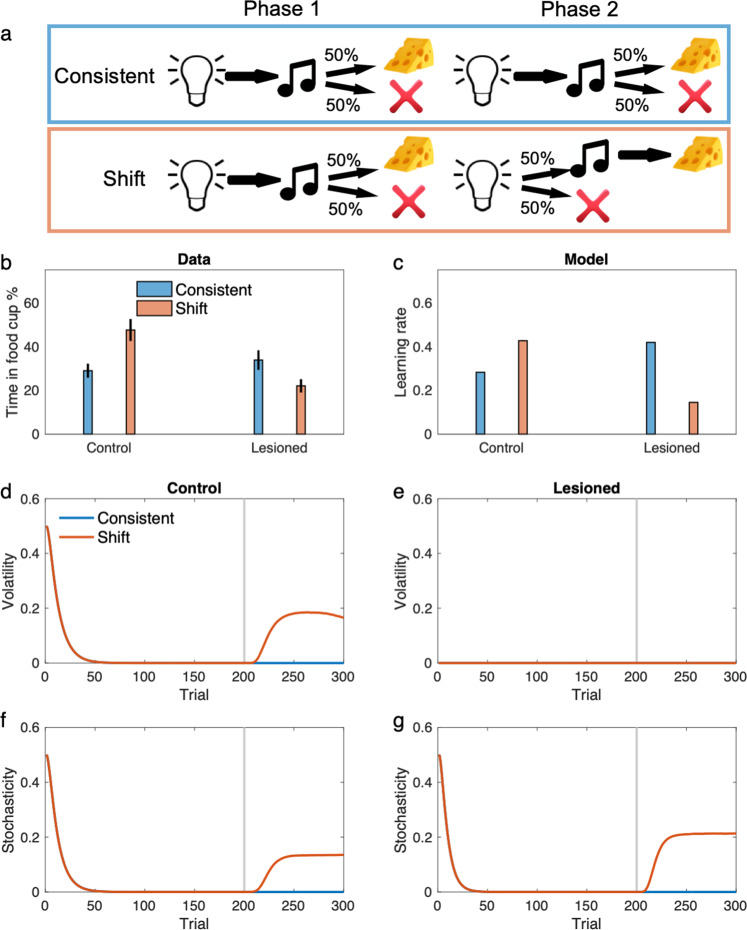
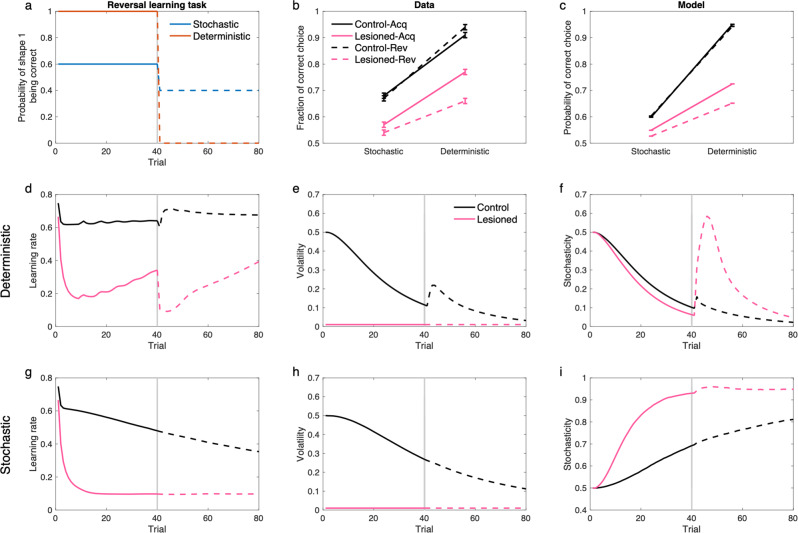
Previous research has stressed the importance of uncertainty for controlling the speed of learning, and how such control depends on the learner inferring the noise properties of the environment, especially volatility: the speed of change. However, learning rates are jointly determined by the comparison between volatility and a second factor, moment-to-moment stochasticity. Yet much previous research has focused on simplified cases corresponding to estimation of either factor alone. Here, we introduce a learning model, in which both factors are learned simultaneously from experience, and use the model to simulate human and animal data across many seemingly disparate neuroscientific and behavioral phenomena. By considering the full problem of joint estimation, we highlight a set of previously unappreciated issues, arising from the mutual interdependence of inference about volatility and stochasticity. This interdependence complicates and enriches the interpretation of previous results, such as pathological learning in individuals with anxiety and following amygdala damage.


Conflict of interest statement

The authors declare no competing interests.

Figures

Fig. 1
Fig. 1. Statistical difference between volatility and stochasticity.
a–b Examples of generated time-series based on a small and large constant volatility parameter given a small (a) or a large (b) constant stochasticity parameter are plotted. c Given a surprising observation (e.g., a negative outcome), one should compute how likely the outcome is due to the stochasticity (left balloon) or due to the volatility (right balloon). Dissociating these two terms is important for learning, because they have opposite influences on learning rate. d–e It is possible to infer both volatility and stochasticity based on observed outcomes, because these parameters have dissociable statistical signatures. In particular, although both of them increase variance (d), but they have opposite effects on autocorrelation (e). In particular, whereas volatility increases autocorrelation, stochasticity tends to reduce it. Here, 1-step autocorrelation (i.e., correlation between trial t and t1) was computed for 100 time-series generated with parameters defined in b and c. Small and large parameters for volatility were 0.5 and 1.5 and for stochasticity were 1 and 3, respectively. f Structure of the (generative) model: outcomes were stochastically generated based on a probabilistic model depending on reward rate, stochasticity and volatility. Only outcomes were observable (the gray circle), and value of all other parameters should be inferred based on outcomes. The observed outcome is given by the true reward rate, xt, plus some noise whose variance is given by the stochasticity, st. The reward rate itself depends on its value on the previous trial plus some noise whose variance is given by the volatility, vt. Both volatility and stochasticity are dynamic and probabilistic Markovian variables generated noisily based on their value on the previous trial. Thus, the model has two modules, volatility and stochasticity, which compete to explain experienced noise in outcomes. See Methods for formal treatment of the model. Errorbars in (d–e) are standard error of the mean calculated across 10000 simulations and are too small to be visible. Source data are provided as Source Data file.
Fig. 2
Fig. 2. Performance of the model in task with constant but unknown volatility and stochasticity parameters.
Outcomes were generated according to the same procedure and parameters as those used in Fig. 1 (see Fig. 1a, b, e.g., outcome time-series seen by the model). a Learning rate in the model varies by changes in both the true volatility and stochasticity. Furthermore, these parameters have opposite effects on learning rate. In contrast to volatility, higher stochasticity reduces the learning rate. b Estimated volatility captures variations in true volatility. c Estimated stochasticity captures variations in the true stochasticity. In a–c, average learning rate, estimated volatility and stochasticity in the last 20 trials were plotted over all simulations. d–f Learning rate, volatility and stochasticity estimates by the model for small true volatility. g–i The three signals are plotted for the larger true volatility. Estimated volatility and stochasticity by the model capture their corresponding true values. Errorbars are standard error of the mean computed over 10,000 simulations and are too small to be visible. See also Supplementary Fig. 3 for further simulation analysis. Source data are provided as Source Data file.
Fig. 3
Fig. 3. Behavior of the lesioned model.
a Stochasticity and volatility module inside the model compete to explain experienced noise. b–c Two characteristic lesioned models produce seemingly contradictory behaviors, because if the stochasticity module is lesioned, noise due to stochasticity is misattributed to volatility (b), and vice versa (c). d–f Mean learning rate is plotted for the 2 × 2 design of Fig. 2 for the healthy and lesioned models. For both the lesion models, lesioning does not merely abolish the corresponding effects on learning rate, but reverses them. Thus, the stochasticity lesion model shows elevated learning rate with increases in stochasticity (e), and the volatility lesion model shows reduced learning rate with increases in volatility (f). This is due to misattribution of the noise due to the lesioned factor to the existing module. g The stochasticity lesion model makes erroneous inference about volatility and increases its volatility estimate in higher stochastic environments. h The volatility lesion model makes erroneous inference about stochasticity and increases its stochasticity estimate for higher volatile environments. In fact, both the lesion models are not able to distinguish between the volatility and stochasticity and therefore show similar pattern for the remaining module. For the healthy model, volatility and stochasticity estimates are the same as Figs. 2b and 2c, respectively. Simulation and model parameters were the same as those used in Fig. 2. Errorbars reflect standard error of the mean computed over 10,000 simulations and are too small to be visible. Source data are provided as Source Data file.
Fig. 4
Fig. 4. The model explains puzzling issues in Pavlovian learning.
a–d Pearce and Hall’s conditioned suppression experiment. The design of experiment, in which they found that the omission group show higher speed of learning than the control group (a). b Median learning rate over the first trial of the retraining. The learning rate is larger for the omission group due to increases of volatility (c), while stochasticity is similar for both groups (d). The model explains partial reinforcement extinction effects (e–h). e The partial reinforcement experiment consists of a partial condition in which a light cue if followed by reward on 50% of trials and a full condition in which the cue is always followed by the reward. f Learning rate over the first trial of retraining has been plotted. Similar to empirical data, the model predicts that the learning rate is larger in the full condition, because partial reinforcements have relatively small effects on volatility (g), but it considerably increases stochasticity (h). Errorbars reflect standard error of the mean over 40,000 simulations and are too small to be visible. See Supplementary Figs. 4 and 5 for empirical data and corresponding response probability by the model. Source data are provided as Source Data file.
Fig. 5
Fig. 5. The stochasticity lesion model shows a pattern of learning deficits associated with anxiety.
Behavior of the lesioned model as the model of anxiety, in which stochasticity is assumed to be small and constant, is shown along the control model. a–d Behavior of the models in the switching task of Fig. 2 is shown. An example of estimated reward by the models shows that the model with anxiety (i.e., the stochasticity lesion model) is more sensitive to noisy outcomes (a), which dramatically reduces sensitivity of the learning rate to volatility manipulation in this task (b). This, however, is primarily related to inability to make inference about stochasticity, which leads to misestimation of volatility (c–d). e–f The model explains the data reported by Piray et al., in which the high (social) anxiety group did not benefit from stability as much as the low anxiety group (e). The model shows the same behavior (f). g–h The model explains the data by Huang et al., in which the anxious group showed higher lose-shift behavior compared to the control group (g). The model shows the same behavior (g), which is due to higher learning rate in the anxious group (inset). Errorbars in (b), (f), and (h) reflect standard error of the mean over 1000 simulations and are too small to be visible. Data in (e) are adapted from Piray et al. 20 in which median and standard error of the median are plotted (obtained over n = 44 samples). Data in (g) are adapted from Huang et al., in which mean and standard error of the mean are plotted (obtained over n = 122 independent samples.) Source data are provided as Source Data file.
Fig. 6
Fig. 6. The model explains effects of trait anxiety as a continuous index on learning.
a Data by Browning et al. show a significant negative correlation between relative log learning rate and trait anxiety in a probabilistic switching task with stable and volatile blocks. b The model shows a similar pattern. The inset shows the median rank correlation between the trait anxiety and the relative learning rate. Model trait anxiety is defined as the ratio of volatility to stochasticity update rates (thus higher if the stochasticity update rate is small). The lesion model of anxiety (Fig. 5) is a special case in which the stochasticity update rate is zero. Errorbars reflect standard error of the median over 1000 simulations and are too small to be visible. Source data are provided as Source Data file.
Fig. 7
Fig. 7. The model displays the behavior of amygdala lesioned rats in associative learning.
a The task used for studying the role of amygdala in learning by Holland and Gallagher,,. Rats in the “consistent” condition received extensive exposure to a consistent light-tone in a partial reinforcement schedule (i.e., only half of trials led to reward). In the “shift” condition, however, rats were trained on the same light-tone partial reinforcement schedule in the first phase, but the schedule shifted to a different one in the shorter second phase, in which rats received light-tone-reward on half of trials and light-nothing on the other half. b Empirical data showed that while the contingency shift facilitates learning in the control rats, it disrupts performance in lesioned rats. c learning rate in the last trial of second phase shows the same pattern. This is because the shift increases volatility for the control rats (d) but not for the lesioned rats (e). In contrast, the contingency shift increases the stochasticity for the lesioned rats substantially more than that for the control rats, which results in reduced learning rate for the lesioned animals (f–g). The gray line shows the starting trial of the second phase. Data in (b) was originally reported in and reproduced here from. Errorbars in other (c–g) reflect standard error of the mean over 40,000 simulations and are too small to be visible. See also Supplementary Table 1. Source data are provided as Source Data file.
Fig. 8
Fig. 8. The model displays the behavior of amygdala lesioned monkeys in probabilistic reversal learning.
a The probabilistic reversal learning task by Costa et al.. The task consists of 80 trials, in which animals chose one of the two presented shape cues by making a saccade to it and fixating on the chosen cue. A probabilistic reward was given following a correct choice. The stimulus-reward contingency was reversed in the middle of the task (on a random trial between trials 30-50). The task consists of different schedules, but we focus here on 60%/40% (stochastic) and 100%/0% (deterministic), which show the clearest difference in empirical data. b Performance of animals in this task. In addition to the general reduced performance by the lesioned animals, their performance was substantially more disrupted in the deterministic- than stochastic-reversal. c Performance of the model in this task shows the same pattern. d–i Learning rate, volatility and stochasticity signals for the deterministic (d–f), and stochastic task (g–i). Solid and dashed line are related to acquisition and reversal phase, respectively. Deterministic reversal increases the learning rate in the control animals due to increases in volatility, but not in the lesioned monkeys, in which it reduces the learning rate due to the increase of the stochasticity. The reversal in the stochastic task has very small effects on these signals, because stochasticity is relatively large during both acquisition and reversal. Data in (b) are adapted from Costa et al., in which mean and standard error of the mean are plotted. Errorbars in other panels reflect standard error of the mean over 1000 simulations and are too small to be visible. See also Supplementary Fig. 7 for choice time-series and Supplementary Fig. 8 for simulation of the model in all four probabilistic schedules tested by Costa et al. and corresponding empirical data. Source data are provided as Source Data file.

Similar articles

Cited by

References

    1. Dayan, P. & Long, T. Statistical Models of Conditioning. In Advances in Neural Information Processing Systems 10 (eds, Jordan, M., Kearns, M. & Solla, S.) 117–123 (MIT Press, 1998).
    1. Dayan P, Kakade S, Montague PR. Learning and selective attention. Nat. Neurosci. 2000;3:1218–1223. - PubMed
    1. Courville AC, Daw ND, Touretzky DS. Bayesian theories of conditioning in a changing world. Trends Cogn. Sci. (Regul. Ed.) 2006;10:294–300. - PubMed
    1. Daunizeau J, et al. Observing the observer (I): meta-bayesian models of learning and decision-making. PLoS ONE. 2010;5:e15554. - PMC - PubMed
    1. Gershman SJ, Blei DM, Niv Y. Context, learning, and extinction. Psychol. Rev. 2010;117:197–209. - PubMed

Publication types