. 2022 Jan;28(1):201-211.
doi: 10.1038/s41591-021-01576-3. Epub 2021 Nov 15.

Dexamethasone modulates immature neutrophils and interferon programming in severe COVID-19

Affiliations

Dexamethasone modulates immature neutrophils and interferon programming in severe COVID-19

Sarthak Sinha et al. Nat Med. 2022 Jan.

Abstract

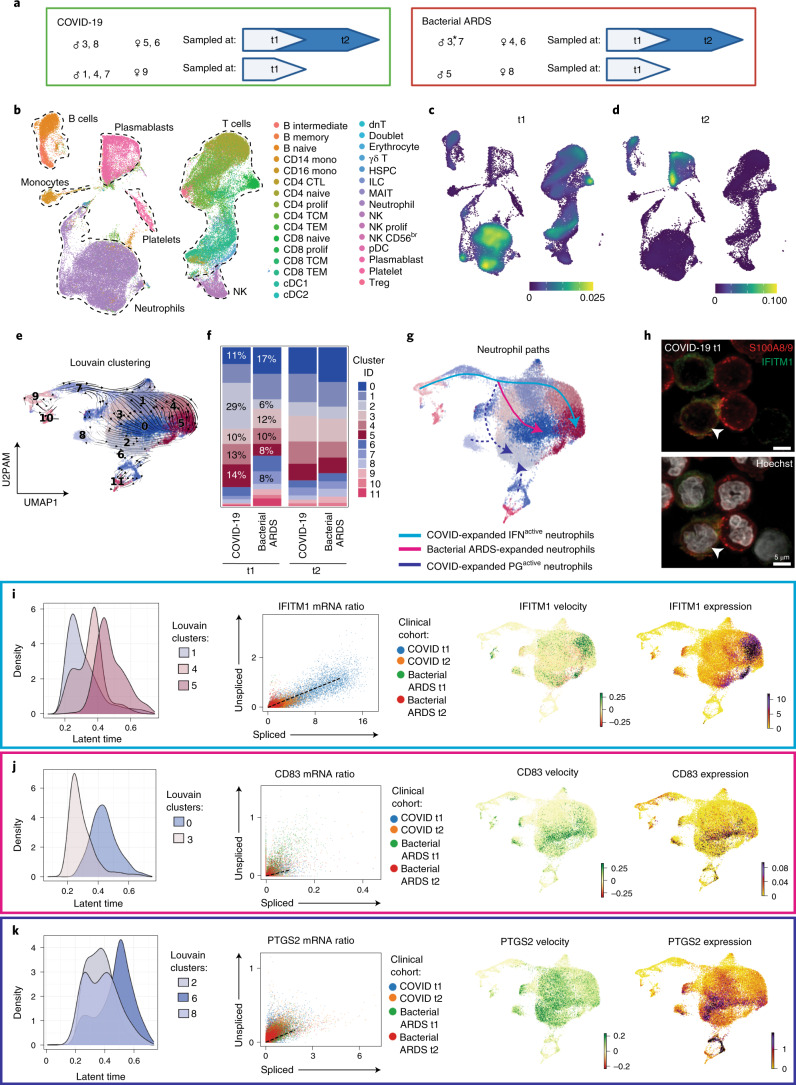
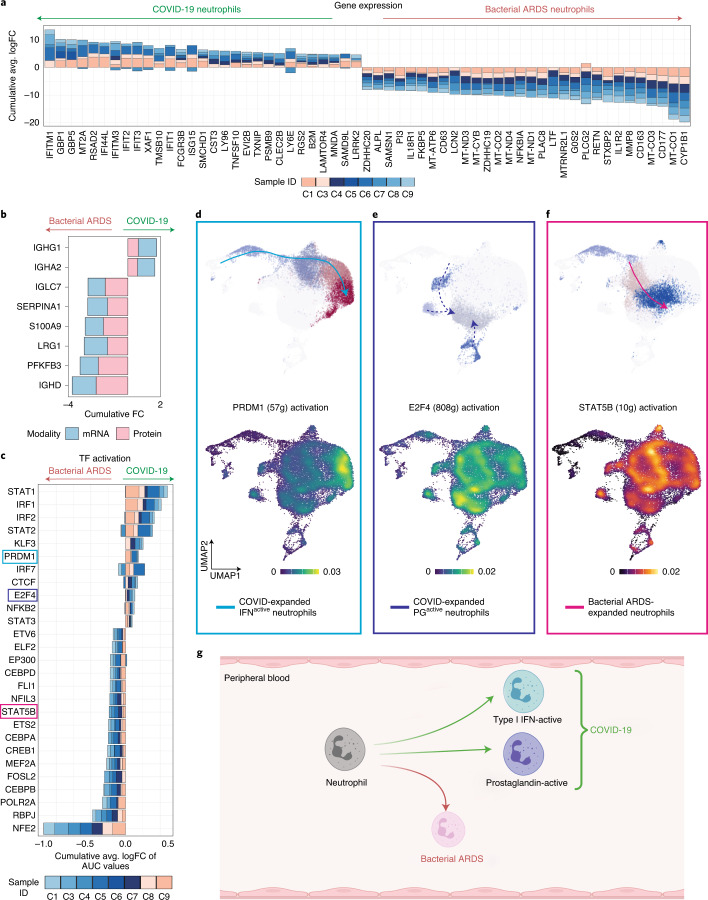
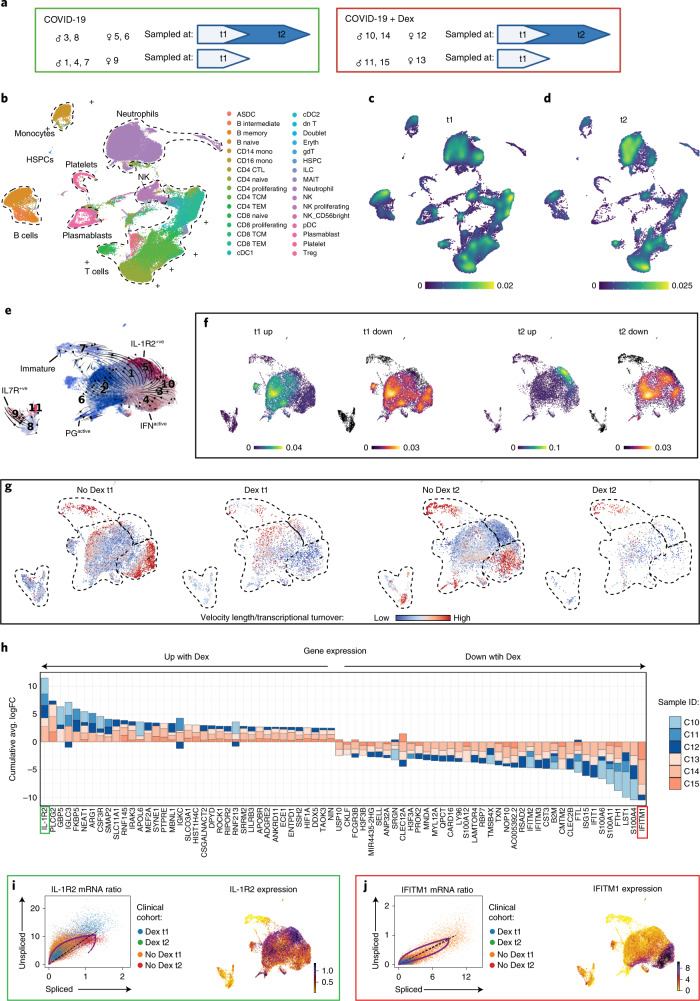
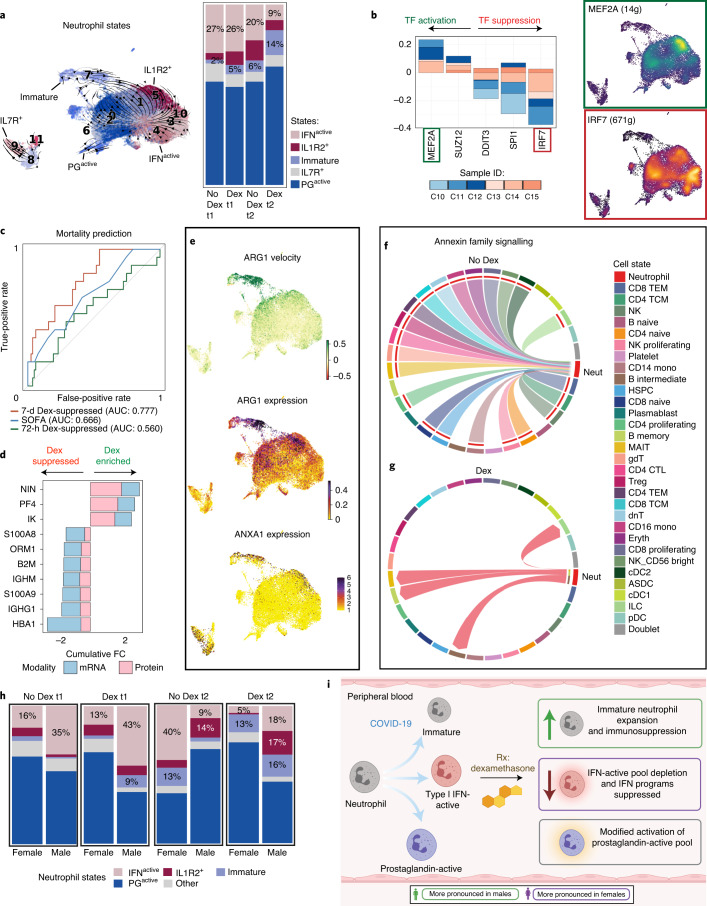
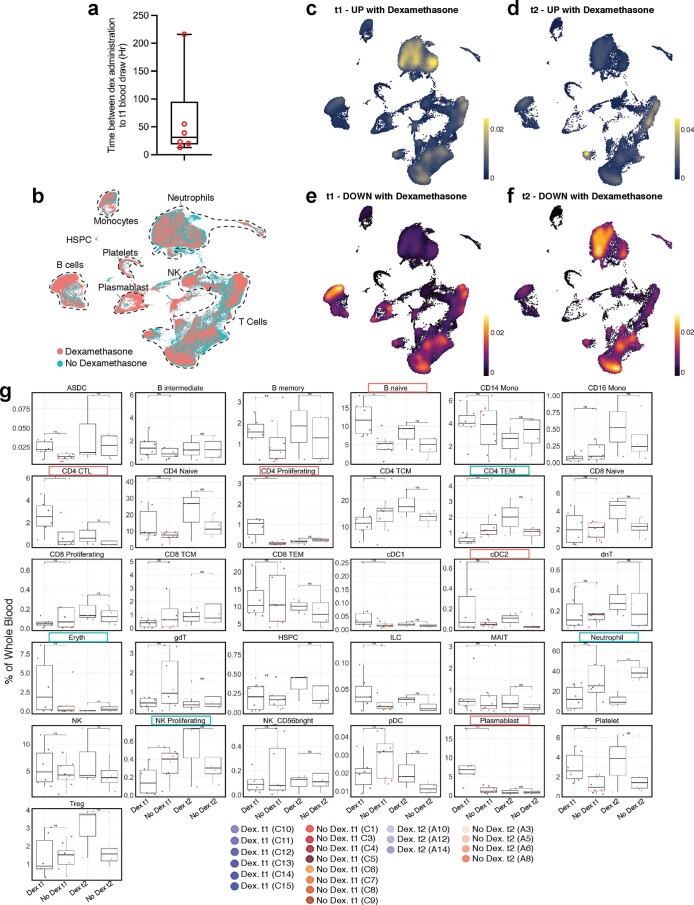
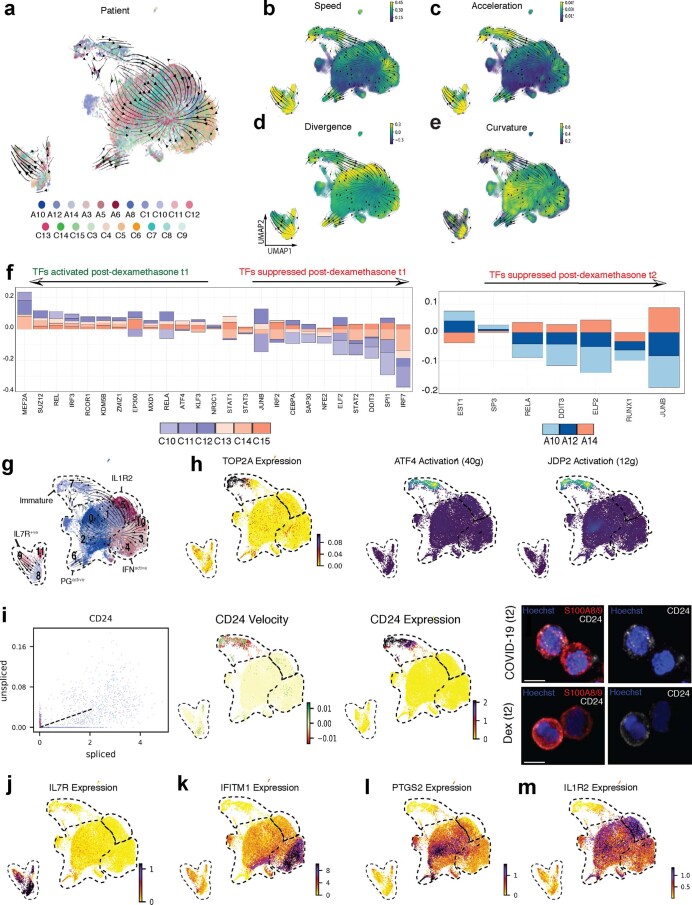
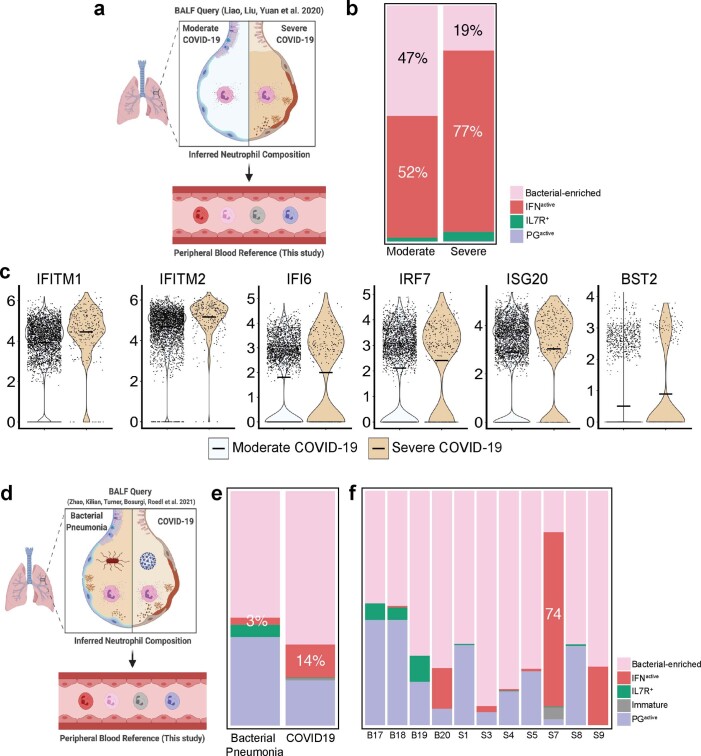
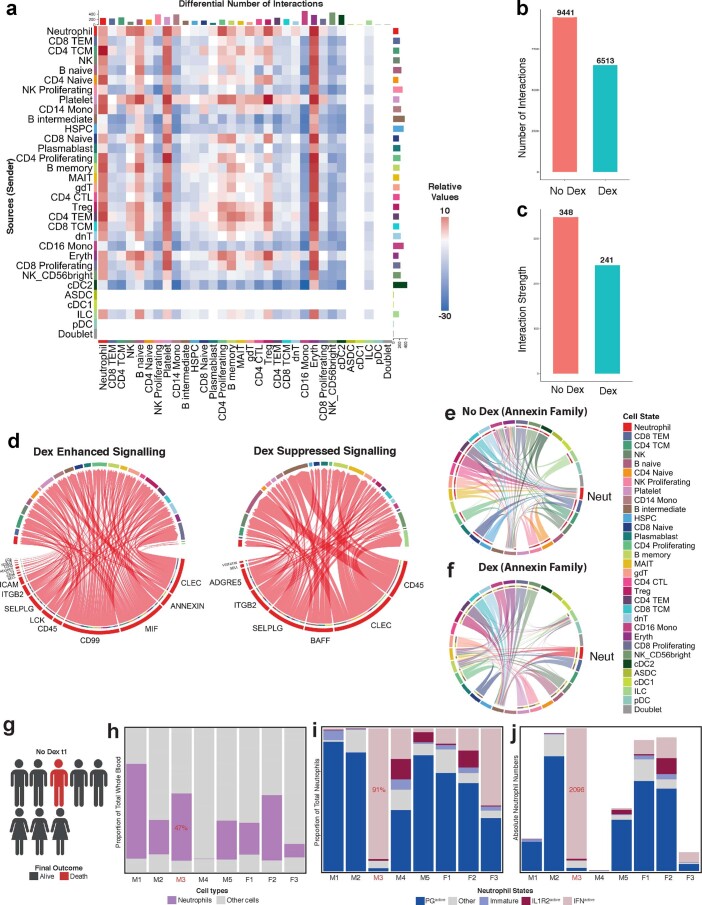
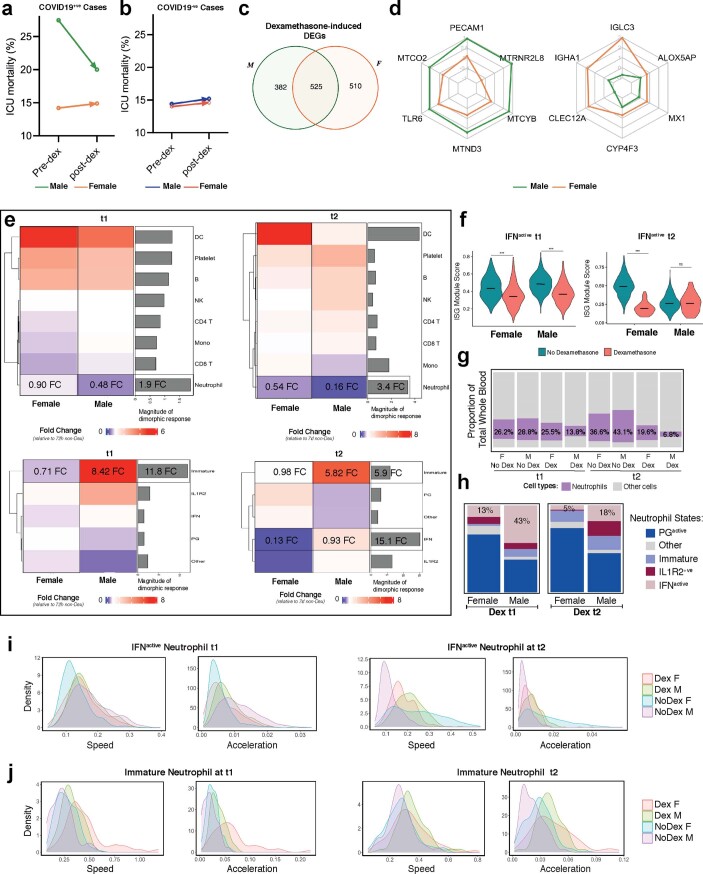
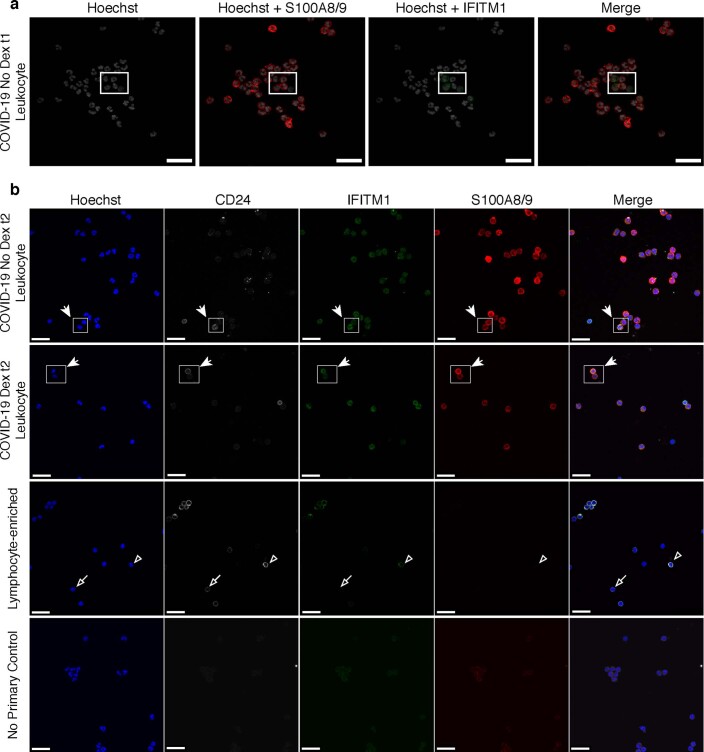
Although critical for host defense, innate immune cells are also pathologic drivers of acute respiratory distress syndrome (ARDS). Innate immune dynamics during Coronavirus Disease 2019 (COVID-19) ARDS, compared to ARDS from other respiratory pathogens, is unclear. Moreover, mechanisms underlying the beneficial effects of dexamethasone during severe COVID-19 remain elusive. Using single-cell RNA sequencing and plasma proteomics, we discovered that, compared to bacterial ARDS, COVID-19 was associated with expansion of distinct neutrophil states characterized by interferon (IFN) and prostaglandin signaling. Dexamethasone during severe COVID-19 affected circulating neutrophils, altered IFNactive neutrophils, downregulated interferon-stimulated genes and activated IL-1R2+ neutrophils. Dexamethasone also expanded immunosuppressive immature neutrophils and remodeled cellular interactions by changing neutrophils from information receivers into information providers. Male patients had higher proportions of IFNactive neutrophils and preferential steroid-induced immature neutrophil expansion, potentially affecting outcomes. Our single-cell atlas (see 'Data availability' section) defines COVID-19-enriched neutrophil states and molecular mechanisms of dexamethasone action to develop targeted immunotherapies for severe COVID-19.


Conflict of interest statement

S.S. declares stock ownership in 10x Genomics. All other authors declare no conflicts of interest.

Figures

Fig. 1
Fig. 1. COVID-19 alters neutrophil maturation.
a, Schematic summarizing patients with COVID-19 and bacterial ARDS profiled at t1 and t2. Comparisons presented included six bacterial ARDS (n = 5 at t1 and n = 4 at t2; * denotes that patient B3 had only the t2 sample pass QC and was not included at t1) and eight non-dexamethasone COVID-19 ARDS (n = 8 at t1 and n = 4 at t2) patients who were admitted to the ICU. b, UMAP projection of 86,935 whole blood cells from 21 patient samples, colored by Azimuth reference-mapped immune cell states. c, d, Kernel density estimates depicting magnitude of molecular response elicited by immune cell subsets during COVID-19 compared to bacterial ARDS at t1 (c) and t2 (d), calculated by summing DEG FCs for each cell state shown in a. e, UMAP plotting RNA velocity analysis of 29,653 subclustered neutrophils undergoing state transitions, colored by cluster ID. f, Stacked bar plot depicting cluster composition of clinical cohorts examined. g, UMAP colored by neutrophil clusters and overlaid with summary path curves based on vector fields and neutrophil state compositions in d and e, respectively, to determine neutrophil states. h, Immunocytochemistry for S100A8/A9 (red) and IFITM1 (green) expression on leukocyte-rich preparation from a donor with COVID-19 at t1 (representative image provided from n = 3 replicates). ik, Transcriptional kinetics driving expansion of IFNactive (i), bacterial ARDS-enriched (j) and PGactive (k) neutrophils. Latent time distribution of trajectory-associated Louvain clusters (left), phase portraits with equilibrium slopes of spliced–unspliced ratios (center) and RNA velocity and gene expression (right) of selected genes driving divergent maturation trajectories. Phase portraits are colored by clinical cohort.
Fig. 2
Fig. 2. Distinct regulatory programs drive divergent neutrophil maturation.
a, Consensus neutrophil DEGs upregulated (positive FC) or suppressed (negative FC) during COVID-19 in at least three of eight patients at t1 relative to bacterial ARDS. None of the patients with COVID-19 ARDS included in this comparison received dexamethasone. b, Consensus of differentially expressed features distinguishing neutrophils in COVID-19 versus bacterial ARDS jointly identified by changes in mRNA (quantified by scRNA-seq) and plasma protein (quantified by LC–MS/MS) levels. c, Differentially activated consensus TFs in neutrophils from patients with COVID-19 relative to bacterial ARDS at t1. Stacked bars depict logFC contributions of each patient with COVID-19. df, Gene regulatory networks preferentially driving IFNactive (PRDM1, d), PGactive (E2F4, e) and bacterial ARDS-enriched (STAT5B, f) neutrophil states. Scale bars depict kernel density estimates approximating magnitude of TF activation inferred by SCENIC-calculated AUCell scores. g, Schematic summarizing neutrophil fates favored during COVID-19 versus bacterial ARDS (created with BioRender).
Fig. 3
Fig. 3. Dexamethasone suppresses IFN programs and depletes IFNactive neutrophils in COVID-19.
a, Schematic summarizing patients with COVID-19 who were treated with or without dexamethasone profiled at t1 and t2. Comparisons presented included eight non-dexamethasone-treated COVID-19 ARDS (n = 8 at t1 and n = 4 at t2) and six dexamethasone-treated COVID-19 ARDS (n = 6 at t1 and n = 3 at t2) patients who were admitted to the ICU. b, UMAP projection of 80,994 whole blood cells from 21 patient samples, colored by Azimuth reference-mapped immune cell states. c, d, Kernel density estimates depicting magnitude of molecular response elicited by immune cell subsets after dexamethasone treatment at t1 (c) and t2 (d), calculated by summing DEG FCs for each cell state shown in a. e, Neutrophil states overlaid on a UMAP of 23,193 subclustered neutrophils from dexamethasone- and non-dexamethasone-treated patients with COVID-19, colored by cluster ID. f, Magnitude of molecular response elicited by each neutrophil state after dexamethasone treatment calculated by summing DEG FCs for each cell state shown in d, g, RNA velocity vector length (indicating rate of differentiation/state transition) in dexamethasone- and non-dexamethasone-treated neutrophils at t1 and t2. h, Consensus neutrophil DEGs upregulated (positive FC) or suppressed (negative FC) after dexamethasone in at least three of six patients with COVID-19 at t1 relative to non-dexamethasone COVID-19 controls. Stacked bars depict logFC contribution of each dexamethasone-treated patient. i, j, Differential splicing kinetics drives activation of IL-1R2 (i) and suppression of IFITM1 expression (j) after dexamethasone treatment. Phase portraits show equilibrium slopes of spliced–unspliced mRNA ratios. Green denotes most upregulated and red denotes most downregulated DEGs with COVID-19 (f). HSPC, hematopoietic stem and progenitor cell. Dex, dexamethasone.
Fig. 4
Fig. 4. Dexamethasone expands immunosuppressive neutrophils and repatterns their interactions in COVID-19.
a, Neutrophil states mapped onto Louvain-clustered UMAP, with comparison of neutrophil composition between dexamethasone- and non-dexamethasone-treated samples at t1 and t2. b, Consensus TFs activated or suppressed after dexamethasone in at least three of six patients at t1 and predicted activity of MEF2A and IRF7, two of the most differentially regulated TFs, after dexamethasone. c. ROC curves assessing the discriminatory capacity of dexamethasone-suppressed DEGs at t1 and t2 and SOFA scores for predicting 28-d mortality in a validation cohort of 103 bulk whole blood RNA-seq samples where 17 cases were fatal. d, Consensus of differentially expressed neutrophil features upregulated (positive FC) or suppressed (negative FC) after dexamethasone jointly identified by changes in mRNA (quantified by scRNA-seq) and plasma protein (quantified by LC–MS/MS) levels. e, Immature and IL-1R2+ neutrophil subsets express high levels of immunosuppressive neutrophil markers ARG1 and ANXA1. f, g, Topology of annexin signaling family without (f) and with (g) dexamethasone treatment (edges filtered to those where neutrophils function as senders or recipients of annexin signals). h, Neutrophil state composition separated by sex and dexamethasone status at t1 and t2. i, Schematic summarizing the effects of dexamethasone on neutrophil fates and function in COVID-19 after dexamethasone treatment (created with BioRender). Dex, dexamethasone.
Extended Data Fig. 1
A modified CONsolidated Standards Of Reporting Trials (CONSORT) diagram showing trial groups in this study.
Extended Data Fig. 2
Extended Data Fig. 2. Clinical data of ICU admitted COVID-19 and bacterial ARDS.
Shotgun proteomics assessment using tandem Mass Spectroscopy with a targeted search run for known SARS-CoV-2 proteins R1A and R1AB, and SARS-CoV protein NS3B are displayed for all patient cohorts (COVID-19 non-dexamethasone = 9; bacterial ARDS controls = 6). b. Summary of individual information of ICU admitted patients with established COVID-19 or a diagnosis of bacterial ARDS due to sepsis (bacterial ARDS n = 5 at t1, n = 4 at t2; COVID-19 ARDS n = 8 at t1, n = 4 at t2). Age, sex, comorbidities and lengths of stay are displayed. Life support machine includes mechanical ventilation (and ECMO in the instance of sample C3 at t2). c-d. Aggregated cohort clinical data (c) and racial backgrounds (d). e. Clinical cell counts from peripheral blood taken on t1; shaded areas show local lab normal values. f. PaO2/FiO2 ratio (P/F) and creatinine at t1. g. Multiple comparison analysis of all serum cytokines assessed at t1 and t2 are shown as volcano plots. Significance was estimated using two-tailed Mann-Whitney U test with Holm–Sidak multiple-testing correction. (h-i) Serum cytokine determination of prototypical mediators involved in (h) cytokine storm and (i) cytokine release syndrome graphed in Log transformation taken at t1. Box plots include a line across the box, upper hinge, and lower hinge which represent median, 75th percentile (Q3), and 25th percentile (Q1), respectively. The lower and upper hinges correspond to the first and third quartiles. The upper whisker extends from the hinge to the largest value no further than Q3 + 1.5× interquartile range (IQR). The lower whisker extends from the hinge to the smallest value at most Q1 – 1.5 * IQR.
Extended Data Fig. 3
Extended Data Fig. 3. COVID-19 elicits distinct innate and adaptive immune responses compared to bacterial ARDS.
a. UMAP projection of 86,935 whole blood cells from 21 patient samples, coloured by clinical cohort. b-e. Kernel density estimates depicting magnitude of response elicited by immune cell subsets in COVID-19 t1 (b-c) and t2 (d-e) calculated by summing consensus DEG fold changes for each cell subset shown in Panel B. Consensus DEGs upregulated in COVID-19 are plotted on cividis spectrum (yellow = higher expression) whereas downregulated DEGs are plotted on inferno spectrum (yellow/orange = lower expression). f. Boxplots showing percentage of each cell type in each patient sample grouped by clinical cohort and coloured by donor ID. The x axes correspond to the clinical cohort of each patient. Biologically independent samples for COVID-19 at t1 (n = 8), COVID-19 at t2 (n = 4), bacterial ARDS at t1 (n = 5), and bacterial ARDS at t2 (n = 4). Significance of effects was estimated using two-sided generalized linear mixed-effects model (glmer, binomial distribution) with fixed (COVID-19 vs Bacterial ARDS) and random (per patient) effects. P-values were calculated using likelihood-ratio chi-square for generalized linear models (using R package ‘car’) and were adjusted for multiple comparisons using Bonferroni correction. All effects with p < 0.05 are indicated. *p < 0.05, **p < 0.01, ***p < 0.001. Absolute p-adjusted values are provided in Supplementary Table 8. g-i. Gene Ontology (GO) enrichment depicting top five positively (blue) and negatively (red) regulated terms across all three domains (cellular component, biological process, and molecular function) describing biological activity of gene signatures for IFNactive (g), PGactive (h), and bacterial-expanded (i) neutrophil states.
Extended Data Fig. 4
Extended Data Fig. 4. COVID-19 infection reprograms neutrophil maturation by driving expansion of ISG- and PG-expressing subsets.
a. UMAP of neutrophils from healthy donors (n = 1,912 cells) colored by donor of origin. b. Neutrophil state-defining markers. c. UMAP of neutrophils from healthy donors colored by neutrophil states. d. Neutrophil state composition in healthy donors, combined across all donors or separated by individual donor ID. e. Subclustered neutrophils, integrated across patient cohorts to compare healthy, bacterial ARDS at t1 and t2, and COVID-19 ARDS at t1 and t2. f. Kernel density plots showing expression of neutrophil state-defining markers. g. Cohort-separated UMAPs, colored by subcluster ID and overlaid with cell density contour plots, and bar plot depicting neutrophil cluster composition across cohorts. h. Dendrogram showing unsupervised hierarchical clustering of IFNactive neutrophils by showing relatedness of this subset across patient cohorts. i-j. Cohort-separated UMAPs of IFNactive neutrophils, colored by subcluster ID and overlaid with cell density contour plots (i), and bar plot showing cluster composition (j) across cohorts. k-l. Expression of genes (k) and signalling pathways (l) enriched in COVID-19 t1 IFNactive neutrophil relative to remaining cohorts. m-n. UMAP plotting velocity analysis of 29,653 subclustered neutrophils undergoing state transitions, coloured by clinical cohort (m) and donor IDs (n). o. Cohort-separated UMAPs, colored by neutrophil subcluster ID and overlaid with cell density contour plots. p-q. Subclustered neutrophil UMAPs, coloured by magnitude of velocity vector length reflecting the difference between expected versus recovered unspliced counts (p) and neutrophil Louvain clusters overlaid with velocity vector fields (q). r. Expression of immature neutrophil marker TOP2A. s-t. Consensus plot of differentially expressed genes (s) and SCENIC-inferred transcription factors (t) upregulated (positive logFC) or suppressed (negative logFC) in neutrophils from at least 2 of 4 patients with COVID-19 relative to bacterial ARDS at t2.
Extended Data Fig. 5
Extended Data Fig. 5. Immunosuppressive effects of dexamethasone are mediated through neutrophils and multiple adaptive immune cell subsets.
a. Bar plot shows distribution of time interval (in hours) between dexamethasone administration to first blood draw at t1. Box plot include a line across the box, upper hinge, and lower hinge which represent median, Q3, Q1, respectively. The lower and upper hinges correspond to the Q1 and Q3. The upper whisker extends from the hinge to the largest value no further than Q3 + 1.5× interquartile range (IQR). The lower whisker extends from the hinge to the smallest value at most Q1 – 1.5 * IQR. b. UMAP projection of 80,994 whole blood cells from 21 patient samples, coloured by treatment groups (non-dexamethasone COVID-19 ARDS (n = 8 at t1, n = 4 at t2; dexamethasone-treated COVID-19 ARDS (n = 6 at t1, n = 3 at t2)) c-f. Kernel density estimates depicting magnitude of response elicited by immune cell subsets following dexamethasone treatment at 72 hours post-ICU (c-d) and 7 days post-ICU (e-f) calculated by summing consensus DEG fold changes for each cell subset shown in Panel B. Consensus DEGs upregulated following dexamethasone treatment are plotted on cividis spectrum whereas downregulated DEGs are plotted on inferno spectrum. g. Boxplots showing percentage of each cell type in each patient sample grouped by treatment and coloured by donor ID. The x axes correspond to four treatment groups. n = 6, n = 8, n = 3, and n = 4 biologically independent samples from dexamethasone-treated t1, no dexamethasone t1, dexamethasone-treated t2, no dexamethasone t2, respectively. Significance of effects was estimated using two-sided generalized linear mixed-effects model (glmer, binomial distribution) with fixed (dexamethasone vs no dexamethasone) and random (per patient) effects. P-values were calculated using likelihood-ratio chi-square for generalized linear models (using R package ‘car’) and were adjusted for multiple comparisons using Bonferroni correction. All effects with p < 0.05 are indicated. *p < 0.05, **p < 0.01, ***p < 0.001. Absolute p-adjusted values are provided in Supplementary Table 8.
Extended Data Fig. 6
Extended Data Fig. 6. Distinct neutrophil states and their response to dexamethasone.
a. UMAP projection of subclustered neutrophils from 21 patient samples, coloured by individual patient ID. b-e. Cell speed (length of velocity vectors; b), acceleration (subspaces where velocity undergoes dramatic changes in either in magnitude or direction; c), divergence (outward flux indicating the extent to which a point behaves like a source; d) and curvature (hotspots of abrupt vector field change; e). f. Differentially activated consensus TFs upregulated (positive logFC) or suppressed (negative logFC) post-dexamethasone in at least 3 of 6 patients at t1, and in at least 2 of 3 patients at t2. g-j. Neutrophil states (g) can be distinguished by expression of proliferative marker TOP2A and activation of immaturity-associated TFs ATF4 and JDP2 (h), CD24 splicing kinetics, velocity, expression and immunocytochemistry (representative images are shown; n = 3 for each group; Scale bar, 5 μm) (i), IL-7R (j), Interferon-stimulated genes such as IFITM1 (k), genes involved in prostaglandin synthesis such as PTGS2 (l), and IL-1R2 (m).
Extended Data Fig. 7
Extended Data Fig. 7. Inferred neutrophil composition in bronchoalveolar microenvironments.
a. Strategy for inferring BALF neutrophil composition in severe and moderate COVID-19 by reference-projecting to neutrophil states in peripheral blood. b. Proportion of neutrophil states in bronchoalveolar microenvironment in severe and moderate COVID-19. c. Expression of Type 1 IFN genes in neutrophils across severe and moderate COVID-19 patients. d. Strategy for inferring BALF neutrophil composition in bacterial pneumonia versus COVID-19. e-f. Proportion of neutrophil states in bronchoalveolar microenvironment, separated by bacterial pneumonia and COVID-19 (e) and individual donors (f).
Extended Data Fig. 8
Extended Data Fig. 8. Dexamethasone alters global signaling topology and increased proportion of IFNactive neutrophils are associated with mortality.
a. Interaction heatmap summarizing differential number of incoming (top bar plot) and outgoing (right bar plot) cell-to-cell interactions following dexamethasone treatment. b-c. Global summary of number (b) and strength (c) of all interactions different immune cell types with and without dexamethasone. d. Neutrophil-driven signaling pathways enhanced and supressed with dexamethasone, identified using CellChat (MHC-I signaling filtered out). e-f. Unfiltered topology of annexin signaling without (e) and with dexamethasone (f) treatment. g. Schematic depicting outcomes in non-dexamethasone treated COVID-19 patients. Male 3 (M3) succumbed to disease. h-i. Proportion of neutrophils (h) and neutrophil states (i) in whole blood samples from individual donors (5 males, 3 females) at t1. j. Raw neutrophil state counts from the same 8 donors at t1.
Extended Data Fig. 9
Extended Data Fig. 9. Dexamethasone attenuates neutrophil response in a sexually dimorphic fashion.
a-b. ICU mortality rates of sex-separated patients with (a) or without COVID-19 (b) comparing pre-dexamethasone (January 2020 till May 31st, 2020) and post-dexamethasone (June 1st, 2020, till May 31st, 2021) standard of care time periods. c. Number of genes that are uniquely or jointly regulated with dexamethasone between males and females. d. Differential magnitude or direction of regulation within dexamethasone-induced DEGs jointly regulated by both sexes. e. Heatmap depicting dexamethasone-induced shifts in cellular composition at t1 and t2 and accompanying bar plots showing magnitude of divergence between male and female response. Dexamethasone-induced shifts in neutrophil state composition at t1 and t2 along with magnitude of divergence between male and female response. f. Module score of ISG signatures in ISG-active neutrophils across sex and dexamethasone treatment at t1 and t2. Statistical significance was assessed using an ANOVA test followed by bonferroni-corrected two‐sided pair-wise t-tests. * p-value < 0.05; ** p-value < 0.01; *** p-value < 0.001; ns p-value > 0.05. Absolute p-adjusted values are provided in Supplementary Table 8. Center line indicates median data point. g. Comparison of proportion of neutrophils in whole blood samples from sex-separated cohorts. h. Comparison of neutrophil composition across sex in dexamethasone-treated patients at 72 hours and 7 days post-ICU admission. i-j. Histograms depicting dynamo-calculated distribution of cell speed (length of velocity vectors) and acceleration (subspaces where velocity undergoes dramatic changes in magnitude or direction) of all IFN-active (i) and immature (j) neutrophils, separated by sex and dexamethasone treatment for both t1 and t2.
Extended Data Fig. 10
Extended Data Fig. 10. Immunofluorescence staining for neutrophil population markers.
Immunofluorescence representative images showing co-staining of Hoechst dye, anti-calprotectin (S100A8/A9), anti-IFITM1, and anti-CD24 antibodies on either leukocyte- or lymphocyte-enriched cytospin preparations from COVID-19+ve patients at t1 (a) or t2 (b). Rectangles highlight field of view shown in Fig. 1h (a) and Extended Data Fig. 6i (b). Representative images are shown; n = 3 for each group; Scale bar, 25 μm.

Comment in

References

    1. Matthay MA, et al. Acute respiratory distress syndrome. Nat. Rev. Dis. Prim. 2019;5:18. - PMC - PubMed
    1. Wang D, et al. Clinical characteristics of 138 hospitalized patients with 2019 novel coronavirus-infected pneumonia in Wuhan, China. JAMA. 2020;323:1061–1069. - PMC - PubMed
    1. Zhu N, et al. A novel coronavirus from patients with pneumonia in China, 2019. N. Engl. J. Med. 2020;382:727–733. - PMC - PubMed
    1. Middleton EA, et al. Neutrophil extracellular traps contribute to immunothrombosis in COVID-19 acute respiratory distress syndrome. Blood. 2020;136:1169–1179. - PMC - PubMed
    1. Veras, F. P. et al. SARS-CoV-2-triggered neutrophil extracellular traps mediate COVID-19 pathology. J. Exp. Med.217, e20201129 (2020). - PMC - PubMed

Publication types

MeSH terms