. 2022 Feb;14(2):115-133.
doi: 10.2217/imt-2021-0080. Epub 2021 Nov 16.

Safety levels of systemic IL-12 induced by cDNA expression as a cancer therapeutic

Affiliations

Safety levels of systemic IL-12 induced by cDNA expression as a cancer therapeutic

Constanza Savid-Frontera et al. Immunotherapy. 2022 Feb.

Abstract

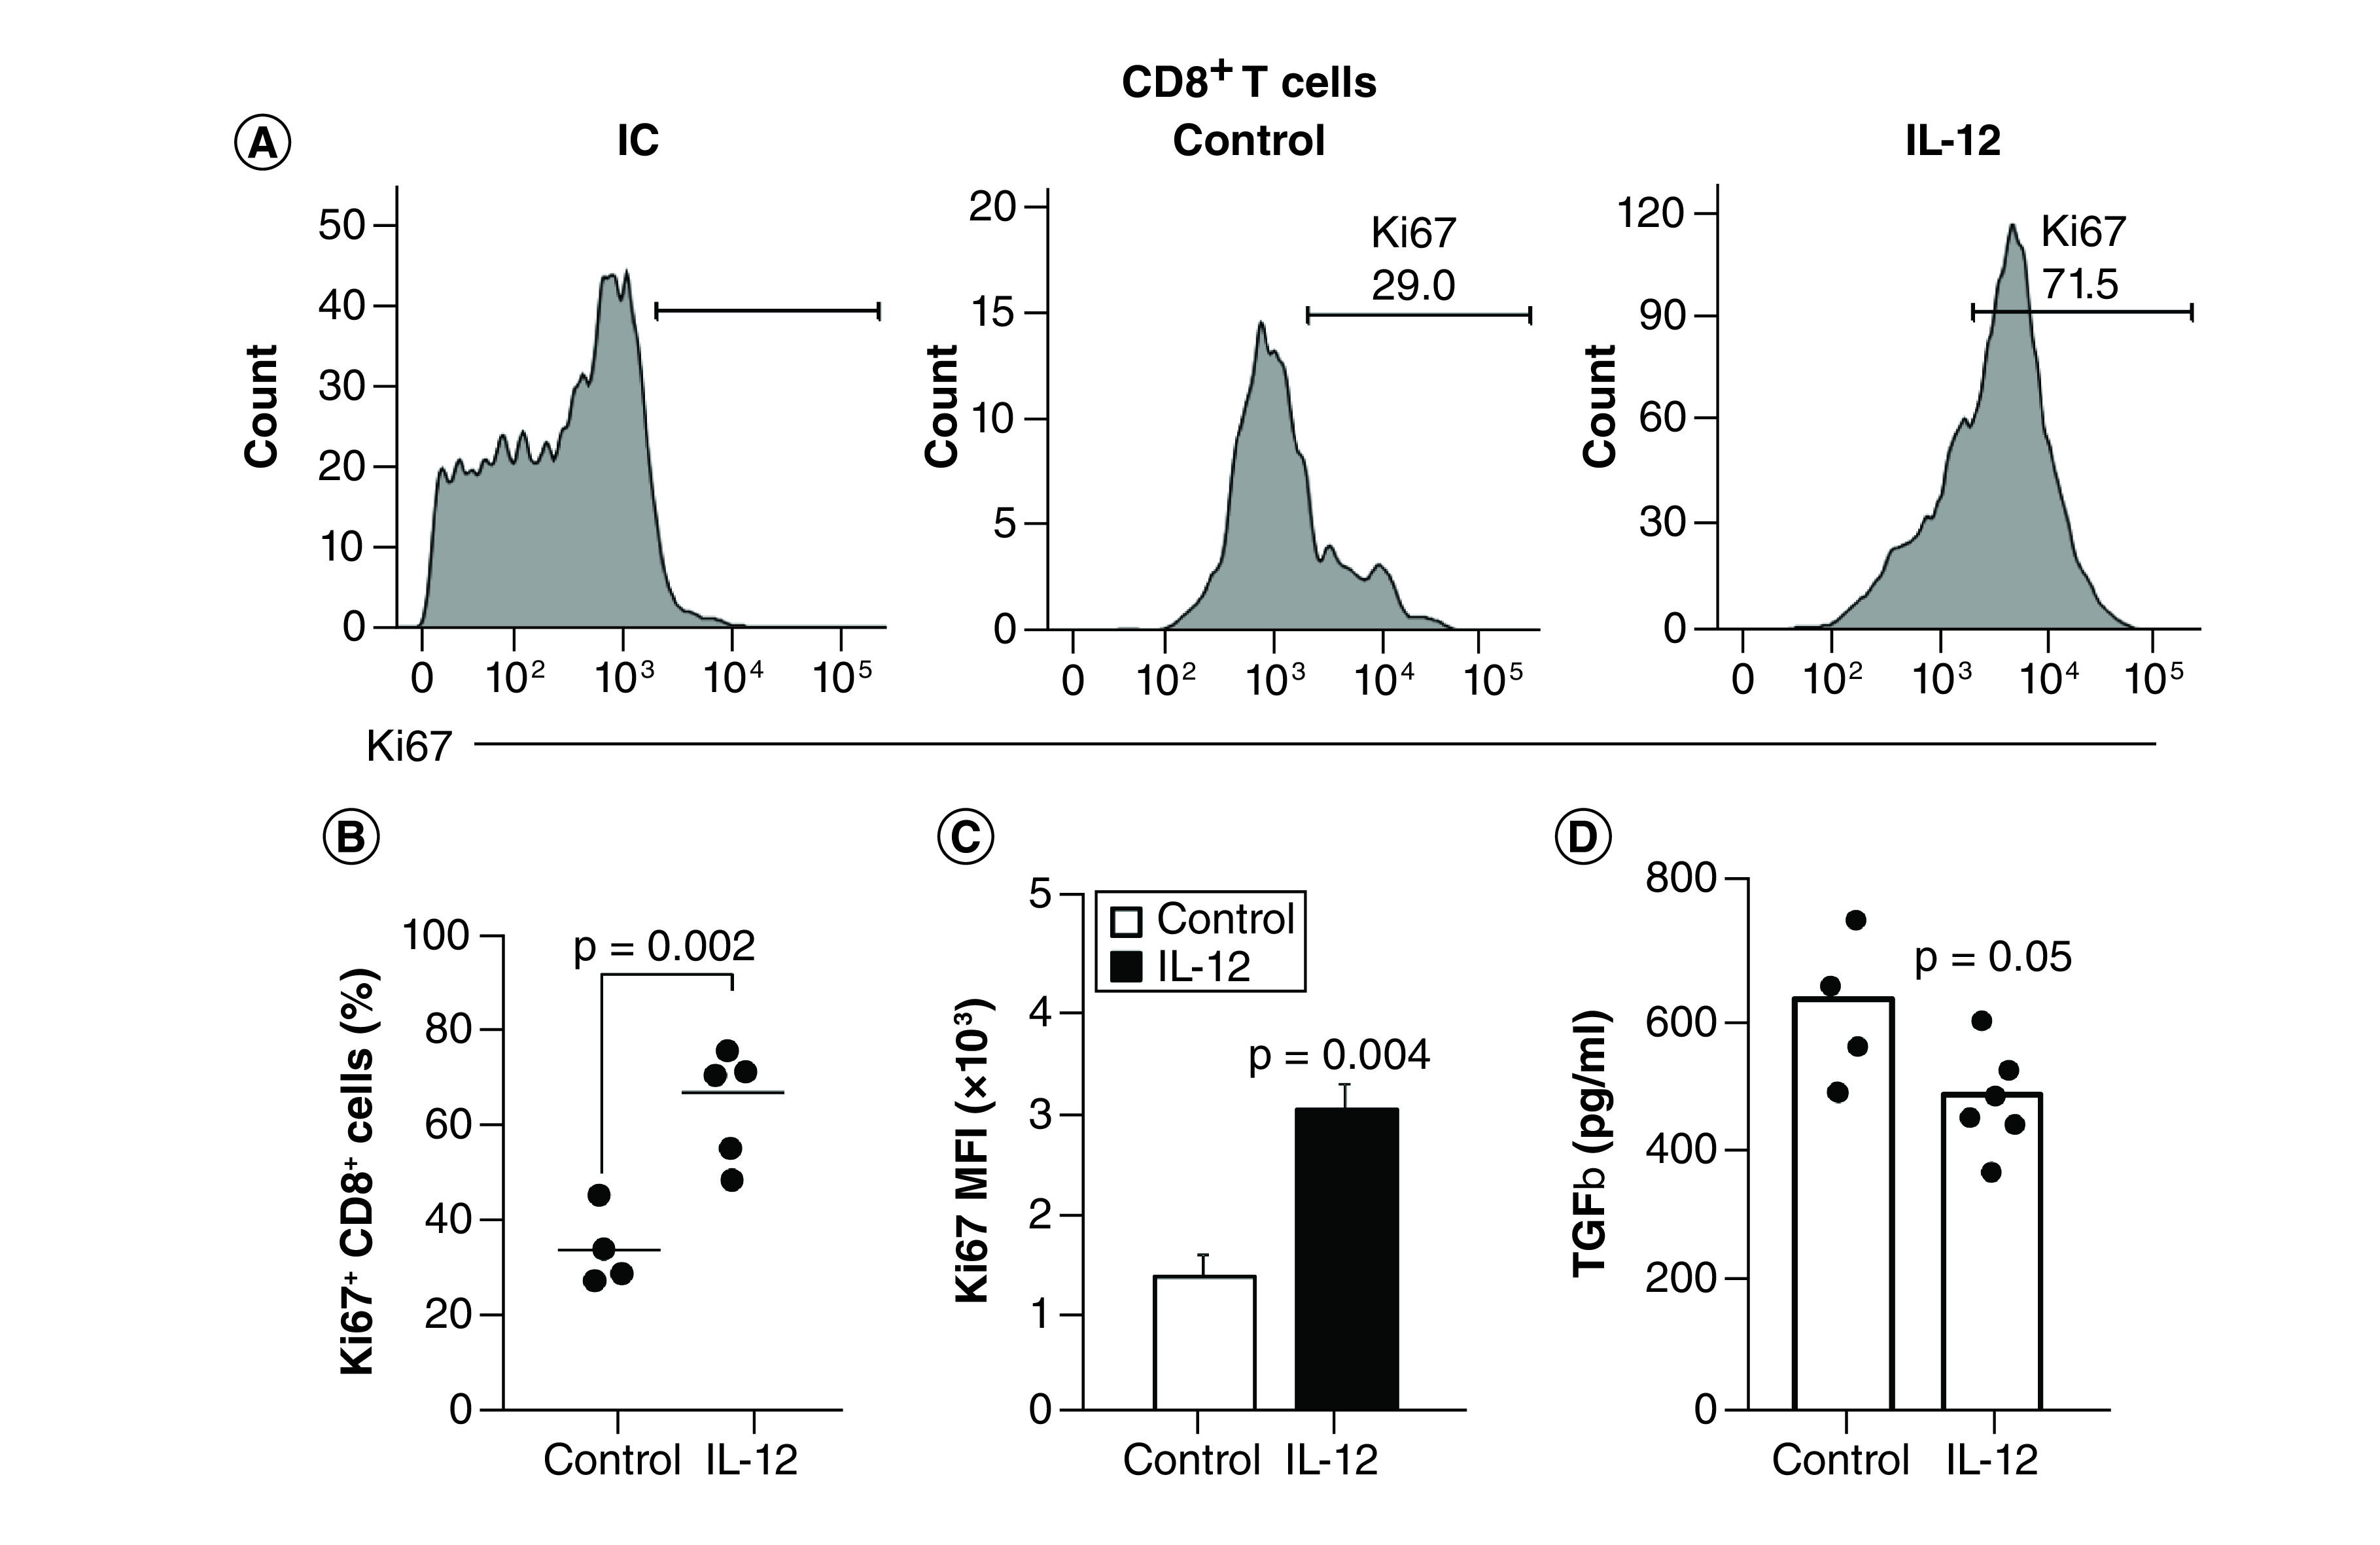
Aim: The aim of this work is to utilize a gene expression procedure to safely express systemic IL-12 and evaluate its effects in mouse tumor models. Materials & methods: Secondary lymphoid organs and tumors from EL4 and B16 tumor-bearing mice were analyzed by supervised and unsupervised methods. Results: IL-12 cDNA induced systemic IL-12 protein levels lower than the tolerated dose in patients. Control of tumor growth was observed in subcutaneous B16 and EL4 tumors. Systemic IL-12 expression induced a higher frequency of both total tumor-infiltrated CD45+ cells and proliferative IFN-γ+CD8+ T cells along with a lower frequency of CD4+FOXP3+ and CD11b+Gr-1+ cells. Conclusion: This approach characterizes the systemic effects of IL-12, helping to improve treatment of metastases or solid tumors.

Keywords: B16; CD8+ T cells; EL4; IFN-γ; cancer; hydrodynamic injection; immunotherapy; secondary lymphoid organs; systemic IL-12; tumor microenvironment.

Plain language summary

Lay abstract IL-12 has emerged as a potent cytokine in mediating antitumor activity in preclinical models of cancer. However, this antitumor response has not yet been translated into the clinic because of toxic side effects. The aim of our work is to analyze the effects of IL-12 in mouse tumor models. We demonstrate that one injection of IL-12 cDNA can induce systemic IL-12 levels in serum even lower than the tolerated dose in patients. At this dose, an efficient control of tumor growth can be observed. We found a higher frequency of both total tumor-infiltrated leukocytes and IFN-γ-producing CD8+ T cells along with a lower frequency of regulatory CD4+FOXP3+ and CD11b+Gr1+ cells. Our work demonstrates that IL-12 cDNA can safely be used to treat cancer.


Conflict of interest statement

Financial & competing interests disclosure

This project has been funded in whole or in part with Federal funds directly from the intramural research programs of the National Cancer Institute, CCR, LCIM under Contract no. HHSN261200800001E. Fundación para el Progreso de la Medicina GC N°1, Secretaria de Ciencia y Tecnología de la UNC (SeCyT-UNC). This project has been funded in part with federal funds from the Intramural Research Program of the Center for Cancer Research, National Cancer Institute (NCI): ZIA BC 009283. The authors have no other relevant affiliations or financial involvement with any organization or entity with a financial interest in or financial conflict with the subject matter or materials discussed in the manuscript apart from those disclosed.

No writing assistance was utilized in the production of this manuscript.

Figures

Figure 1.
Figure 1.. Increased killing capacity against YAC-1 cells of leukocytes obtained from liver or spleen from IL-12 mice.
Wild-type C57BL/6 mice were hydrodynamically injected with 5 μg of empty vector (control) or IL-12 cDNA and at different time points (days 1, 2, 3, 7, 10 and 50) livers and spleens were taken and leukocyte suspensions were generated. Cells were cocultured with CFSE+YAC-1 cells in a 1:1 ratio in supplemented RPMI 1640 medium for 30 min at 37°C and 5% CO2. Cells were washed, stained with 7AAD and annexin V and acquired by flow cytometry. (A) Representative histograms of YAC-1 cells from cocultures with splenocytes from a control or IL-12 mice. (B) Killing index was calculated for IL-12 cDNA-treated mice as (% of AnnV+CFSE+ cells) + (% of AnnV+ − 7AAD+CFSE+ cells) and normalized dividing each individual value from the IL-12 mice by the average of the control group for every day tested. Statistical analysis was performed with the Student t-test. Data represent the median of four independent experiments with three or four mice per group. *Control versus IL-12, p < 0.05. 7AAD: 7-aminoactinomicina D.
Figure 2.
Figure 2.. Systemic IL-12 expression significantly reduces subcutaneous EL4 and B16 tumor growth and the number of blood vessels inside the tumors.
Wild-type C57BL/6 mice were subcutaneously inoculated with 1 × 106 of either B16 or EL4 cells. When subcutaneous solid tumors were visible and palpable (4–5 mm), mice were hydrodynamically injected with 1 μg of an empty vector (control) or IL-12 cDNA. Then, 7 days after hydrodynamic injection, tumors were taken and processed according to each experiment. (A & B) EL4 or B16 tumors from control or IL-12 cDNA-treated mice were (A) macroscopically analyzed or (B) fixed, cut into 10-μm sections and incubated with a purified anti-PECAM antibody plus a secondary Alexa 546 antibody (EL4) or a purified anti-PECAM antibody plus a secondary Alexa 488 antibody + anti-CD45 Alexa 546 antibody (B16). Slides were analyzed under a FV1200 laser scanning confocal fluorescence microscope at 10× magnification, stained as follows: PECAM (red for EL4 and green for B16), CD45 (red only in B16) and 4′,6-diamidino-2-phenylindole (blue). (C) Tumor growth curves for EL4- and B16-bearing mice were evaluated until day 7 post-treatments and the results summarized as fold change. (D) On the day of euthanasia, subcutaneous EL4 and B16 tumors were removed and weighed using an analytical scale. (E) Individual values of tumor growth for each control or IL-12 cDNA-treated mouse. Data represent the median of two independent experiments with three or four mice per group. Statistical analysis was performed using the Student t-test. **p < 0.01; ****p < 0.0001. D: Day; PECAM: Platelet endothilial cell adhesion molecule.
Figure 3.
Figure 3.. Systemic IL-12 expression generates changes in spleen leukocyte distribution.
Foxp3-EGFP C57BL/6 mice were subcutaneously inoculated with 1 × 106 B16 cells. When solid tumors were visible, the mice were hydrodynamically injected with 1 μg of an empty vector (control) or IL-12 cDNA. Then, 7 days after hydrodynamic injection, the spleens were harvested and (A) pictures were taken to visualized splenomegaly. (B) Single-cell suspensions were obtained and cells were stained with Zombie Aqua Dye, CD4, CD8, B220, CD11b and Gr1 antibodies for flow cytometry analysis. Foxp3 expression was analyzed in the CD4 population based on enhanced green fluorescent protein detection. Dot plots show frequencies of each subpopulation analyzed from a control or IL-12 representative sample. Data represent the pool of three independent experiments with three–five mice per group. Statistical analysis was performed using the Student t-test. **p < 0.01; ***p < 0.001.
Figure 4.
Figure 4.. Systemic IL-12 expression generates changes in leukocyte distribution in tumor-draining and non-draining lymph nodes.
Foxp3-EGFP C57BL/6 mice were subcutaneously inoculated with 1 × 106 B16 cells. When solid tumors were visible, the mice were hydrodynamically injected with 1 μg of an empty vector (control) or IL-12 cDNA. Then, 7 days after hydrodynamic injection, both inguinal lymph nodes were taken, harvested, counted and stained with Zombie Aqua Dye, CD3, CD4, CD8, B220, CD11b and Gr1 antibodies for flow cytometry analysis. Foxp3 expression was analyzed in the CD4 population based on enhanced green fluorescent protein detection. Dot plots show frequencies of each subpopulation analyzed from a control or IL-12 representative sample. Data represent the pool of three independent experiments with three–five mice per group. Statistical analysis was performed using the Student t-test. *p < 0.05; **p < 0.01 (the statistical difference between controls and IL-12-treated mice for each type of lymph node). dLN: Draining lymph node; ndLN: Non-draining lymph node.
Figure 5.
Figure 5.. Systemic IL-12 expression generates a differential distribution of tumor-infiltrating leukocytes.
Foxp3-EGFP C57BL/6 mice were subcutaneously inoculated with 1 × 106 B16 cells. When solid tumors were visible, the mice were hydrodynamically injected with 1 μg of an empty vector (control) or IL-12 cDNA. Then, 7 days after hydrodynamic injection, B16 tumors were harvested and mechanically disrupted, and the resulting cell suspensions were stained with Zombie Aqua Dye, CD45, CD3, CD4, CD8, B220, CD11b and Gr1 antibodies for flow cytometry analysis. Foxp3 expression was analyzed in the CD4 population based on enhanced green fluorescent protein detection. Dot plots show frequencies of each subpopulation analyzed from a control or IL-12 representative sample. Data represent the pool of two independent experiments with three–five mice per group. Statistical analysis was performed using the Student t-test. *p < 0.05; **p < 0.01; ***p < 0.001 (the statistical difference of each parameter analyzed between control and IL-12-treated mice).
Figure 6.
Figure 6.. Differences in total cell numbers and cell survival between tumor draining and non-draining lymph nodes.
Wild-type C57BL/6 and Foxp3-EGFP C57BL/6 mice were subcutaneously inoculated with 1 × 106 B16 cells. When solid tumors were visible, the mice were hydrodynamically injected with 1 μg of an empty vector (control) or IL-12 cDNA. Then, 7 days after hydrodynamic injection, both inguinal lymph nodes were taken, harvested, counted and stained with Zombie Aqua. (A) Total cell number and (B) percentage of living cells (Zombieneg cells) for each sample and group are shown. (C) Representative dot plot of Zombie Aqua staining of the bulk of cells from the draining and non-draining lymph nodes of a control mouse. Statistical analysis was performed using the Student t-test. Data represent the pool of two independent experiments with three–five mice per group. dLN: Draining lymph node; ndLN: Non-draining lymph node; SSC: Side scatter.
Figure 7.
Figure 7.. IL-12 systemic expression does not affect the number of CCR5+CD8+ T cells but induces an increase in the percentage of IFN-γ+CD8+ T cells in B16 tumors.
Wild-type C57BL/6 mice were subcutaneously inoculated with 1 × 106 B16 cells. When solid tumors were visible, the mice were hydrodynamically injected with 1 μg of an empty vector (control) or IL-12 cDNA. Then, 7 days after hydrodynamic injection, B16 tumors were removed, mechanically disrupted and resuspended as 0.2 g of tumor/5 ml of supplemented medium, and (A, B & D) 600 μl of the suspension were seeded into a 96-well plate and cultured in supplemented media for 5 h in the presence of (A) phorbol-12-myristate-13-acetate/ionomycin, Brefeldin A and Monensin. Cells were surface stained with anti-CD45, CD3, CD4, CD8, CCR5 antibodies (or isotype control), washed, fixed, permeabilized and stained with an anti-IFN-γ and anti-CCR5 antobodies (or isotype control). (C) Splenocytes from control or IL-12 cDNA-treated mice were labeled with NK1.1 and NKp46 antibodies. (A & B) R.epresentative dot plots of IFN-γ production on CD8+ and NK cells (respectively). (E) CCR5+CD8+ T cells from control or IL-12 cDNA-treated mice; the mean + standard error of the mean of a pool of two independent experiments with four or five mice per group is displayed. (D) Represents the mean + standard error of the percentage of IFN-γ+CD8+ T cells or IFN-γ+NK cells. Statistical analysis was performed using the Student t-test. IC: Isotype control; NK: Natural killer.
Figure 8.
Figure 8.. CD8+ T cell proliferation in IL-12 cDNA-treated mice correlates with lower tumor TGF-β production.
Wild-type C57BL/6 mice were subcutaneously inoculated with 1 × 106 B16 cells. When solid tumors were visible, the mice were hydrodynamically injected with 1 μg of an empty vector (control) or IL-12 cDNA. Then, 7 days after hydrodynamic injection, B16 tumors were harvested, mechanically disrupted and cell suspensions were surface stained with (A) CD45, (B) CD3 and (C) CD8 antibodies, fixed, permeabilized and stained with an anti-Ki67 antibody (or IC), or (D) seeded into a 96-well plate and cultured in supplemented media for 5 h in an incubator at 37°C and 5% CO2 in the presence of phorbol-12-myristate-13-acetate/ionomycin. After the incubation time, supernatants were collected and frozen at -80°C for cytokine quantification by ELISA. (A) Representative histograms of isotype control or Ki67 expression in tumor-infiltrating CD8+ T cells. (B) Percentage or (C) mean fluorescence intensity expression of Ki67+ on CD8+ cells for each group. (D) TGF-β levels were determined by ELISA in culture supernatants. Statistical analysis was performed using the Student t-test. Data represent the pool of two independent experiments with three–five mice per group. IC: Isotype control.

Similar articles

Cited by

References

    1. Lasek W, Zagożdżon R, Jakobisiak M. Interleukin 12: still a promising candidate for tumor immunotherapy? Cancer Immunol. Immunother. 63(5), 419–435 (2014). - PMC - PubMed
    1. Tugues S, Burkhard SH, Ohs I et al. New insights into IL-12-mediated tumor suppression. Cell Death Differ. 22(2), 237–246 (2015). - PMC - PubMed
    1. Gerber SA, Moran JP, Frelinger JG, Frelinger JA, Fenton BM, Lord EM. Mechanism of IL-12 mediated alterations in tumour blood vessel morphology: analysis using whole-tissue mounts. Br. J. Cancer 88(9), 1453–1461 (2003). - PMC - PubMed
    1. Sorensen EW, Gerber SA, Frelinger JG, Lord EM. IL-12 suppresses vascular endothelial growth factor receptor 3 expression on tumor vessels by two distinct IFN-gamma-dependent mechanisms. J. Immunol. 184(4), 1858–1866 (2010). - PMC - PubMed
    1. Rodriguez-Galan MC, Reynolds D, Correa SG, Iribarren P, Watanabe M, Young HA. Coexpression of IL-18 strongly attenuates IL-12-induced systemic toxicity through a rapid induction of IL-10 without affecting its antitumor capacity. J. Immunol. 183(1), 740–748 (2009). - PMC - PubMed

Publication types