

Least-Squares Fitting of Multidimensional Spectra to Kubo Line-Shape Models
- PMID: 34783568
- PMCID: PMC8630800
- DOI: 10.1021/acs.jpcb.1c08764
Least-Squares Fitting of Multidimensional Spectra to Kubo Line-Shape Models
Abstract
We report a comprehensive study of the efficacy of least-squares fitting of multidimensional spectra to generalized Kubo line-shape models and introduce a novel least-squares fitting metric, termed the scale invariant gradient norm (SIGN), that enables a highly reliable and versatile algorithm. The precision of dephasing parameters is between 8× and 50× better for nonlinear model fitting compared to that for the centerline-slope (CLS) method, which effectively increases data acquisition efficiency by 1-2 orders of magnitude. Whereas the CLS method requires sequential fitting of both the nonlinear and linear spectra, our model fitting algorithm only requires nonlinear spectra but accurately predicts the linear spectrum. We show an experimental example in which the CLS time constants differ by 60% for independent measurements of the same system, while the Kubo time constants differ by only 10% for model fitting. This suggests that model fitting is a far more robust method of measuring spectral diffusion than the CLS method, which is more susceptible to structured residual signals that are not removable by pure solvent subtraction. Statistical analysis of the CLS method reveals a fundamental oversight in accounting for the propagation of uncertainty by Kubo time constants in the process of fitting to the linear absorption spectrum. A standalone desktop app and source code for the least-squares fitting algorithm are freely available, with example line-shape models and data. We have written the MATLAB source code in a generic framework where users may supply custom line-shape models. Using this application, a standard desktop fits a 12-parameter generalized Kubo model to a 106 data-point spectrum in a few minutes.
Conflict of interest statement
The authors declare no competing financial interest.
Figures


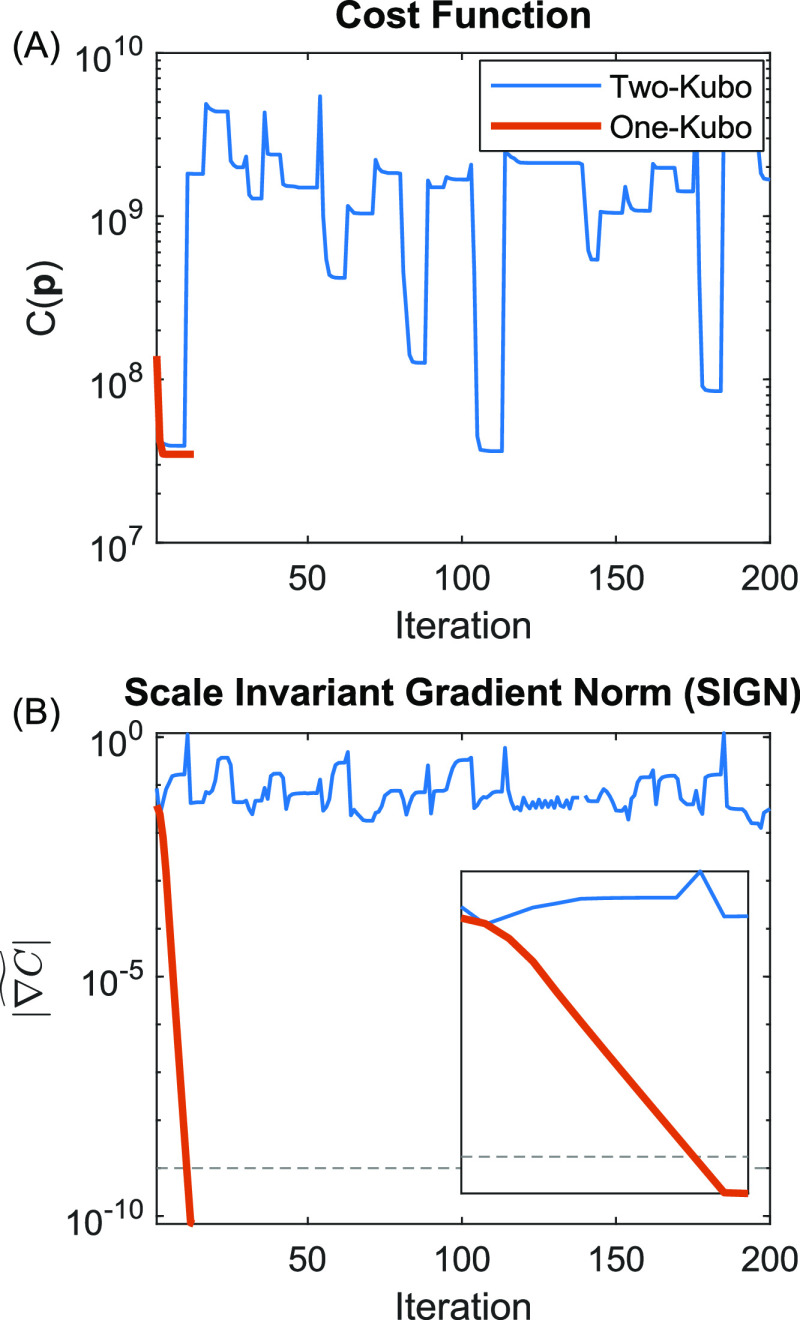


 versus fitting iteration for a series of
undersampled waiting time Tw. The dashed
line in panel (B) is associated with the stopping criterion.
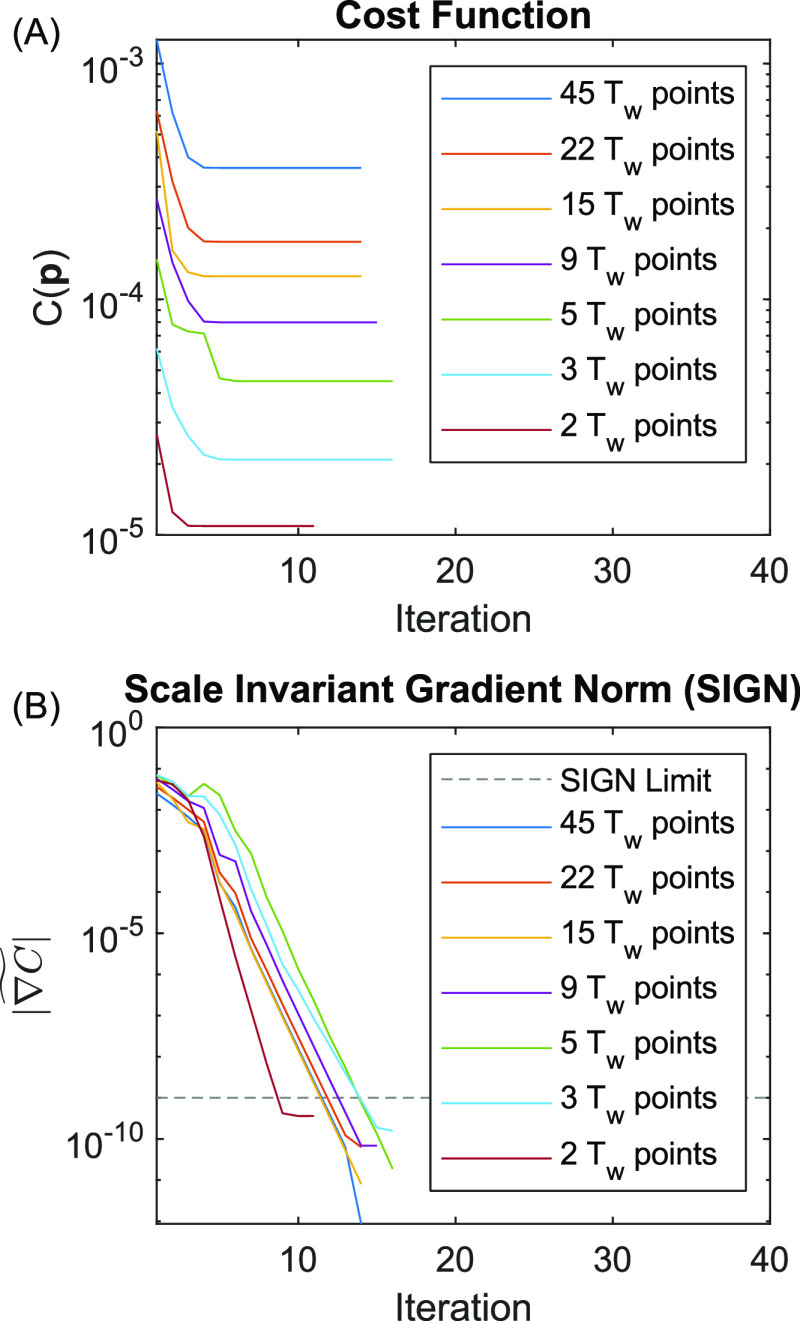
versus fitting iteration for a series of
undersampled waiting time Tw. The dashed
line in panel (B) is associated with the stopping criterion.
Similar articles
-
Effects of nonlinearities and uncorrelated or correlated errors in realistic simulated data on the prediction abilities of augmented classical least squares and partial least squares.Appl Spectrosc. 2004 Sep;58(9):1065-73. doi: 10.1366/0003702041959334. Appl Spectrosc. 2004. PMID: 15479523
-
Quantification of two-dimensional NOE spectra via a combined linear and nonlinear least-squares fit.J Biomol NMR. 1994 Sep;4(5):645-52. doi: 10.1007/BF00404275. J Biomol NMR. 1994. PMID: 7919951
-
Separable least squares identification of nonlinear Hammerstein models: application to stretch reflex dynamics.Ann Biomed Eng. 2001 Aug;29(8):707-18. doi: 10.1114/1.1385806. Ann Biomed Eng. 2001. PMID: 11556727
-
Evaluation of a direct 4D reconstruction method using generalised linear least squares for estimating nonlinear micro-parametric maps.Ann Nucl Med. 2014 Nov;28(9):860-73. doi: 10.1007/s12149-014-0881-2. Epub 2014 Jul 30. Ann Nucl Med. 2014. PMID: 25073760
-
Strategies and Considerations for Least-Squares Analysis of Total Scattering Data.ACS Omega. 2022 Apr 18;7(17):14402-14411. doi: 10.1021/acsomega.2c01285. eCollection 2022 May 3. ACS Omega. 2022. PMID: 35572759 Free PMC article. Review.
Cited by
-
An Evaluation of Maximum Determination Methods for Center Line Slope Analysis.J Phys Chem B. 2023 May 18;127(19):4268-4276. doi: 10.1021/acs.jpcb.2c07565. Epub 2023 May 9. J Phys Chem B. 2023. PMID: 37159840 Free PMC article.
-
Classification of Samples via Neural-Network Augmented Two-Dimensional Infrared Spectroscopy.J Phys Chem B. 2025 May 15;129(19):4738-4746. doi: 10.1021/acs.jpcb.4c08573. Epub 2025 May 1. J Phys Chem B. 2025. PMID: 40311107 Free PMC article.
-
Spectrophotometric Concentration Analysis Without Molar Absorption Coefficients by Two-Dimensional-Infrared and Fourier Transform Infrared Spectroscopy.Anal Chem. 2022 Dec 27;94(51):17988-17999. doi: 10.1021/acs.analchem.2c04287. Epub 2022 Dec 14. Anal Chem. 2022. PMID: 36516397 Free PMC article.
-
Two-Dimensional Infrared Spectroscopy Resolves the Vibrational Landscape in Donor-Bridge-Acceptor Complexes with Site-Specific Isotopic Labeling.ACS Phys Chem Au. 2024 Oct 29;4(6):761-772. doi: 10.1021/acsphyschemau.4c00073. eCollection 2024 Nov 27. ACS Phys Chem Au. 2024. PMID: 39634644 Free PMC article.
-
Increasing Pump-Probe Signal toward Asymptotic Limits.J Phys Chem B. 2023 Jun 1;127(21):4694-4707. doi: 10.1021/acs.jpcb.3c01270. Epub 2023 May 18. J Phys Chem B. 2023. PMID: 37200488 Free PMC article. Review.
References
-
- Kubo R.A Stochastic Theory of Line Shape. In Stochastic Processes in Chemical Physics; Wiley, 1969; Vol. 15, pp 101–127.
-
- Baiz C. R.; Błasiak B.; Bredenbeck J.; Cho M.; Choi J.-H.; Corcelli S. A.; Dijkstra A. G.; Feng C.-J.; Garrett-Roe S.; Ge N.-H.; et al. Vibrational spectroscopic map, vibrational spectroscopy, and intermolecular interaction. Chem. Rev. 2020, 120, 7152–7218. 10.1021/acs.chemrev.9b00813. - DOI - PMC - PubMed
-
- Hybl J. D.; Yu A.; Farrow D. A.; Jonas D. M. Polar solvation dynamics in the femtosecond evolution of two-dimensional Fourier transform spectra. J. Phys. Chem. A 2002, 106, 7651–7654. 10.1021/jp026047j. - DOI
Publication types
MeSH terms
Grants and funding
LinkOut - more resources
Full Text Sources
