. 2021 Nov 16:10:e72129.
doi: 10.7554/eLife.72129.

Standardizing workflows in imaging transcriptomics with the abagen toolbox

Affiliations

Standardizing workflows in imaging transcriptomics with the abagen toolbox

Ross D Markello et al. Elife. .

Abstract

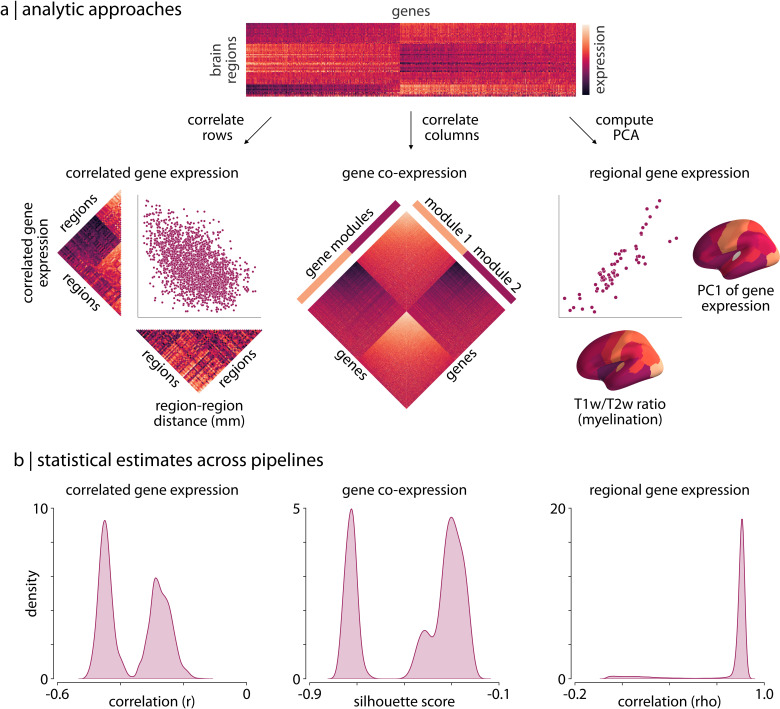
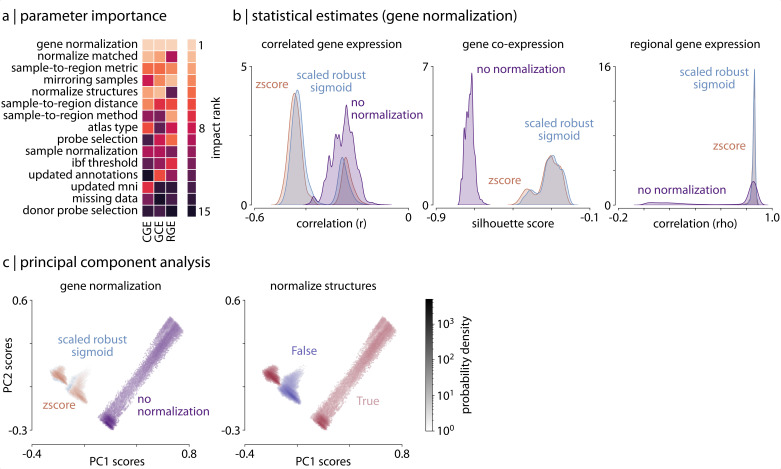
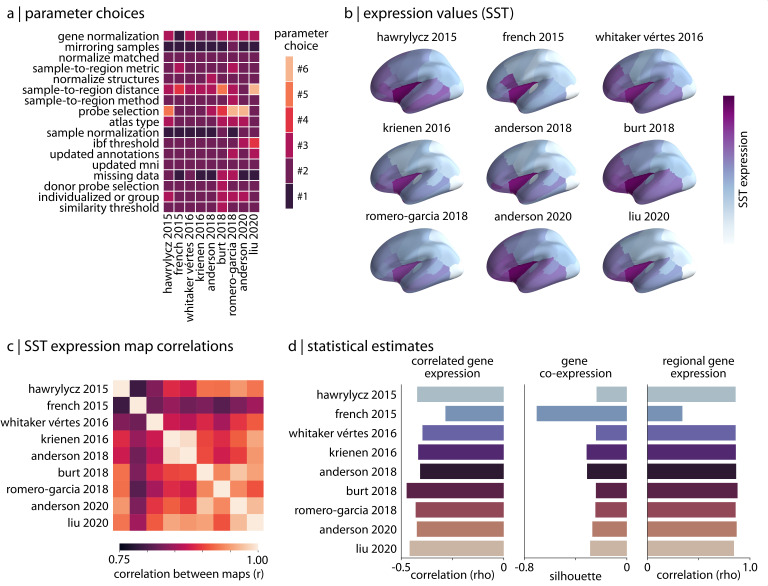
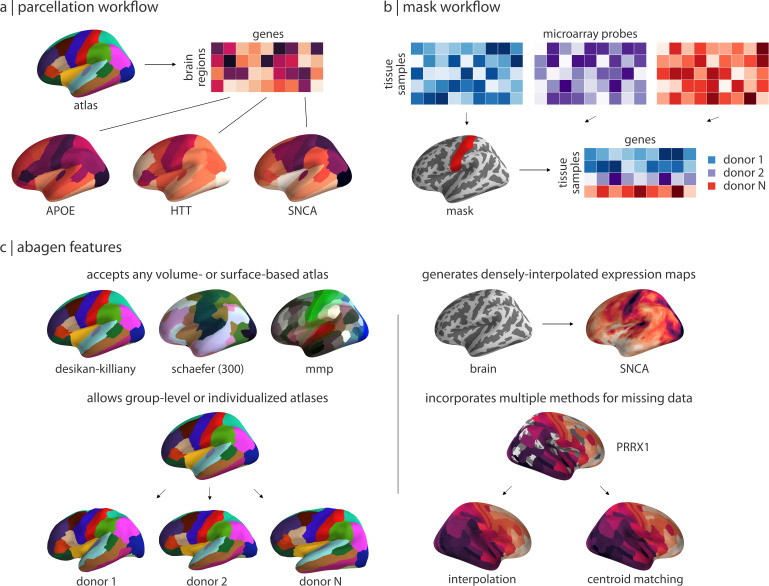
Gene expression fundamentally shapes the structural and functional architecture of the human brain. Open-access transcriptomic datasets like the Allen Human Brain Atlas provide an unprecedented ability to examine these mechanisms in vivo; however, a lack of standardization across research groups has given rise to myriad processing pipelines for using these data. Here, we develop the abagen toolbox, an open-access software package for working with transcriptomic data, and use it to examine how methodological variability influences the outcomes of research using the Allen Human Brain Atlas. Applying three prototypical analyses to the outputs of 750,000 unique processing pipelines, we find that choice of pipeline has a large impact on research findings, with parameters commonly varied in the literature influencing correlations between derived gene expression and other imaging phenotypes by as much as ρ ≥ 1.0. Our results further reveal an ordering of parameter importance, with processing steps that influence gene normalization yielding the greatest impact on downstream statistical inferences and conclusions. The presented work and the development of the abagen toolbox lay the foundation for more standardized and systematic research in imaging transcriptomics, and will help to advance future understanding of the influence of gene expression in the human brain.

Keywords: MRI; human; neuroimaging; neuroscience; processing variability; software; transcriptomics.


Conflict of interest statement

RM, AA, JP, BF, AF, BM No competing interests declared

Figures

Figure 1.
Figure 1.. Processing choices influence transcriptomic analyses.
(a) Examples of the three analyses used to assess differences in gene expression matrices generated by transcriptomic pipelines. First row: a depiction of the region-by-gene expression matrix generated from one of the 746,496 tested processing pipelines. Second row, left: we compute the correlation between rows of each matrix to generate a symmetric region × region CGE matrix. We then compute the correlation between the upper triangle of this CGE matrix and the upper triangle of a regional distance matrix to examine the degree to which CGE decays with increasing distance between regions (Arnatkeviciute et al., 2019). Second row, middle: we compute the Euclidean distance between columns of each matrix to generate a gene × gene GCE matrix. We use previously defined functional gene communities (Oldham et al., 2008) to compute a silhouette score for this GCE matrix to investigate whether genes within a module have more similar patterns of spatial expression than genes between modules. Second row, right: the first principal component is extracted from the RGE matrix. We compute the correlation between this principal component and the whole-brain T1w/T2w ratio (Burt et al., 2018) to understand how closely these maps covary across the brain. (b) The full statistical distributions from each of the three analyses for all 746,496 pipelines. Left panel: Spearman correlation values, ρ, from the CGE analyses. Middle panel: silhouette scores from the GCE analyses. Right panel: Spearman correlation coefficients, ρ, from the RGE analyses. CGE: correlated gene expression; GCE: gene co-expression; RGE: regional gene expression.
Figure 2.
Figure 2.. Parameter choice differentially impacts statistical estimates.
(a) Rank of the relative importance for each parameter (y-axis) across all three analyses (x-axis). Warmer colors indicate parameters that have a greater influence on statistical estimates. (b) Statistical distributions from the three analyses, shown as kernel density plots, separated by choice of gene normalization method (the most impactful parameter as shown in panel a). (c) Density plots of the statistical estimates for all 746,496 pipelines shown along the first two principal components, derived from the 746,496 (pipeline) x 3 (statistical estimates) matrix, representing how different the statistical estimates from each of the three analyses are relative to other pipelines. Left panel: pipelines are colored based on choice of gene normalization method, where each color represents 1/3 of the pipelines. Here, the pipelines in which no normalization was applied (purple) are distinguished from those in which some form of normalization was applied (blue and brown). Right panel: pipelines are colored based on whether gene normalization was performed within (True, red) or across (False, purple) structural classes (i.e. cortex, subcortex/brainstem, cerebellum; see Materials and methods: Gene expression pipelines for more information).
Figure 3.
Figure 3.. Reproducing published pipelines.
(a) Parameter choices used in the reproduction of published pipelines. Processing steps with categorical choices (e.g., gene normalization) were converted to numerical choices for display purposes only. These choices reflect the range of choices enumerated in Table 1. (b) Relative expression values of cortical somatostatin (SST) generated by each of the reproduced pipelines. Value ranges vary based on pipeline processing options. (c) The Pearson correlation between the cortical somatostatin (SST) maps generated by the nine pipelines shown in panel (b). (d) Statistical estimates from the three analyses described in Materials and methods: Analytic approaches applied to expression data from each of the published pipelines.
Figure 4.
Figure 4.. Workflows and features in the abagen toolbox.
(a) The primary workflow of abagen, used in the reported analyses, accepts a brain atlas and returns a parcellated brain-region-by-gene expression matrix. (b) An alternative abagen workflow accepts a regional mask and returns a processed tissue-sample-by-gene expression matrix, for all tissue samples from the six AHBA donors that fall within boundaries of the mask. (c) Examples of selected features from the abagen workflows and additional toolbox functionality. Top left: examples of some commonly-used atlases that can be employed with the parcellation workflow shown in panel (a). Bottom left: abagen can accept either standard atlases (i.e. in MNI space) or atlases defined in the space of the six individual donors from the AHBA. Top right: an additional workflow available in abagen can be used to generate densely-interpolated expression maps from AHBA data using a k-nearest neighbors interpolation algorithm. Bottom right: using high-resolution atlases in the parcellation workflow (panel a) may result in some parcels being assigned no expression data; abagen supports two methods for assigning values to such regions.
Figure 5.
Figure 5.. Annotated example abagen report.
Example of an automatically generated methods section report from the abagen toolbox. Processing steps are shown on the left and the relevant methods text—which is updated when these steps are modified—is shown in the same font color on the right. Reports also include a formatted reference section and relevant equations; these are not shown here for conciseness. Note that some processing steps (e.g. normalizing within structures, missing data handling) are omitted here because they are not run by default (see Supplementary file 1).

Similar articles

Cited by

References

    1. Allen Institute for Brain Science . Allen Institute Publications for Brain Science; 2013. https://help.brain-map.org/display/humanbrain/Documentation
    1. Anderson KM, Krienen FM, Choi EY, Reinen JM, Yeo BTT, Holmes AJ. Gene expression links functional networks across cortex and striatum. Nature Communications. 2018;9:1428. doi: 10.1038/s41467-018-03811-x. - DOI - PMC - PubMed
    1. Anderson KM, Collins MA, Chin R, Ge T, Rosenberg MD, Holmes AJ. Transcriptional and imaging-genetic association of cortical interneurons, brain function, and schizophrenia risk. Nature Communications. 2020a;11:2889. doi: 10.1038/s41467-020-16710-x. - DOI - PMC - PubMed
    1. Anderson KM, Collins MA, Kong R, Fang K, Li J, He T, Chekroud AM, Yeo BTT, Holmes AJ. Convergent molecular, cellular, and cortical neuroimaging signatures of major depressive disorder. PNAS. 2020b;117:25138–25149. doi: 10.1073/pnas.2008004117. - DOI - PMC - PubMed
    1. Arnatkeviciute A, Fulcher BD, Fornito A. A practical guide to linking brain-wide gene expression and neuroimaging data. NeuroImage. 2019;189:353–367. doi: 10.1016/j.neuroimage.2019.01.011. - DOI - PubMed

Publication types