. 2022 May;38(5):489-504.
doi: 10.1007/s12264-021-00790-w. Epub 2021 Nov 16.

Modulation of Spike Count Correlations Between Macaque Primary Visual Cortex Neurons by Difficulty of Attentional Task

Affiliations

Modulation of Spike Count Correlations Between Macaque Primary Visual Cortex Neurons by Difficulty of Attentional Task

Qiyi Hu et al. Neurosci Bull. 2022 May.

Abstract

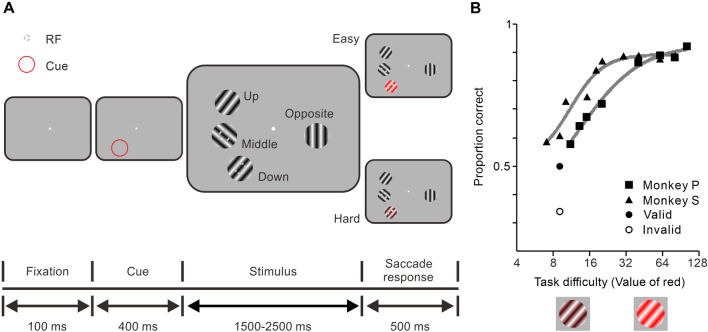
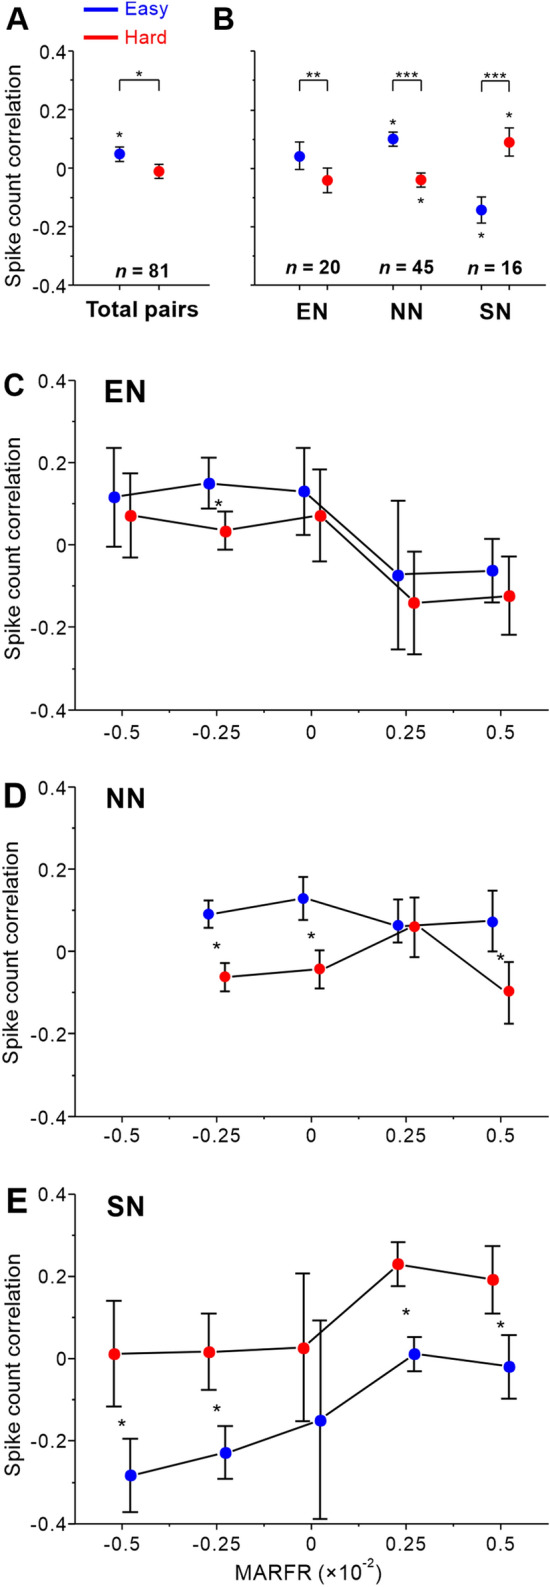
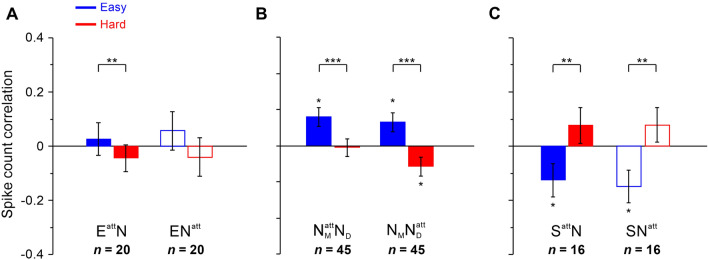
Studies have shown that spatial attention remarkably affects the trial-to-trial response variability shared between neurons. Difficulty in the attentional task adjusts how much concentration we maintain on what is currently important and what is filtered as irrelevant sensory information. However, how task difficulty mediates the interactions between neurons with separated receptive fields (RFs) that are attended to or attended away is still not clear. We examined spike count correlations between single-unit activities recorded simultaneously in the primary visual cortex (V1) while monkeys performed a spatial attention task with two levels of difficulty. Moreover, the RFs of the two neurons recorded were non-overlapping to allow us to study fluctuations in the correlated responses between competing visual inputs when the focus of attention was allocated to the RF of one neuron. While increasing difficulty in the spatial attention task, spike count correlations were either decreased to become negative between neuronal pairs, implying competition among them, with one neuron (or none) exhibiting attentional enhancement of firing rate, or increased to become positive, suggesting inter-neuronal cooperation, with one of the pair showing attentional suppression of spiking responses. Besides, the modulation of spike count correlations by task difficulty was independent of the attended locations. These findings provide evidence that task difficulty affects the functional interactions between different neuronal pools in V1 when selective attention resolves the spatial competition.

Keywords: Attentional load; Primary visual cortex; Rhesus monkey; Shared variability; Spatial attention.


Conflict of interest statement

The authors declare no conflicts of interest.

Figures

Fig. 1
Fig. 1
Behavioral task. A The color change detection task. Two rhesus monkeys were trained to fixate on a small white spot within a 1.6° window at the beginning each trial. After 100 ms of stable fixation, a thin red ring was displayed for 400 ms as the cue, which was the spatial location the monkeys should attend to covertly. Four sine gratings appeared simultaneously at different positions (Up, Middle, Down, and Opposite) with the preferred drifting directions. Each of the RFs of a pair of neurons recorded was covered by the stimulus at the positions Middle and Down, respectively. Following a uniformly randomized period of time (1.5–2.5 s), the color of the target grating at the cued location changed (either easy or hard to detect), and the animals were rewarded for success in detecting the color change and making a quick saccade to the target within 500 ms. B Performance curves across training sessions for both monkeys. Each point represents the average proportion of correct detections (based on daily sessions: n = 16, Monkey P: squares; n = 16, Monkey S: triangles) as a function of the red channel value (RGB format) of the target stimulus. Solid gray lines indicate curves fitted by the logistic function. The proportion correct at an equal value of the red channel (Monkey S, n = 3, Valid: 0.50; Invalid: 0.32) in test experiments in which color change occurred at the cued (circle) or non-cued (ring) position. The nature of task difficulty manipulation is illustrated by the pictograms below the horizontal axis, but not the actual color level used during the training and recording sessions.
Fig. 2
Fig. 2
Task difficulty and psychophysical performance. A Average proportion correct during easy (blue) and hard (red) tasks across recording sessions (Monkey P: n = 40; Monkey S: triangles, n = 37). B The performance of both monkeys improved in accuracy during the first 2 easy trials compared with the average level in easy task. C Histogram of the differences in accuracy between the first 2 easy trials and the average in the easy task across all recording sessions. Performance in the first 2 trials was better than the average level of the easy task in 70% of sessions. D Average reaction time during easy (blue) and hard (red) tasks across recording sessions. E, F Both monkeys also improved their performance in reaction time during the first 2 easy trials compared with the average level in the easy task across 71% of sessions. Error bars represent ±SEM. *P <0.05, paired t-test.
Fig. 3
Fig. 3
Parameters of electrophysiological recordings. A Histogram of the recording quality as the shape of the signal-to-noise ratio (SNRs) across all sessions (arrowhead, mean of the distribution). B Location of the fixation point (black circle) and averaged centers of RFs mapped in the lower visual fields: recorded from 6 electrodes in monkey P (squares) and from 23 electrodes in monkey S (triangles).
Fig. 4
Fig. 4
Responses of three neurons with different effects of attentional modulation (not measured in the same session). A Upper left panel, average waveform of a neuron (dark gray) and the noise (light gray) simultaneously recorded from the same electrode (shading, ±2 median absolute deviations). Lower left panel, the RF of the neuron. Middle panel, PSTHs of an E neuron spiking response when attention is directed to its RF (red solid line; EattN) and to the not significantly modulated neuron (red dashed line; ENatt) during the hard task. Right panel, E neuron spiking responses when attending to its RF (solid blue line) and to the not significantly modulated one (dashed blue line) during the easy task. The bar plots on the lower right corner of the PSTHs show the average firing rate. The responses shown occurred 600 ms before the color change, which included the last cycle of the drifting grating. B, C Examples of an S and an N neuron with the same configurations as in A. The contours of the mapped RFs are scaled to the responses of the excitation sub-region (+, light red) and inhibition (−, light blue) sub-region for each neuron. Scale bars, 1°. Error bars represent ±SEM. *P <0.05, paired t-test.
Fig. 5
Fig. 5
Attentional modulation during hard and easy tasks. A, B The total number of significantly attention-modulated neurons (enhanced: orange, suppressed: purple) is much higher during the hard task than the easy task (easy: 26, hard: 45, P = 0.0168, χ2 test). C, D Distribution of the attentional ratio difference between the hard and easy tasks. The attentional ratios during the hard task show a significant increase among enhanced neurons and a significant decrease among suppressed neurons (E: P = 1.51 × 10⁻⁷, n = 23; S: P = 3.31 × 10⁻⁶, n = 22, t-test). Only 2 neurons exhibit sign flips (black). Arrowheads, mean difference in attentional ratios.
Fig. 6
Fig. 6
The difficulty-related changes in spike count correlations depend on attentional modulation of the pairs. A Spike count correlations during the hard task decrease across all pairs. B Significant difficulty-related changes in spike count correlations among EN, SN, and NN pairs when one of their RFs is attended. CE The task difficulty either increased or decreased correlations among pairs depending on MARFR. Individual values of correlations from all recording sessions of two monkeys averaged as a function of MARFR. The bins do not overlap with a width of 2.5 × 10⁻². The correlations are significantly affected by task difficulty or significantly different from zero (transformed in z-score values, *P <0.05, **P <0.01, and ***P <0.001, t-test). Error bars represent ±SEM.
Fig. 7
Fig. 7
The difficulty-related changes in spike count correlations do not depend on the attended location. A Spike count correlations of pairs with one attention-enhanced neuron during easy (blue) and hard (red) tasks when attention is directed to their RFs (solid, attention-modulated) or another RF (hollow, not significantly modulated). B Spike count correlations of pairs with neurons not significantly attention-modulated showing significant difficulty-related changes when attending to one of the neurons’ RF. Subscript character (M or D) denotes which stimulus covered the RF of the neuron. C Spike count correlations of pairs with one attention-suppressed neurons during easy and hard tasks when attention is directed to their RFs or other RFs. Asterisks indicate that the correlations were significantly affected by task difficulty or significantly different from zero (transformed in z-score values, *P <0.05, **P <0.01, and ***P <0.001, t-test). Error bars, ±SEM.

Similar articles

Cited by

References

    1. Shadlen MN, Newsome WT. The variable discharge of cortical neurons: Implications for connectivity, computation, and information coding. J Neurosci. 1998;18:3870–3896. doi: 10.1523/JNEUROSCI.18-10-03870.1998. - DOI - PMC - PubMed
    1. Stettler DD, Das A, Bennett J, Gilbert CD. Lateral connectivity and contextual interactions in macaque primary visual cortex. Neuron. 2002;36:739–750. doi: 10.1016/S0896-6273(02)01029-2. - DOI - PubMed
    1. Ruff DA, Cohen MR. Attention increases spike count correlations between visual cortical areas. J Neurosci. 2016;36:7523–7534. doi: 10.1523/JNEUROSCI.0610-16.2016. - DOI - PMC - PubMed
    1. Abbott LF, Dayan P. The effect of correlated variability on the accuracy of a population code. Neural Comput. 1999;11:91–101. doi: 10.1162/089976699300016827. - DOI - PubMed
    1. Poort J, Roelfsema PR. Noise correlations have little influence on the coding of selective attention in area V1. Cereb Cortex. 2009;19:543–553. doi: 10.1093/cercor/bhn103. - DOI - PMC - PubMed

LinkOut - more resources