. 2021 Dec 22;6(24):e146362.
doi: 10.1172/jci.insight.146362.

CPVL promotes glioma progression via STAT1 pathway inhibition through interactions with the BTK/p300 axis

Affiliations

CPVL promotes glioma progression via STAT1 pathway inhibition through interactions with the BTK/p300 axis

Hui Yang et al. JCI Insight. .

Abstract

CPVL (carboxypeptidase, vitellogenic-like) is a serine carboxypeptidase that was first characterized in human macrophages. However, the function of CPVL remains unclear in a variety of tumors. The quantitative PCR (qPCR), Western blotting, and IHC assays were utilized to measure the CPVL expression. CPVL was significantly upregulated in glioma cells and tissues compared with normal cells and tissues, respectively. Moreover, high CPVL expression was correlated with advanced clinical grade and poor prognosis. Silencing of CPVL promoted glioma cell apoptosis, and it inhibited cell proliferation and tumorigenicity in vitro and in vivo. Ingenuity Pathway Analysis (IPA) demonstrated that CPVL silencing activated the IFN-γ/STAT1 signaling pathway, thereby inducing glioma cell apoptosis. Mechanistically, immunopurification, mass spectrometry, IP, and glutathione S-transferase (GST) pull-down experiments elucidated that CPVL physically interacts with Bruton's tyrosine kinase (BTK) and downregulates the STAT1 phosphorylation through promoting p300-mediated STAT1 acetylation. Our findings reveal the crucial role of CPVL in promoting the progression of glioma through suppressing STAT1 phosphorylation. CPVL might serve as a potential prognostic biomarker and therapeutic target for the treatment of glioma.

Keywords: Oncogenes; Oncology.


Figures

Figure 1
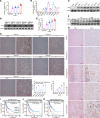
Figure 1. Gene expression profile analysis of CPVL in gliomas.
(A) Volcanic map of differentially expressed genes in 19 human glioma tissues and corresponding adjacent noncancerous tissues. Red dots are significantly differentially expressed genes, and gray dots are nonsignificantly differentially expressed genes. (B) Scatter plot of differentially expressed genes in 19 human glioma tissues and corresponding adjacent noncancerous tissues. The parallel green solid line is the difference reference line, and the points within the reference line represent the probe group with no significant change. Red points outside the reference line represent the probe group with relatively upregulated expression in the glioma tissues group, and green points represent the probe group with relatively upregulated expression in the adjacent noncancerous tissues group. (C) Clustering analysis of differentially expressed genes in 19 human glioma tissues and corresponding adjacent noncancerous tissues. Red indicates that the gene expression level is relatively upregulated, green indicates that the gene expression level is relatively downregulated, black indicates that there is no significant change in the gene expression, and gray indicates that the signal intensity of the gene is not detected. (DF) The effect of CPVL inhibition on cell proliferation was detected by high-content screening (HCS). The data are shown as mean ± SD. Total original magnification, 200×.
Figure 2
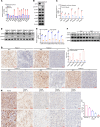
Figure 2. CPVL expression is upregulated in glioma and is associated with poor patient prognoses.
(A) Relative CPVL mRNA expression in normal brain specimens and glioma specimens of different clinical grades acquired from TCGA (n = 10 for normal, n = 100 for grade I, n =102 for grade II, n = 102 for grade III, n = 102 for grade IV). (B and C) The expression level of CPVL in normal brain cell (HEB and HBEC-5i) and glioma cell lines (U251, LN382, SHG44, A172, U118, T98G, and U87MG). (D) Western blotting analysis of CPVL expression in matched primary glioma tissues (T) and adjacent noncancerous tissues (ANT). The clinical grades of patientswere characterized (patient 1, grade II; patient 2, grade III; patient 3, grade I; patient 4, grade III; patient 5, grade IV). (E and F) The expression level of CPVL in normal brain specimens and glioma specimens of different clinical grades(n = 20 for normal, n = 45 for grade I, n = 78 for grade II, n = 32 for grade III, n = 24 for grade IV). (G) IHC staining analysis of CPVL protein expression in matched primary glioma tissues (T) and adjacent noncancerous tissues (ANT). Scale bars: 100 μm (200× magnification). (H) IHC staining analysis of CPVL protein expression in normal brain tissues and glioma tissues of different clinical grades. Scale bars: 100 μm (200× magnification, left panels) and 50 μm (400× magnification, right panels). Representative IHC images and IHC score quantification for CPVL are shown. (IK) Kaplan-Meier survival curves show overall survival (I), progression-free survival (J), disease-free survival (K) of high CPVL–expressing and low CPVL–expressing glioma patients from the TCGA database. The clinical grades of patients were characterized (patient 1, grade II; patient 2, grade III; patient 3, grade I; patient 4, grade III; patient 5, grade IV).All experiments were repeated 3 times. β-Actin was used as a loading control. Bar graph data are presented as mean ± SD. One-way ANOVA with Dunnett’s multiple comparisons test (A, B, E, and H), 2-tailed Student’s t test (G), and log-rank test (IK) analyses were performed. *P < 0.05.
Figure 3
Figure 3. CPVL silencing inhibits the proliferation, promotes apoptosis, and regulates cell cycle of glioma cells in vitro.
(A and B) Relative CPVL mRNA expression in U251 and LN382 cells expressing CPVL shRNA#1 and CPVL shRNA#2 determined by real-time PCR (n = 3). (C and D) Western blotting analysis of CPVL expression in CPVL-silenced U251 and CPVL-silenced LN382 cells (n = 3). (E and F) MTT assays were used to investigate the cell proliferation rates in CPVL-silenced U251 and CPVL-silenced LN382 cells (n = 3). (G and H) Colony formation assay was used to investigate the cell proliferation capacity of the CPVL-silenced U251 and CPVL-silenced LN382 cells. Representative pictures are shown on the left, and the number of colonies counted are shown on the right (n = 3). (I and J) FACS assay was used to detect the effect of cell apoptosis in CPVL-silenced U251 and CPVL-silenced LN382 cells (n = 3). Representative profiles are shown on the left, and the percentages of cells that were statistically analyzed are shown on the right. (K and L) Cell cycle assays were used to investigate the influence of CPVL silencing on cell cycle in CPVL-silenced U251 and CPVL-silenced LN382 cells (n = 3). The fractions of viable cells in the G1, S, and G2-M phases were quantified by flow cytometry. Representative profiles are shown on the left, and the percentages of cells that were statistically analyzed are shown on the right. All experiments were repeated 3 times. β-Actin was used as a loading control. Bar graph data are presented as mean ± SD. One-way ANOVA with Dunnett’s multiple comparisons test analyses were performed. *P < 0.05.
Figure 4
Figure 4. CPVL silencing inhibits the tumorigenicity of glioma cells in vivo.
(A) Xenograft model in nude mice. The indicated amount of glioma cells was inoculated into the nude mice (n = 10/group). Representative images of tumor growth. (B) Tumor volume growth curves (n = 10). (C) Mean tumor weights 28 days after inoculation (n = 10). (D) Bar graph of the total radiant efficiency of tumor grown from the inoculated glioma cells in BALB/c nude mice (n = 10). (E) Bar graph of the average radiant efficiency of tumor grown from the inoculated glioma cells in BALB/c nude mice (n = 10). (FH) The expression levels of cleaved caspase-3 and Ki-67 were determined in xenograft model tumor tissues using IHC (n = 10). (I) An illustration of the construction of glioma PDX mouse models. (J) The engrafted tumors in the shCtrl and shCPVL groups were harvested. The clinical grades of patients were characterized (patient 6, grade III; patient 7, grade IV). (K) Tumor volume growth curves of the engrafted tumors were plotted (n = 4). (L) Tumor weight of the engrafted tumors was recorded (n = 4). (MO) The expression levels of cleaved caspase-3 and Ki-67 were determined in PDX tumor tissues using IHC (n = 4). Scale bars: 100 μm (200× magnification) for panels. All data are presented as the mean ± SD. Two-tailed Student’s t test analyses were performed. *P < 0.05.
Figure 5
Figure 5. CPVL induces apoptosis of glioma cells via STAT1 signaling pathway.
(A) Relative IFN-γ/STAT1 signaling pathway downstream response gene mRNA expression in CPVL-silenced U251 cells determined by real-time PCR (n = 3). (B) Western blotting analysis of the IFN-γ/STAT1 signaling pathway downstream response genes’ protein expression in CPVL-silenced U251 cells. (C and D) Relative IFN-γ/STAT1 signaling pathway downstream response gene mRNA expression in matched primary glioma tissues (T, n = 60) and adjacent noncancerous tissues (ANT, n = 60). (E and F) The expression level of relative the IFN-γ/STAT1 signaling pathway downstream response genes in glioma specimens of low clinical grades and high clinical grades. (G) IHC staining analysis of the expression of p-STAT1 in matched primary cancer tissues (T) and adjacent noncancerous tissues (ANT). Representative IHC images (left) and IHC score quantification (right) for CPVL in tissue sections are shown. Scale bars: 100 μm (200× magnification). (H) IHC staining analysis of the expression of p-STAT1 in normal brain tissues and glioma tissues of different clinical grades. Representative IHC images (left) and IHC score quantification (right) for CPVL in tissue sections are shown. Scale bars: 100 μm (200× magnification, upper panels) and 50 μm (400× magnification, lower panels). The clinical grades of patients were characterized (patient 1, grade II; patient 2, grade III; patient 3, grade I; patient 4, grade III; patient 5, grade IV). All experiments were repeated 3 times. β-Actin was used as a loading control. Bar graph data are presented as mean ± SD. One-way ANOVA with Dunnett’s multiple comparisons test (H), and 2-tailed Student’s t test (A, C, E, and G) analyses were performed. *P < 0.05.
Figure 6
Figure 6. Rescue experiments verify that CPVL regulates apoptosis of glioma cells via the IFN-γ/STAT1 signaling pathway.
(A) MTT assays were used to investigate the cell proliferation rates of CPVL-silenced U251 cells treated with fludarabine compared with the control cells (n = 3). (B) Colony formation assay was used to investigate the cell proliferation capacity of CPVL-silenced U251 cells treated with fludarabine, compared with the control cells. Representative pictures are shown on the left, and the number of colonies counted is shown on the right (n = 3). (C) FACS assay was used to detect the effect of fludarabine treatment on cell apoptosis in CPVL-silenced U251 cells, compared with the control cells (n = 3). Representative profiles are shown on the left, and the percentages of cells that were statistically analyzed are shown on the right. (D) Cell cycle assays were used to investigate the influence of fludarabine treatment on the CPVL-silenced U251 cell cycle compared with the control cells (n = 3). The fractions of viable cells in the G1, S, and G2-M phases were quantified by flow cytometry. Representative profiles were shown on the left, and the percentages of cells that were statistically analyzed are shown on the right. All experiments were conducted in triplicate. Bar graph data are presented as the mean ± SD. Two-tailed Student’s t test analyses were performed.*P < 0.05.
Figure 7
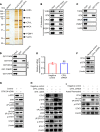
Figure 7. CPVL physically interacts with BTK to regulate the STAT1 phosphorylation through p300-mediated STAT1 acetylation.
(A) Immunoaffinity purification of CPVL-containing protein complex. Cellular extracts from U251 cells stably expressing FLAG vector or FLAG-CPVL were immunopurified with anti-FLAG affinity columns and eluted with FLAG peptide. These eluates were resolved by SDS-PAGE and were silver stained. (B) IP of whole-cell lysates from U251 cells followed by IB with antibodies against the indicated proteins. (C) GST pull-down assays with GST-fused CPVL and in vitro transcribed/translated TARA, BTK, MICA, PQBP1, or VAPA as indicated. (D) GST pull-down assays with the indicated GST-fused proteins and in vitro transcribed/translated CPVL. (E and F) U251 cells were transfected with a control shRNA or CPVL shRNA. The mRNA level of BTK and the protein levels of CPVL, BTK, and p-BTK were measured. (G) U251 cells were treated with control cDNA or BTK DN cDNA, and the protein levels of p-BTK, BTK, p300, PY20 (IP: p300), Ac-Lys (IP: STAT1), p-STAT1, and STAT1 were measured by Western blotting. (H) Rescue experiments were used to investigate whether the biological function of CPVL was mediated by regulating phosphorylation of BTK. U251 cells were transfected with CPVL shRNA or CPVL shRNA plus BTK cDNA compared with the control cells, and the protein levels of CPVL, p-BTK, BTK, p300, PY20 (IP: p300), Ac-Lys (IP: STAT1), p-STAT1, and STAT1 were measured by Western blotting. (I) Rescue experiments were used to investigate the STAT1 phosphorylation in CPVL-silenced U251 cells treated with acetylation activator, acetyl resveratrol, compared with the control cells, and the protein levels of CPVL, STAT1, Ac-Lys (IP: STAT1), and p-STAT1 were measured by Western blotting. All experiments were repeated 3 times. β-Actin was used as a loading control. Bar graph data are presented as mean ± SD. Two-tailed Student’s t test analyses were performed.

Similar articles

Cited by

References

    1. Siegel RL, et al. Cancer statistics, 2020. CA Cancer J Clin. 2020;70(1):7–30. doi: 10.3322/caac.21590. - DOI - PubMed
    1. Goodenberger ML, Jenkins RB. Genetics of adult glioma. Cancer Genet. 2012;205(12):613–621. doi: 10.1016/j.cancergen.2012.10.009. - DOI - PubMed
    1. Alexander BM, Cloughesy TF. Adult glioblastoma. J Clin Oncol. 2017;35(21):2402–2409. doi: 10.1200/JCO.2017.73.0119. - DOI - PubMed
    1. Louis DN, et al. The 2016 World Health Organization classification of tumors of the central nervous system: a summary. Acta Neuropathol. 2016;131(6):803–820. doi: 10.1007/s00401-016-1545-1. - DOI - PubMed
    1. Mallick S, et al. Therapeutic approach beyond conventional temozolomide for newly diagnosed glioblastoma: review of the present evidence and future direction. Indian J Med Paediatr Oncol. 2015;36(4):229–237. doi: 10.4103/0971-5851.171543. - DOI - PMC - PubMed

Publication types