. 2021 Dec 22;6(24):e146701.
doi: 10.1172/jci.insight.146701.

PD-1 blockade counteracts post-COVID-19 immune abnormalities and stimulates the anti-SARS-CoV-2 immune response

Affiliations

PD-1 blockade counteracts post-COVID-19 immune abnormalities and stimulates the anti-SARS-CoV-2 immune response

Cristian Loretelli et al. JCI Insight. .

Abstract

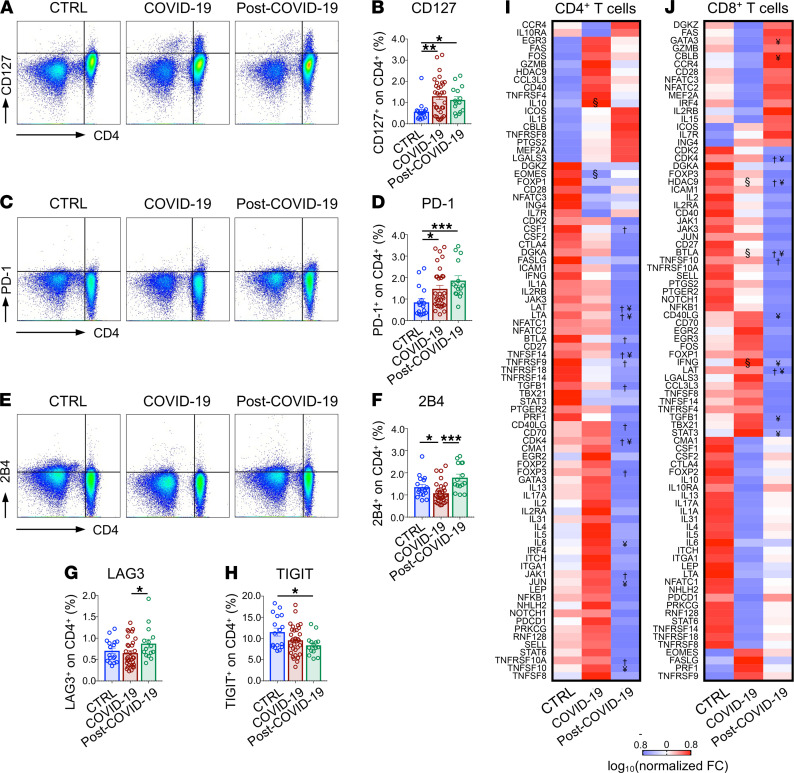
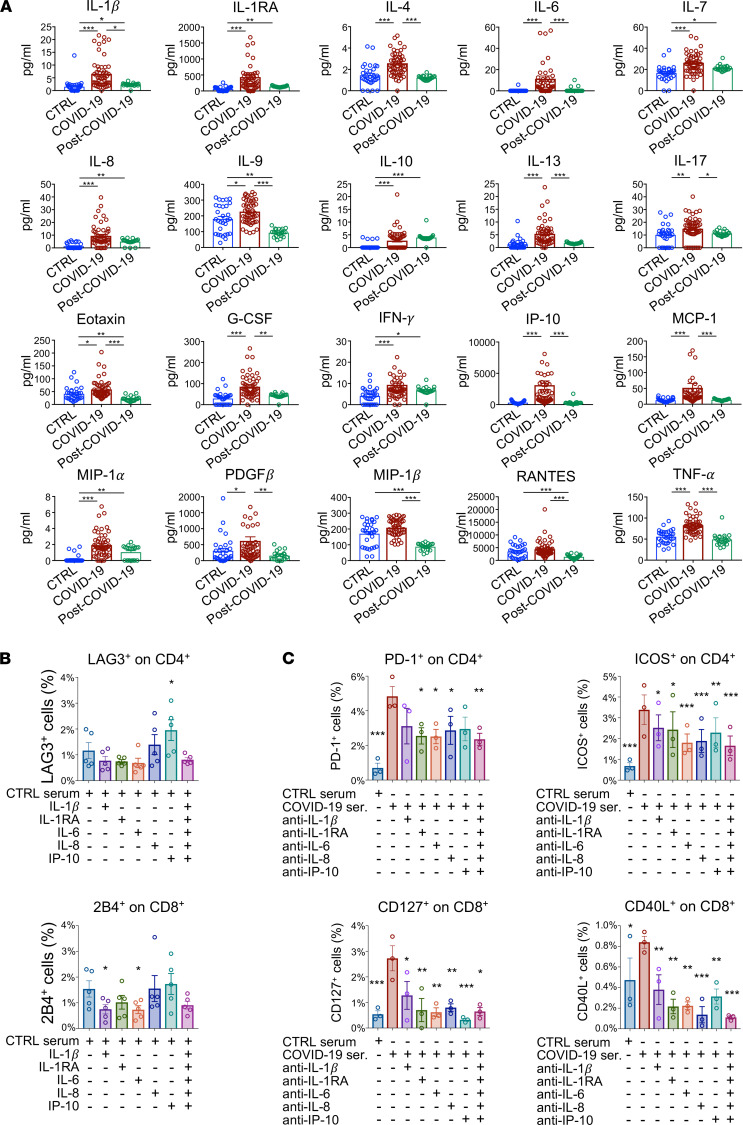
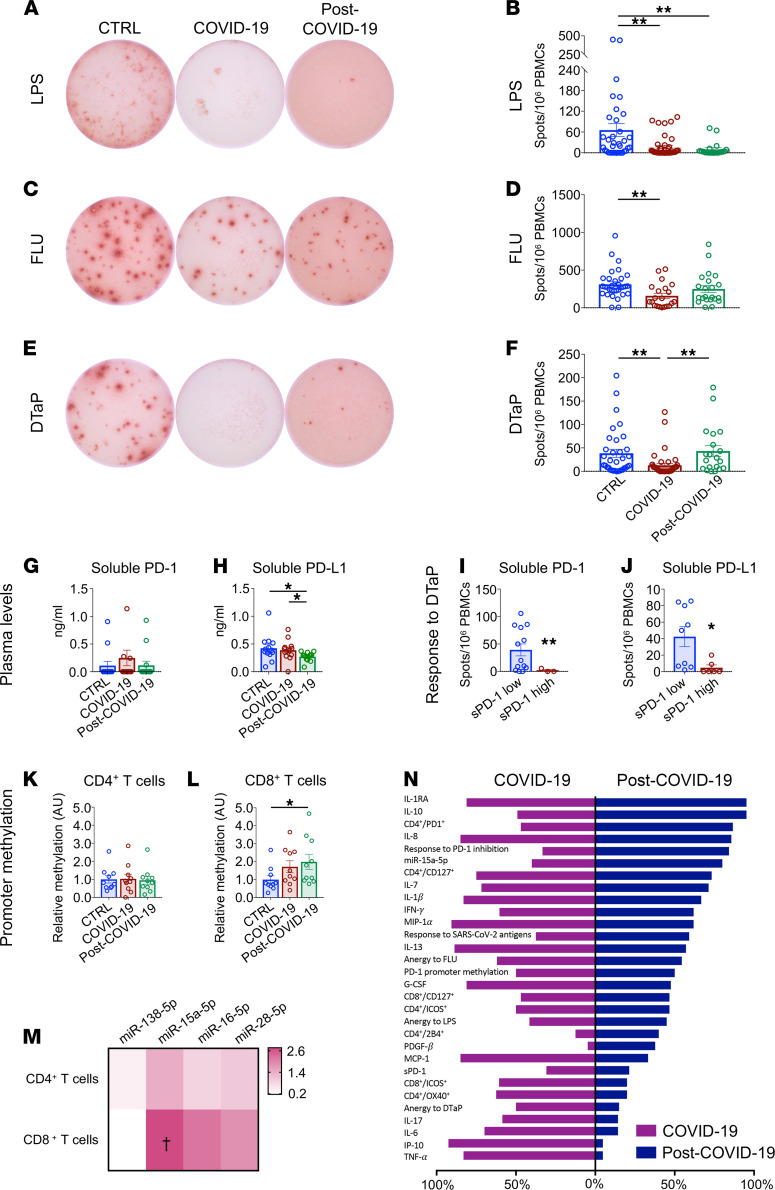
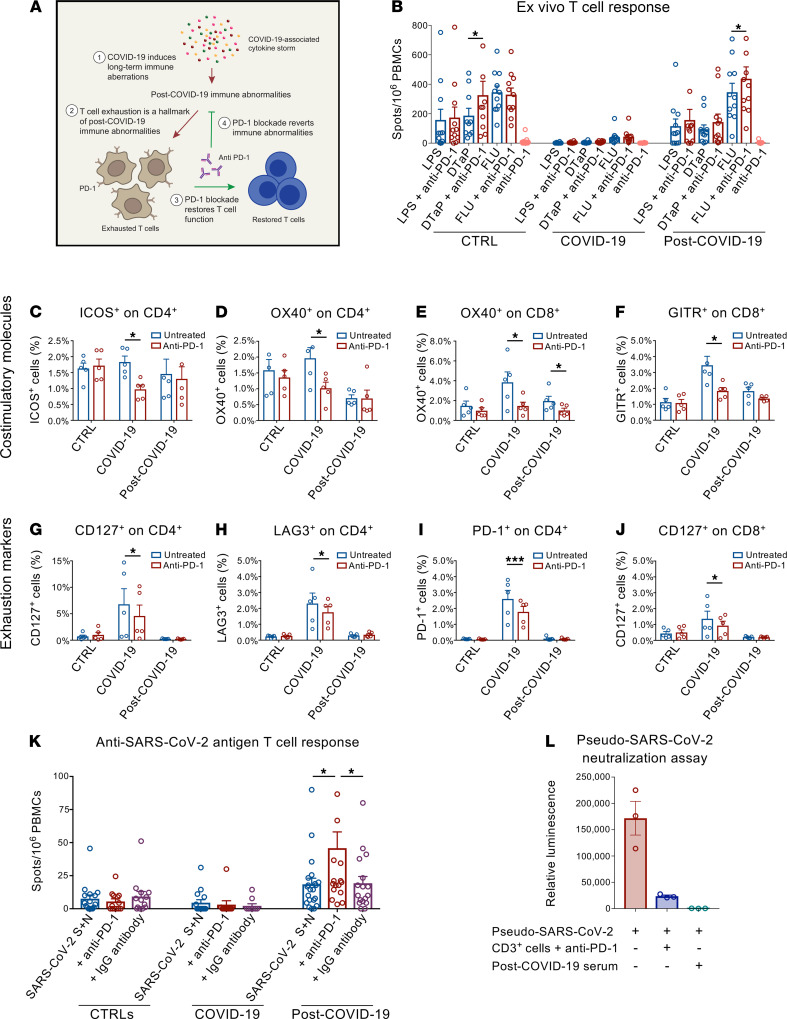
A substantial proportion of patients who have recovered from coronavirus disease-2019 (COVID-19) experience COVID-19-related symptoms even months after hospital discharge. We extensively immunologically characterized patients who recovered from COVID-19. In these patients, T cells were exhausted, with increased PD-1+ T cells, as compared with healthy controls. Plasma levels of IL-1β, IL-1RA, and IL-8, among others, were also increased in patients who recovered from COVID-19. This altered immunophenotype was mirrored by a reduced ex vivo T cell response to both nonspecific and specific stimulation, revealing a dysfunctional status of T cells, including a poor response to SARS-CoV-2 antigens. Altered levels of plasma soluble PD-L1, as well as of PD1 promoter methylation and PD1-targeting miR-15-5p, in CD8+ T cells were also observed, suggesting abnormal function of the PD-1/PD-L1 immune checkpoint axis. Notably, ex vivo blockade of PD-1 nearly normalized the aforementioned immunophenotype and restored T cell function, reverting the observed post-COVID-19 immune abnormalities; indeed, we also noted an increased T cell-mediated response to SARS-CoV-2 peptides. Finally, in a neutralization assay, PD-1 blockade did not alter the ability of T cells to neutralize SARS-CoV-2 spike pseudotyped lentivirus infection. Immune checkpoint blockade ameliorates post-COVID-19 immune abnormalities and stimulates an anti-SARS-CoV-2 immune response.

Keywords: Anergy; COVID-19; Immunology; Immunotherapy.


Conflict of interest statement

Conflict of interest: The authors have declared that no conflict of interest exists.

Figures

Figure 1
Figure 1. Immune signature of patients with COVID-19 and post–COVID-19 as compared with healthy controls.
(AH) Dot plot representations (A, C, and E) and bar graphs (B, D, and FH) depicting the percentage of CD127+, PD-1+, 2B4+, LAG3+, and TIGIT+ CD4+ T cells as assessed by flow cytometric analysis in the same patient groups. (I and J) Heatmap representation of exhaustion marker transcriptomic profiling of isolated CD4+ (I) and CD8+ (J) T cells isolated from patients with COVID-19 (n = 3), from those who recovered from COVID-19 (n = 3), and in healthy controls (n = 3). Data in all panels are reported as mean ± SEM, unless otherwise reported. §, COVID-19 versus CTRL; †, post–COVID-19 versus CTRL; ¥, post–COVID-19 versus COVID-19; *P < 0.05, **P < 0.01, ***P < 0.001 calculated with Kruskal-Wallis test (B, D, and FH) or with Spearman’s rank correlation method (I and J). CTRL, healthy controls; COVID-19, patients with COVID-19; post–COVID-19, patients who recovered from COVID-19; FC, fold change.
Figure 2
Figure 2. Cytokine profile and T cell exhaustion in patients who recovered from COVID-19 as compared with those with COVID-19 and with healthy controls.
(A) Bar graphs depicting cytokine serum levels assessed by Luminex-based technology in patients with COVID-19 (n = 50), in those who recovered from COVID-19 (n = 20), and in healthy controls (n = 30). (B) Bar graphs depicting the percentage of LAG3+ cells in the CD4+ T cell population and of 2B4+ cells in CD8+ T cells assessed by flow cytometric analysis in PBMCs of healthy controls (n = 5) that were treated ex vivo with selected proinflammatory cytokines, either individually or as a pool. (C) Bar graph depicting percentage of PD-1+ and ICOS+ CD4+ T cells and of CD127+ and CD40L+ CD8+ T cells as assessed by flow cytometric analysis of PBMCs isolated from patients with COVID-19 (n = 5) that were exposed ex vivo to medium containing serum of patients with COVID-19 in the presence of blocking antibodies directed against IL-1β, IL-1RA, IL-6, IL-8, or IP-10, added either individually or as a pool. Data are reported as mean ± SEM unless otherwise reported. *P < 0.05, **P < 0.01, ***P < 0.001 calculated with Kruskal-Wallis test (A) or 1-way ANOVA (B and C). CTRL, healthy controls; COVID-19, patients with COVID-19; post–COVID-19, patients who recovered from COVID-19.
Figure 3
Figure 3. T cells from patients who recovered from COVID-19 are exhausted.
(AF) Representative images and bar graphs of ELISpot analysis depicting IFN-γ spots produced by PBMCs isolated from patients with COVID-19 (n = 40), from those who recovered from COVID-19 (n = 20), and from healthy controls (n = 30) following challenge with LPS (A and B), FLU (C and D), and DTaP (E and F). (G and H). Bar graphs depicting soluble PD-1 and soluble PD-L1 plasma levels in patients with COVID-19 (n = 13), in those who recovered from COVID-19 (n = 13), and in healthy controls (n = 14). (I and J) Bar graphs depicting the immune T cell response upon DTaP stimulation in patients with COVID-19 with high (above the median) versus low (below the median) levels of soluble PD-1 (I) or PD-L1 (J). (K and L) Relative levels of PD-1 promoter DNA methylation in CD4+ (K) or CD8+ (L) T cells of patients with COVID-19 or after recovery as compared with healthy controls. (M) Heatmap showing color-coded relative levels of PD-1–targeting miR–138-5p, miR–15a-5p, miR–16-5p, and miR–28-5p miRNAs in CD4+ and CD8+ T cells of patients with COVID-19 and in those who recovered from COVID-19 (n = 10) normalized versus controls (n = 5). (N) Bar graph comparing the global immunological profiles of patients with COVID-19 after clinical symptom remission and during the acute phase of the disease. Each bar depicts the proportion of patients for which the value of the related factor is above the 75th percentile of the control group dataset. Data are expressed as mean ± SEM. *P < 0.05, **P < 0.01; P < 0.05 as compared with healthy controls, calculated with Kruskal-Wallis test (B, D, FH, K, and L) or 2-tailed unpaired t test (I, J, and M). CTRL, healthy controls; COVID-19, patients with COVID-19; post–COVID-19, patients who recovered from COVID-19; DTaP, diphtheria-tetanus-pertussis vaccine; FLU, flu vaccine; sPD-1, soluble PD-1; sPD-L1, soluble PD-L1; FC, fold change; A.U., arbitrary units.
Figure 4
Figure 4. PD-1 blockade restores T cell function and the anti–SARS-CoV-2 antiviral T cell response in vitro.
(A) Working hypothesis describing a PD-1 blockade–based strategy to reverse T cell exhaustion and restore the anti–SARS-CoV-2 immune response. (B) Bar graphs depicting the effect of PD-1 blockade on the number of IFN-γ spots produced by ELISpot analysis of PBMCs isolated from patients with COVID-19 (n = 40), from those who recovered from COVID-19 (n = 20) and from healthy controls (n = 35) following challenge with LPS, FLU, and DTaP, with or without anti–PD-1 blocking antibody. (CJ) Effect of PD-1 blockade on the proportion of the costimulatory markers ICOS and OX40 expressed by CD4+ T cells, GITR, and OX4 expressed by CD8+ T cells (CF); exhaustion markers CD127, LAG3, PD-1 expressed by CD4+ T cells; and CD127 expressed by CD8+ T cells (GJ) in PBMCs isolated from patients who recovered from COVID-19 (n = 5) cultured either alone or in the presence of anti–PD-1 bocking antibody. (K) Effect of PD-1 blockade on the number of IFN-γ spots by ELISpot analysis using PBMCs isolated from patients with COVID-19 (n = 40), from those who recovered from COVID-19 (n = 20), and from healthy controls (n = 35) following challenge with spike and nucleocapsid SARS-CoV-2 peptides, with anti–PD-1 bocking antibody or with anti–human IgG antibody. (L) Efficient T lymphocyte–dependent neutralization of spike SARS-CoV-2 pseudotyped lentivirus by CD3+ T cells following PD-1 blockade as assessed by luminescence-based neutralization assay (n = 5). Serum of patients who recovered from COVID-19 was used as control. Data are expressed as mean ± SEM. *P < 0.05, ***P < 0.001 calculated with 2-tailed paired t test (BJ) or 1-way ANOVA (K and L). CTRL, healthy controls; COVID-19, patients with COVID-19; post–COVID-19, patients who recovered from COVID-19; DTaP, diphtheria-tetanus-pertussis vaccine; FLU, flu vaccine; SARS-CoV-2 S+N, SARS-CoV-2 spike and nucleocapsid peptide pool.

Similar articles

Cited by

References

    1. Carfi A, et al. Persistent symptoms in patients after acute COVID-19. JAMA. 2020;324(6):603–605. doi: 10.1001/jama.2020.12603. - DOI - PMC - PubMed
    1. Nalbandian A, et al. Post-acute COVID-19 syndrome. Nat Med. 2021;27(4):601–615. doi: 10.1038/s41591-021-01283-z. - DOI - PMC - PubMed
    1. Chopra V, et al. Sixty-day outcomes among patients hospitalized With COVID-19. Ann Intern Med. 2021;174(4):576–578. doi: 10.7326/M20-5661. - DOI - PMC - PubMed
    1. Huang C, et al. 6-month consequences of COVID-19 in patients discharged from hospital: a cohort study. Lancet. 2021;397(10270):220–232. doi: 10.1016/S0140-6736(20)32656-8. - DOI - PMC - PubMed
    1. Montefusco L, et al. Acute and long-term disruption of glycometabolic control after SARS-CoV-2 infection. Nat Metab. 2021;3(6):774–785. doi: 10.1038/s42255-021-00407-6. - DOI - PMC - PubMed

Publication types

MeSH terms