. 2021 Dec 7;33(12):2445-2463.e8.
doi: 10.1016/j.cmet.2021.10.015. Epub 2021 Nov 15.

Efferocytosis induces macrophage proliferation to help resolve tissue injury

Affiliations

Efferocytosis induces macrophage proliferation to help resolve tissue injury

Brennan D Gerlach et al. Cell Metab. .

Abstract

Apoptotic cell clearance by macrophages (efferocytosis) promotes resolution signaling pathways, which can be triggered by molecules derived from the phagolysosomal degradation of apoptotic cells. We show here that nucleotides derived from the hydrolysis of apoptotic cell DNA by phagolysosomal DNase2a activate a DNA-PKcs-mTORC2/Rictor pathway that increases Myc to promote non-inflammatory macrophage proliferation. Efferocytosis-induced proliferation expands the pool of resolving macrophages in vitro and in mice, including zymosan-induced peritonitis, dexamethasone-induced thymocyte apoptosis, and atherosclerosis regression. In the dexamethasone-thymus model, hematopoietic Rictor deletion blocked efferocytosing macrophage proliferation, apoptotic cell clearance, and tissue resolution. In atherosclerosis regression, silencing macrophage Rictor or DNase2a blocked efferocyte proliferation, apoptotic cell clearance, and plaque stabilization. In view of previous work showing that other types of apoptotic cell cargo can promote resolution in individual efferocytosing macrophages, the findings here suggest that signaling-triggered apoptotic cell-derived nucleotides can amplify this benefit by increasing the number of these macrophages.

Keywords: DNase2a; Erk1/2 signaling; MerTK; Myc; atherosclerosis; efferocytosis; inflammation resolution; mTORC2/Rictor; macrophage; macrophage proliferation.


Conflict of interest statement

Declaration of interests The authors declare no competing interests.

Figures
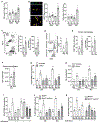
Figure 1.
Figure 1.. Efferocytosis Induces Macrophage Proliferation
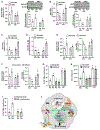
Bone marrow-derived macrophages (BMDMs) were incubated with DiD-labeled apoptotic Jurkat cells (ACs) for 45 minutes (45 min), followed by rinsing to remove unengulfed ACs and then harvesting immediately or after an addition 24-hour incubation in the absence of ACs (24 hr) unless otherwise specified. (A) BMDMs from both timepoints were stained with DAPI, and cell number/field of view was assessed by counting DAPI-stained DiD (AC) and DiD+ (AC+) macrophages (n = 11 biological replicates). (B) Left, Fluorescence microscopic images of BMDMs harvested after 45 minutes (top) or 24 hours (bottom). Yellow arrows identify DiD+ (AC+) Ki67+ macrophages. Scale bar, 50 μm. Middle, percentage of Ki67+ macrophages within the AC and AC+ macrophage subpopulations. Right, AC and AC+ macrophage numbers/field of view. For both analyses, n = 10 biological replicates. (C) BMDMs were pre-labeled with EdU and then assayed by flow cytometry at the 24-hour timepoint for the percentage of EdU+ macrophages within the AC and AC+ macrophages (left and middle) and for AC and AC+ macrophage numbers (right) (n = 5-6 biological replicates). (D) BMDMs were pre-labeled with CFSE for 15 minutes and then assayed by flow cytometry at the 24-hour timepoint for the percentage of macrophages in each group that doubled, calculated from the decrease in CSFE fluorescence (n = 3 biological replicates). (E) Human monocyte-derived macrophages (HMDMs) were used instead of BMDMs and assayed by flow cytometry at the 24-hour timepoint for the percentage of Ki67+ cells within AC and AC+ macrophages (left) and for AC and AC+ macrophage numbers (right) (n = 3 biological replicates). (F) HMDMs were incubated for 45 minutes ± ACs and assayed for the number of cells/well; dotted line indicates cell number at the beginning of the experiment (n = 3 biological replicates). (G) BMDMs transfected with siRbcn or scrambled RNA control and labeled with EdU were harvested after the 24-hour timepoint or at 48 hours after removal of the labeled ACs and then assayed for the percentage of EdU+ macrophages (n = 3 biological replicates). (H) BMDMs transfected with siRbcn or scrambled RNA were incubated ± unlabeled ACs and quantified for cell number/well; dotted line indicates cell number at the beginning of the experiment (n = 3 biological replicates). (I) Groups 1-4, BMDMs pre-treated with bafilomycin and labeled with EdU were harvested 18 hours after labeled-AC removal and assayed for the percentage of EdU+ macrophages. Groups 5-8, BMDMs were incubated with CSF1 or Gas6 for 18 hours instead of ACs and assayed as above (n = 3 biological replicates). (J) BMDMs from Mertkfl/fl or Mertkfl/fl Lyz2Cre+/− mice were labeled with EdU were harvested at 24- or 48-hour timepoints and assayed for the percentage of EdU+ macrophages. (K) BMDMs from Mertkfl/fl or Mertkfl/fl Lyz2Cre+/− mice were pre-treated with bafilomycin and labeled with EdU were harvested at 24- or 48-hour timepoints and assayed for the percentage of EdU+ macrophages (n = 3 biological replicates). All values are means ± SEM; letters that are different indicate statistical significance at p<0.05.
Figure 2.
Figure 2.. Degradation of AC-derived Oligonucleotides Activate DNA-PKcs and mTORC2 Activity to Promote EIMP
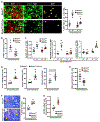
The standard conditions are as in Figure 1 unless noted otherwise. (A) BMDMs were incubated for 45 minutes with DiD-labeled (left) or pHrodo-labeled (right) ACs, IgG-coated ACs, or IgG-coated RBCs. At the 24-hour timepoint, the macrophages were quantified by flow cytometry for the percentage of EdU+ macrophages (n = 3 biological replicates). (B) Groups 1-4, BMDMs transfected with siDnase2a or scrambled RNA and labeled with EdU were assayed at the 24-hour timepoint for the percentage of EdU+ macrophages. Groups 5-6, BMDMs were incubated with CSF1 for 24 hours instead of ACs and assayed as above (n = 3 biological replicates). (C) BMDMs transfected with siDnase2a or scrambled RNA and labeled with EdU were incubated with IgG-RBCs or IgG-RBCs containing salmon sperm DNA and assayed at the 24-hour timepoint for the percentage of EdU+ macrophages (n = 3 biological replicates). (D) BMDMs transfected with siPrkdc or scrambled RNA and labeled with EdU were assayed at the 24-hour timepoint for the percentage of EdU+ macrophages (n = 3 biological replicates). (E) BMDMs transfected with siDnase2a or scrambled RNA were incubated for 1 hour ± ACs. Lysates were immunoblotted for phospho-Thr2609-DNA-PKcs and total DNA-PKc; the graph shows the phospho:total DNA-PKcs densitometric ratio, expressed relative to No ACs/Scramble control (n = 3 biological replicates). (F) Pair groups 1-2, BMDMs transfected with siRictor or scrambled RNA and labeled with EdU were incubated assayed at the 24-hour timepoint for the percentage of EdU+ macrophages. Pair group 3, BMDMs were incubated with CSF1 for 24 hours instead of ACs and assayed as above (n = 3 biological replicates). (G) BMDMs transfected with scrambled RNA or siDnase2a were incubated for 1 hour ± ACs. Lysates were immunoblotted for phospho-Ser473-Akt and total Akt, with quantification (n = 3 biological replicates). (H) BMDMs transfected with scrambled RNA or siPrkdc were incubated for 1 hour ± ACs. Lysates were immunoblotted for phospho-Ser473-Akt and total Akt, with quantification (n = 3 biological replicates). (I) BMDMs treated with vehicle or the Akt inhibitor MK-2206 for 2h and then labeled with EdU were assayed at the 24-hour timepoint for the percentage of EdU+ macrophages (n = 3 biological replicates). All values are means ± SEM; letters that are different indicate statistical significance at p<0.05.
Figure 3.
Figure 3.. Mertk-Erk1/2 and mTORC2 are Both Necessary for Full Myc Expression during EIMP
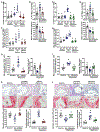
The standard conditions are as in Figure 1 unless noted otherwise. (A) BMDMs transfected with scrambled RNA or siRbcn were harvested 3 hours after removal of the labeled ACs, immunostained for intracellular Myc, and assayed for Myc MFI, gating on AC and AC+ macrophages (n = 3 biological replicates). (B) BMDMs from Mertkfl/fl or Mertkfl/fl Lyz2Cre+/− mice were harvested 3 hours after removal of the labeled ACs, immunostained for intracellular Myc, and assayed for Myc MFI, gating on AC and AC+ macrophages (n = 3 biological replicates). (C) Groups 1-4, BMDMs transfected with siMyc or scrambled RNA and labeled with EdU were assayed at the 24-hour timepoint for the percentage of EdU+ macrophages. Groups 5-6, BMDMs were incubated with Gas6 for 24 hours instead of ACs and assayed as above (n = 3 biological replicates). (D) BMDMs transfected with scrambled RNA, siDnase2a, siPrkdc, or siRictor were incubated ± ACs for 45 minutes and harvested 3 hours later. Lysates were immunoblotted for Myc and β-actin; the graph shows the Myc:β-actin densitometric ratio, expressed relative to No ACs/Scramble control (n = 3 biological replicates). (G) BMDMs transfected with scrambled RNA, siDnase2a, siPrkdc, or siRictor were incubated ± ACs for 45 minutes, harvested 3 hours later, and assayed for Myc mRNA (n = 3 biological replicates). (H) Groups 1-4, BMDMs treated ± U0126 were harvested at the 3-hour timepoint and assayed for Myc in AC and AC+ macrophages by flow cytometry. Groups 5-6, BMDMs were incubated with Gas6 instead of ACs and assayed as above (n = 3 biological replicates). (I) Groups 1-4, BMDMs treated ± U0126 and labeled with EdU were harvested at the 24-hour timepoint and assayed for the percentage of EdU+ macrophages. Groups 5-6, BMDMs were incubated with Gas6 instead of ACs and assayed as above (n = 3 biological replicates). (J) BMDMs transfected with scrambled RNA or siRictor were treated ± U0126 and then incubated ± ACs for 45 minutes, harvested at the 3-hour timepoint, and immunoblotted for Myc and β-actin. All values are means ± SEM; letters that are different indicate statistical significance at p<0.05.
Figure 4.
Figure 4.. Myc Drives EIMP by Upregulating Bhlhe40 and Downregulating c-Maf
The standard conditions and n number are as in Figure 1 unless noted otherwise. (A) BMDMs transfected with scrambled RNA or siMyc were incubated ± ACs for 45 minutes, harvested 6 hours later, and assayed for Bhlhe40 mRNA (left) or Bhlhe40 protein by immunoblot (right), The graph shows the Bhlhe40:μ-actin densitometric ratio, expressed relative to No ACs/Scramble control (n = 3 biological replicates). (B) BMDMs transfected with scrambled RNA or siMyc were incubated ± ACs for 45 minutes, harvested 6 hours later, and assayed for Maf mRNA (left) or c-Maf protein by immunoblot, with quantification (right) (n = 3 biological replicates). (C) BMDMs transfected with scrambled RNA or siBhlhe40 were incubated ± ACs for 45 minutes, harvested 6 hours later, and assayed for Maf mRNA (n = 3 biological replicates). (D) BMDMs transfected with scrambled RNA or siBhlhe40 were harvested at the 6-hour timepoint and assayed for c-Maf in AC and AC+ macrophages by flow cytometry (n = 3 biological replicates). (E-F) BMDMs transfected with scrambled RNA, siDnase2a, or siRictor and incubated ± ACs were assayed at the 6-hour timepoint for Bhlhe40 and Maf mRNA (n = 3 biological replicates). (G) Groups 1-4, BMDMs transfected with scrambled RNA or siBhlhe40 and then labeled with EdU were harvested at the 24-hour timepoint and assayed for the percentage of EdU+ macrophages. Groups 5-6, BMDMs were incubated for 24 hours with CSF1 instead of ACs and assayed as above (n = 3 biological replicates). (H) Groups 1-4, BMDMs transfected with scrambled RNA or siBhlhe40 were incubated ± EdU and assayed at the 24-hour timepoint for cell number/well. Groups 5-6, BMDMs were incubated for 24 hours with CSF1 instead of ACs and assayed as above (n = 3 biological replicates). (I) BMDMs transfected with empty plasmid or Maf-encoding plasmid and then labeled with EdU were harvested at the 24-hour timepoint and assayed for the percentage of EdU+ macrophages (n = 3 biological replicates). (J) Schematic summary of the EIMP pathway. AC-mediated activation of MerTK-ERK signaling and activation of DNA-PKcs—mTORC2 signaling by Dnase2a-derived AC-oligonucleotides converge to induce Myc, which then induces Bhlhe40. Bhlhe40 represses the cell-cycling-inhibitor c-Maf to drive macrophage proliferation. All values are means ± SEM; letters that are different indicate statistical significance at p<0.05.
Figure 5.
Figure 5.. Macrophages Undergoing EIMP are Competent Efferocytes and Producers of TGFβ and IL-10 in Vitro, and Evidence of EIMP in Vivo
(A) Macrophages not previously exposed to ACs and shown to be Ki67 (control Mϕs) or Ki67+ macrophages after 24-hour incubation with unlabeled ACs (AC-induced proliferating macrophages, termed “EIMP Mϕs”) were incubated with PKH67-labeled ACs for 45 minutes. The percentage of PKH67+ macrophages of total macrophages was assayed as a measure of single-cell efferocytosis (n = 5 biological replicates). (B) Control and Ki67+ EIMP macrophages were incubated first with PKH67-labeled ACs and then, after 2 hours, with PKH26-labeled ACs. The percentage of PKH67+ PKH26+ macrophages of PKH67+ macrophages for each group was assayed as a measure of double-cell efferocytosis (n = 5 biological replicates). Right, representative fluorescence microscopic images for this experiment. Yellow arrows indicate PKH67+ PKH26+ Ki67+ macrophages. Scale bar, 50 μm. (C-D) EdU-labeled macrophages were incubated with DiD-labeled ACs for 45 minutes, rinsed, and incubated an additional 18 hours. The cells were detached, immunostained for intracellular TGFβ and IL-10, and subjected to flow cytometric analysis to assess TGFβ and IL-10 mean fluorescence intensity (n = 3 biological replicates). Golgi-stop was added to the cells at the beginning of the 18-hour incubation to enable quantification of intracellular TGFβ and IL-10. (E) Mice were injected with EdU (200 μg/mouse i.p.) 24 hours prior to injection with PBS or 1 mg of zymosan A. After 24 or 48 hours, peritoneal cells were immunostained for F4/80 and intracellular Gr1 and subjected to flow cytometric analysis. Left, Flow cytometry plot showing that macrophage permeabilization is needed to detect Gr1, indicating that the Gr1 is intracellular, i.e., a marker of macrophage engulfment of neutrophils. Right, Flow plots and quantification of the percentage of EdU+ cells within F4/80+ macrophages that were either negative (AC) or positive (AC+) for intracellular Gr1 (n = 5 mice per group). (F) Ki67, Mac2, and TUNEL staining of thymic sections from mice 18 hours after injection with PBS or dexamethasone (Dex). The percentage of Ki67+ macrophages among AC+ and AC thymic macrophages was quantified by immunofluorescence microscopy (IFM) (n = 7 mice per group). Scale bar, 50 μm.
Figure 6.
Figure 6.. Rictor-Dependent EIMP and Resolution in Dexamethasone-Induced Thymocyte Apoptosis
Mice were transplanted with Rictorfl/fl and Rictorfl/fl TAT-Cre bone marrow. After 4 weeks, the mice were injected i.p. with PBS or dexamethasone (Dex) and then the thymi were harvested 18 hours later and assayed as follows: (A) Ki67, Mac2, and TUNEL staining , with yellow arrows indicating Mac2+ Ki67+ AC+ macrophages. Scale bar, 50 μm. The graph shows quantification of percentage of Ki67+ cells within AC+ and AC macrophages (n = 5 mice per group). Scale bar, 50 μm. (B) Quantification of F4/80+ macrophages by flow cytometry (n = 5 mice per group). (C) Quantification by IFM of Myc, Bhlehe40, and c-Maf MFI in AC+ and AC macrophages (n = 5 mice per group). (D) Annexin-V+ (apoptotic) cells by flow cytometry and cell counting, and thymic weights (n = 5 mice per group). (E) As a measure of efferocytosis, ratio of Mac2+ macrophage-associated:free TUNEL+ ACs by IFM (n = 5 mice per group). (F) Quantification of percent area of necrosis (anuclear area) of total area in H&E-stained sections; yellow arrows indicate area of necrosis(n = 5 mice per group). Scale bar, 200 μm. (G) Immunostaining and quantification of IL-6 MFI in Mac2+ areas (n = 5 mice per group). All values are means ± SEM; letters that are different indicate statistical significance at p<0.05.
Figure 7.
Figure 7.. Rictor- and Dnase2a-Dependent EIMP and Resolution in Atherosclerosis Regression
Ldlr−/− mice were fed the Western diet for 16 weeks and then either harvested (Baseline) or subjected to the atherosclerosis-regression protocol for 5 weeks. The regression mice were administered S2P-NPs containing siRictor (A-E) or siDnase2a (F-J) (or scrambled-RNA NPs as control), throughout the regression period. (A and F) Lesions were immunostained for Ki67, Mac2, and TUNEL. Overlap of cytoplasmic TUNEL staining with Mac2+ macrophages indicates efferocytosing (AC+) macrophages. The percent Ki67+ macrophages within AC+ and AC lesional macrophages was quantified by IFM (n = 7-10 mice per group). (B and G) The percent of efferocytosing (AC+) macrophages among total macrophages and the total number of Mac2+ cells per lesion section were quantified in the 3 groups of mice. (C and H) Lesions were immunostained for Myc, Mac2, and TUNEL. Myc MFI within AC+ and AC lesional macrophages was quantified by IFM and expressed relative to the MFI of Myc in AC macrophages in the baseline cohort (n = 7-10 mice per group). (D and I) Left, Quantification of the ratio of macrophage-associated ACs:free ACs, expressed relative to the baseline cohort. Right, the mean number of apoptotic (nuclear TUNEL+) cells per aortic root lesion section. (E and J) Quantification of the lesions for necrotic area and fibrous cap thickness. The top row of images are H&E-stained; necrotic areas are outlined with dashed lines. The bottom row of images are Sirius red-stained and show where fibrous cap thickness was measured. Scale bar, 200 μm. Collagen cap thickness was measured at the lesional midpoint and both shoulder regions and then averaged and quantified as the ratio of collagen cap thickness to lesion area; data are presented relative to the baseline cohort average. All values are means ± SEM; letters that are different indicate statistical significance at p<0.05.

Similar articles

Cited by

References

    1. A-Gonzalez N, Bensinger SJ, Hong C, Beceiro S, Bradley MN, Zelcer N, Deniz J, Ramirez C, Diaz M, Gallardo G, et al. (2009). Apoptotic cells promote their own clearance and immune tolerance through activation of the nuclear receptor LXR. Immunity 31, 245–258. - PMC - PubMed
    1. Alliot F, Godin I, and Pessac B (1999). Microglia derive from progenitors, originating from the yolk sac, and which proliferate in the brain. Brain Res Dev Brain Res 117, 145–152. - PubMed
    1. Babaev VR, Huang J, Ding L, Zhang Y, May JM, and Linton MF (2018). Loss of Rictor in monocyte/macrophages suppresses their proliferation and viability reducing atherosclerosis in LDLR null mice. Front Immunol 9, 215. - PMC - PubMed
    1. Bagaitkar J, Huang J, Zeng MY, Pech NK, Monlish DA, Perez-Zapata LJ, Miralda I, Schuettpelz LG, and Dinauer MC (2018). NADPH oxidase activation regulates apoptotic neutrophil clearance by murine macrophages. Blood 131, 2367–2378. - PMC - PubMed
    1. Boada-Romero E, Martinez J, Heckmann BL, and Green DR (2020). The clearance of dead cells by efferocytosis. Nat Rev Mol Cell Biol 21, 398–414. - PMC - PubMed

Publication types