Review
. 2022 Jan 5;110(1):21-35.
doi: 10.1016/j.neuron.2021.10.030. Epub 2021 Nov 15.

Beyond t test and ANOVA: applications of mixed-effects models for more rigorous statistical analysis in neuroscience research

Affiliations
Review

Beyond t test and ANOVA: applications of mixed-effects models for more rigorous statistical analysis in neuroscience research

Zhaoxia Yu et al. Neuron. .

Abstract

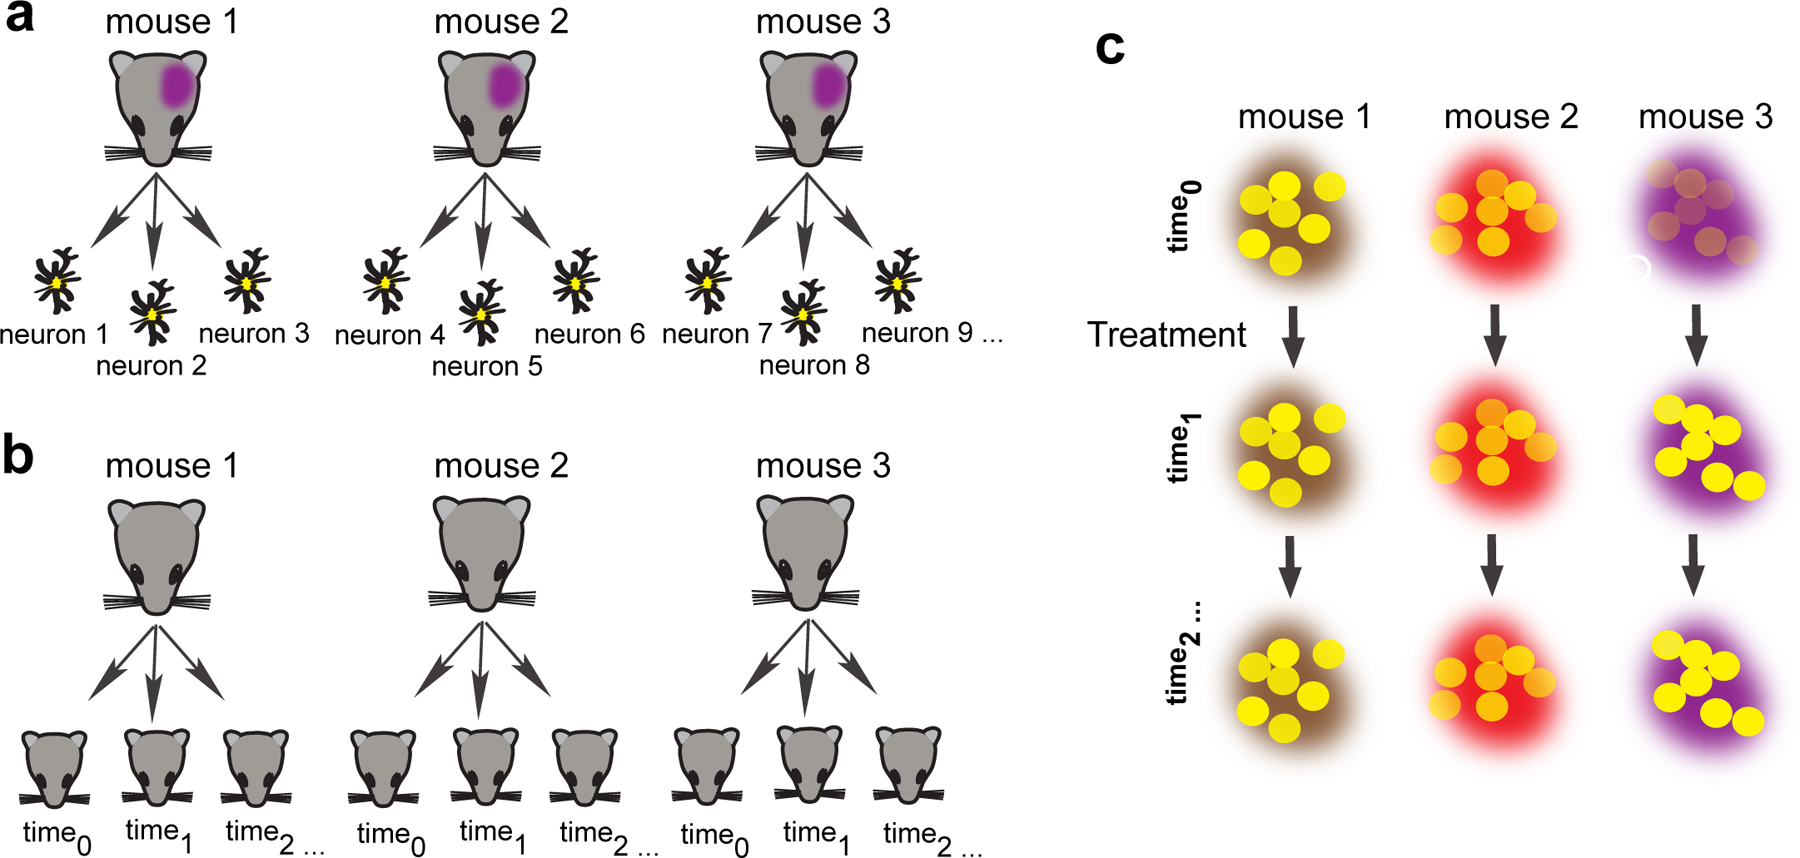
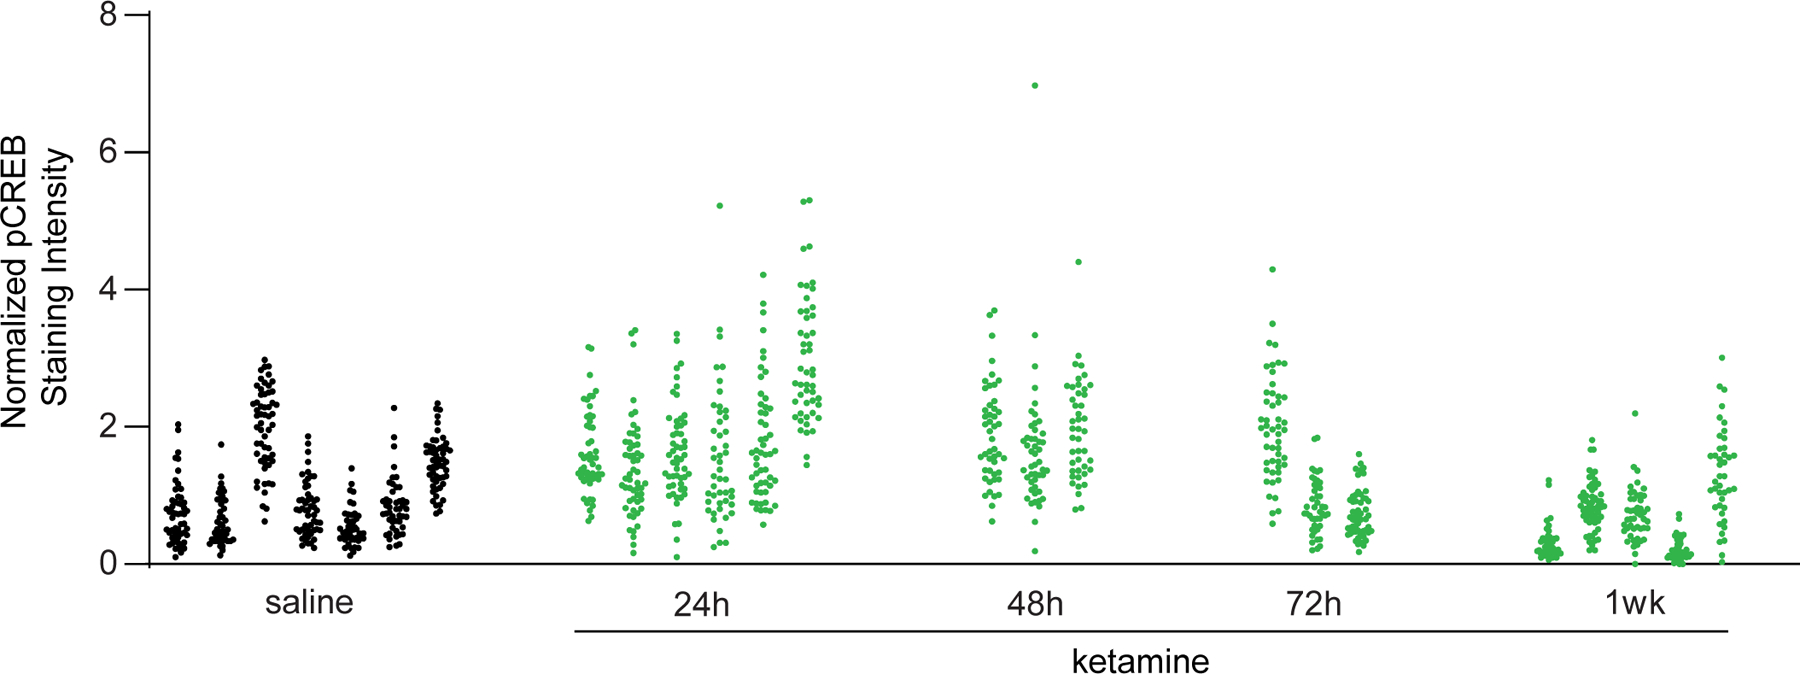
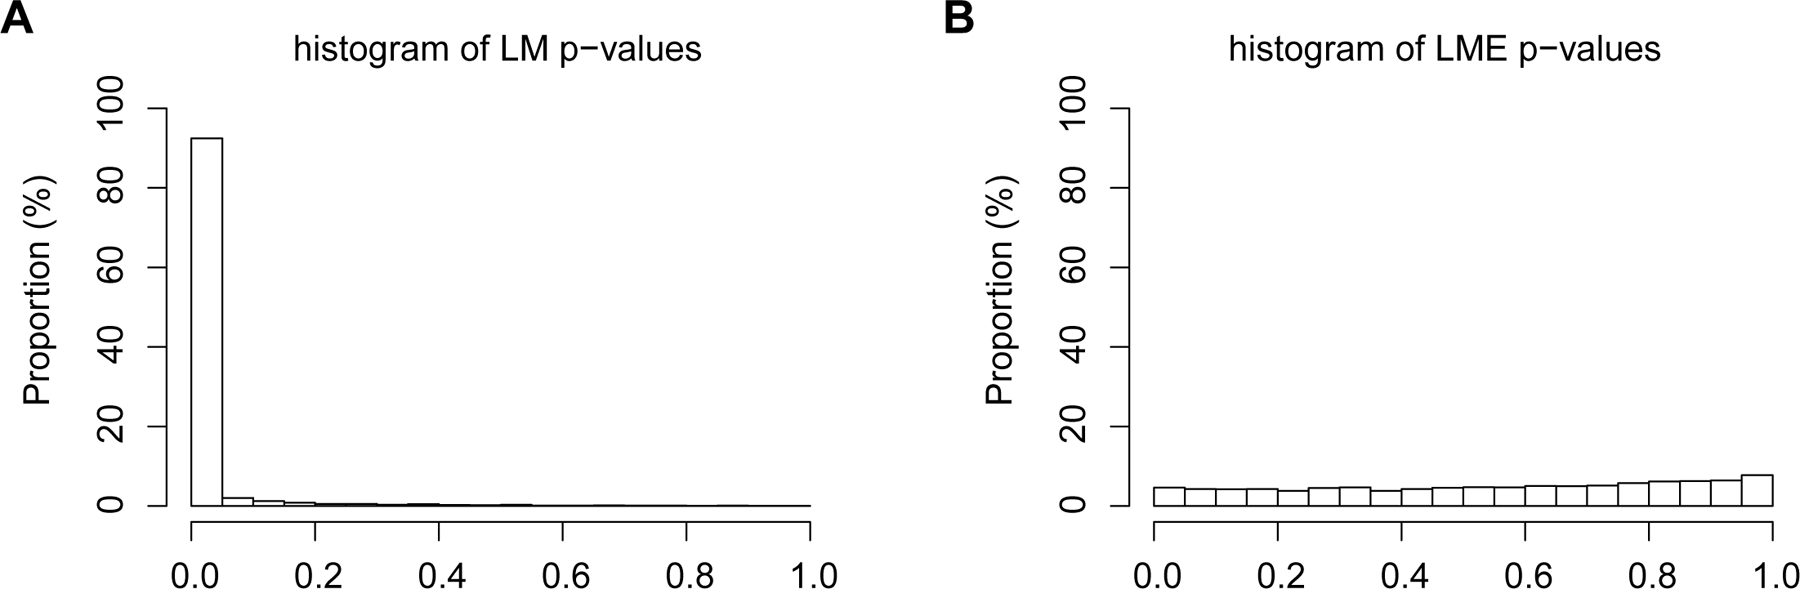
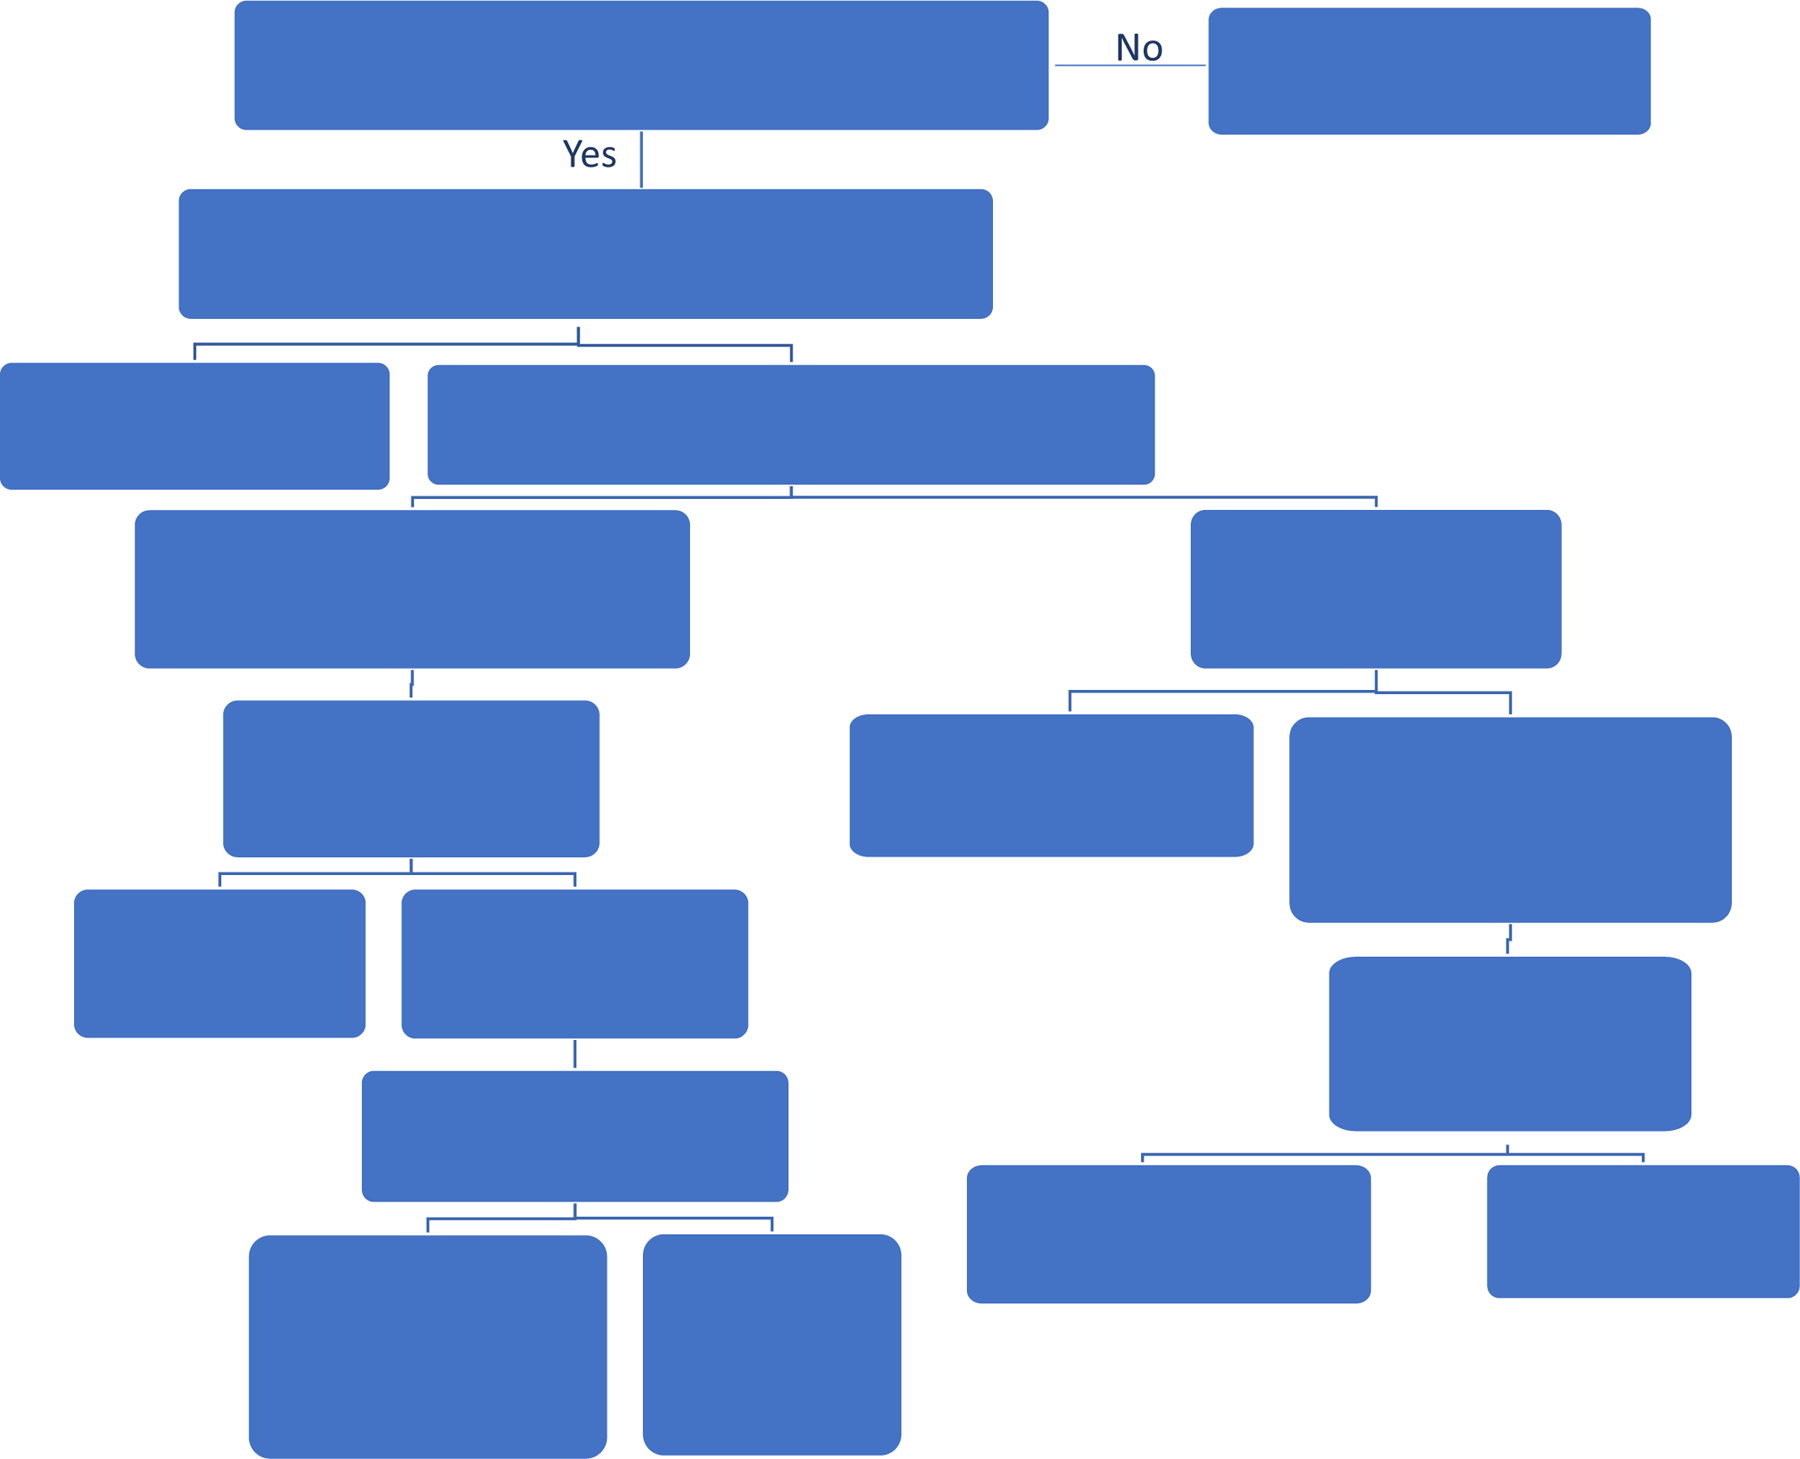
In basic neuroscience research, data are often clustered or collected with repeated measures, hence correlated. The most widely used methods such as t test and ANOVA do not take data dependence into account and thus are often misused. This Primer introduces linear and generalized mixed-effects models that consider data dependence and provides clear instruction on how to recognize when they are needed and how to apply them. The appropriate use of mixed-effects models will help researchers improve their experimental design and will lead to data analyses with greater validity and higher reproducibility of the experimental findings.

Keywords: Bayesian analysis; clustered data; generalized linear mixed-effects model; linear mixed-effects model; linear regression model; repeated measures.


Conflict of interest statement

Declaration of interests The authors declare no competing interests.

Figures

Figure 1.
Figure 1.. Sources of correlation.
A graphical representation shows potential sources of correlated data. (A) The data are correlated because neurons from the same animal tend to be more similar to each other than neurons from different animals. (B) The observations are dependent when they are taken from the same animal temporally, while the data from different animals are independent. (C) Correlation arises from two sources: individual observations are made from neurons from three different mice before and after a drug treatment.
Figure 2.
Figure 2.. Avoiding false positives that arise from correlated measurements taken from the same animals.
Normalized pCREB staining intensity values from 1200 neurons (Example 1). The values in each cluster were from one animal. In total, pCREB values were measured for 1200 neurons from 24 mice at five conditions: saline (7 mice, ICC=0.61), 24h (6 mice, ICC=0.33), 48h (3 mice, ICC=0.02), 72h (3 mice, ICC=0.63), 1wk (5 mice, ICC=0.54) after treatment. According to ICC, observations at 48h and 72h show the smallest and largest intra-class correlations, respectively.
Figure 3.
Figure 3.
Histograms of p-values using simulated data that assume (1) no treatment effects and (2) the same sample sizes and correlation structure with Example 1. (A) Histogram of the p-values from the inappropriate method (LM) shows that ignoring the correlation structure of the data lead to surprisingly high type I error rate (90%) at significance level α=0.05. (B) Histogram of the p-values from LME.
Figure 4.
Figure 4.. A decision chart for setting up mixed-effects model analysis.
This basic decision chart shows in a step-wise fashion how to identify the ME application scenarios and random effects.
Figure 5.
Figure 5.. Weighting effects from single animals.
When data from different animals are naively pooled, the result can be dominated by the data from a single animal (Example 2). To illustrate this point, we present the boxplots of Ca++ event frequencies measured at four time points using two different ways: (A) Boxplot of Ca++ event frequencies using the pooled neurons from four mice. ANOVA or t-test showed that Ca++ activity was significantly reduced at 48h relative to 24h with p=4.8×10⁻⁶, and significantly increased Ca++ activity at 1wk compared to 24h with p=2.4×10⁻³. However, when looking at (B) boxplots of Ca++ event frequencies stratified by individual mice, these changes occur only in mouse 2. This is because Mouse 2 contributed 43% cells, which likely explains why the pooled data are more similar to Mouse 2 than to other mice. Note that the comparisons are not significant if we account for repeated measures due to cells clustered in mice using LME, thus avoiding an erroneous conclusion.
Figure 6.
Figure 6.. LME does not always lead to larger p-values than methods that ignore data dependencies.
(A) the scatter plot of Ca++ event integrated amplitude at baseline vs 24h after treatment for the neurons from four example mice (labeled as 1, 2, 3 and 4) indicates that the baseline and after-treatment measures are positively correlated. (B) boxplot of the baseline and after-treatment correlations of all the 11 mice. Due to the positive correlations shown in the data, the variance of differences is smaller when treating the data as paired than independent. As a result, LME produced a smaller p-value than t-test.

References

    1. Aarts E, Verhage M, Veenvliet JV, Dolan CV, and van der Sluis S (2014). A solution to dependency: using multilevel analysis to accommodate nested data. Nature Neuroscience 17, 491–496. - PubMed
    1. Alberts B, Kirschner MW, Tilghman S, and Varmus H (2014). Rescuing US biomedical research from its systemic flaws. Proceedings of the National Academy of Sciences of the United States of America 111, 5773–5777. - PMC - PubMed
    1. Baayen RH, Davidson DJ, and Bates DM (2008). Mixed-effects modeling with crossed random effects for subjects and items. Journal of Memory and Language 59, 390–412.
    1. Barr DJ, Levy R, Scheepers C, and Tily HJ (2013). Random effects structure for confirmatory hypothesis testing: Keep it maximal. Journal of memory and language 68, 255–278. - PMC - PubMed
    1. Bates D, Mächler M, Bolker B, and Walker S (2014). Fitting linear mixed-effects models using lme4. arXiv preprint arXiv:14065823

Publication types