. 2021 Nov 24;288(1963):20211651.
doi: 10.1098/rspb.2021.1651. Epub 2021 Nov 17.

Predicting the zoonotic capacity of mammals to transmit SARS-CoV-2

Affiliations

Predicting the zoonotic capacity of mammals to transmit SARS-CoV-2

Ilya R Fischhoff et al. Proc Biol Sci. .

Abstract

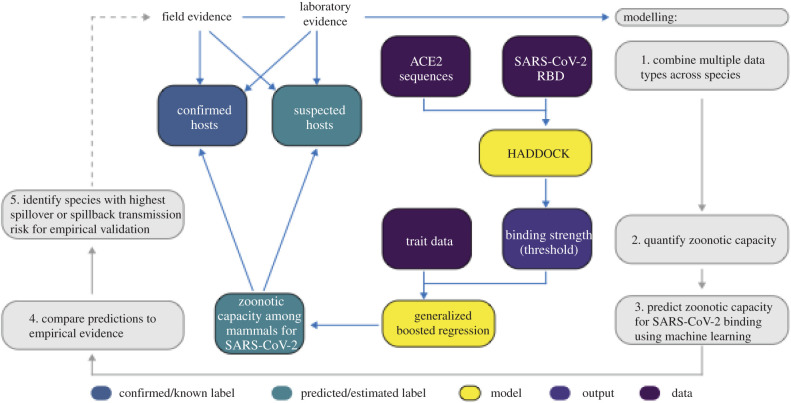
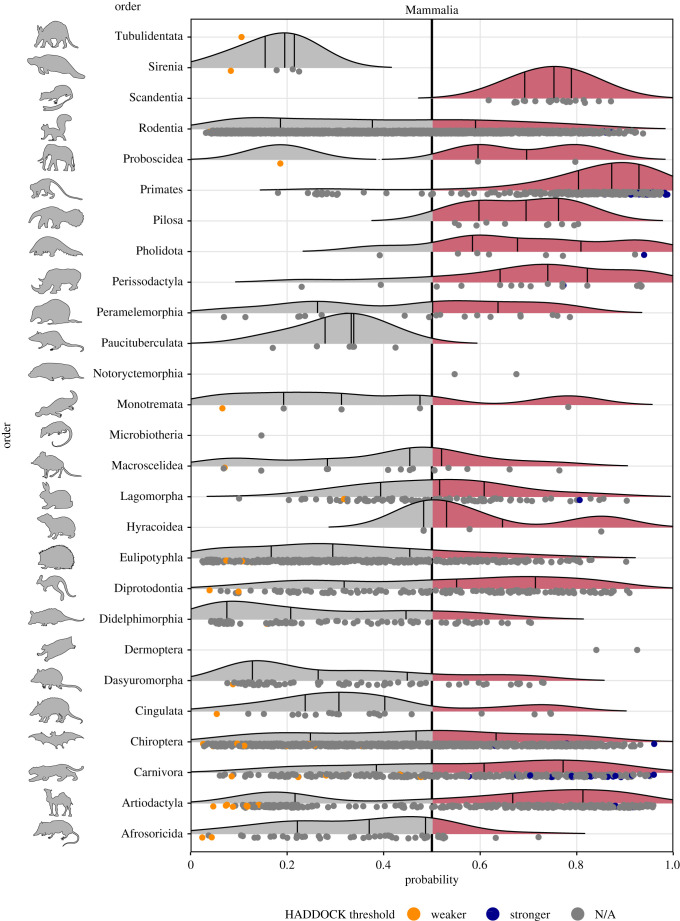
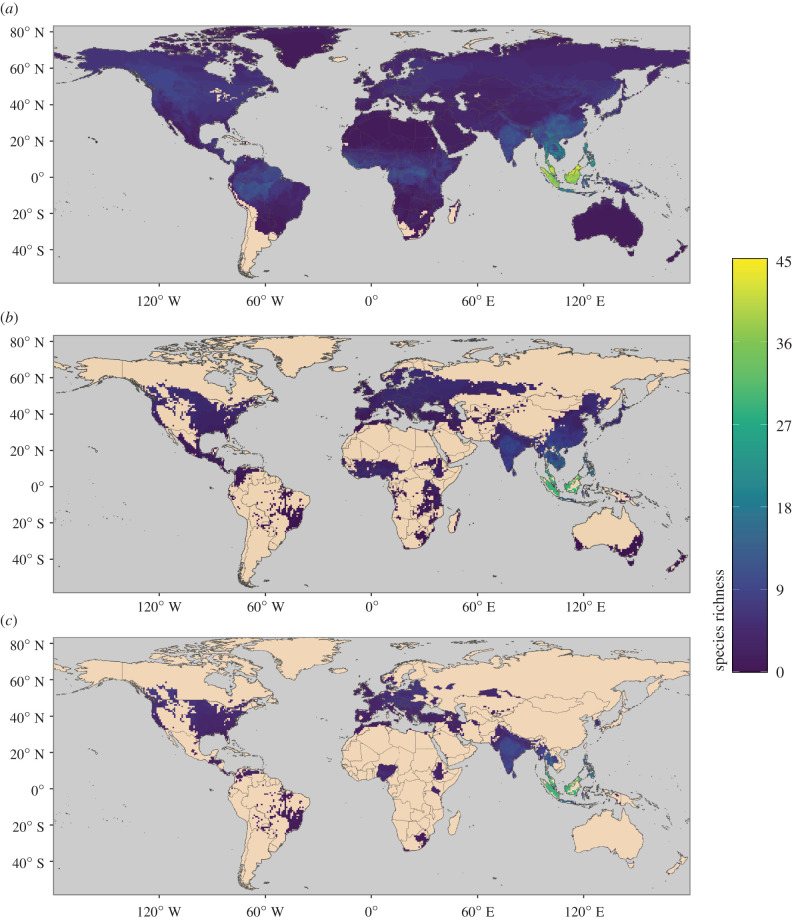
Back and forth transmission of severe acute respiratory syndrome coronavirus 2 (SARS-CoV-2) between humans and animals will establish wild reservoirs of virus that endanger long-term efforts to control COVID-19 in people and to protect vulnerable animal populations. Better targeting surveillance and laboratory experiments to validate zoonotic potential requires predicting high-risk host species. A major bottleneck to this effort is the few species with available sequences for angiotensin-converting enzyme 2 receptor, a key receptor required for viral cell entry. We overcome this bottleneck by combining species' ecological and biological traits with three-dimensional modelling of host-virus protein-protein interactions using machine learning. This approach enables predictions about the zoonotic capacity of SARS-CoV-2 for greater than 5000 mammals-an order of magnitude more species than previously possible. Our predictions are strongly corroborated by in vivo studies. The predicted zoonotic capacity and proximity to humans suggest enhanced transmission risk from several common mammals, and priority areas of geographic overlap between these species and global COVID-19 hotspots. With molecular data available for only a small fraction of potential animal hosts, linking data across biological scales offers a conceptual advance that may expand our predictive modelling capacity for zoonotic viruses with similarly unknown host ranges.

Keywords: COVID-19; ecological traits; machine learning; spillback; structural modelling; zoonotic.


Figures

Figure 1.
Figure 1.
A heatmap summarizing predicted susceptibility to SARS-CoV-2 for species with confirmed infection from in vivo experimental studies or from documented natural infections. Studies that make predictions about species susceptibility are shown on the x-axis, organized by the method of prediction (those relying on ACE2 sequences, estimating binding strength using three-dimensional structures, or laboratory experiments). Predictions about zoonotic capacity from this study are listed in the second to last column, with high and low categories determined by zoonotic capacity observed in Felis catus. Confirmed infections for species along with the y-axis are depicted as a series of filled or unfilled circles. Bolded species have been experimentally confirmed to transmit SARS-CoV-2 to naive conspecifics. Species predictions range from warmer colours (yellow: low susceptibility or zoonotic capacity for SARS-CoV-2) to cooler colours (purple: high susceptibility or zoonotic capacity). See electronic supplementary material, Methods [20] for detailed methods about how predictions from past studies were categorized as low, medium or high. For a comparison of predictions of species susceptibility from multiple methods, including our study, see electronic supplementary material, figure S1. (Online version in colour.)
Figure 2.
Figure 2.
A flowchart showing the progression of our workflow combining evidence from limited laboratory and field studies with additional data types to predict zoonotic capacity across mammals through multi-scale statistical modelling (grey boxes, steps 1–5). For all vertebrates with published ACE2 sequences, we modelled the interface of species' ACE2 bound to the viral RBD using HADDOCK. We then combined the HADDOCK scores, which approximate binding strength, with species' trait data and trained machine learning models (generalized boosted regression) for both mammals and vertebrates. Predictive modelling of host zoonotic capacity focused on mammals only because there are currently no non-mammalian hosts for SARS-CoV-2 and imbalanced ACE2 sequences among non-mammals. Mammal species predicted to have high zoonotic capacity were then compared to results of in vivo experiments and in silico studies that applied various computational approaches. Based on predictions from our model, we identified a subset of species with particularly high risk of spillback and secondary spillover potential to prioritize additional laboratory validation and field surveillance (dashed line). (Online version in colour.)
Figure 3.
Figure 3.
Ridgeline plots showing the distribution of predicted zoonotic capacity across mammals. Predicted probabilities for zoonotic capacity across the x-axis range from 0 (likely not susceptible) to 1 (zoonotic capacity predicted to be the same or greater than Felis catus), with the vertical line representing 0.5. The y-axis depicts all mammalian orders represented by our predictions. Density curves represent the distribution of the predictions, with those parts of the curve over 0.5 coloured pink and lines representing distribution quartiles. The predicted values for each order are shown as points below the density curves. Points that were used to train the model are coloured: orange represents species with weaker predicted binding, blue represents species with stronger predicted binding. Selected family-level distributions are shown in the electronic supplementary material, figures S8 and S9 [20]. (Online version in colour.)
Figure 4.
Figure 4.
Maps showing the global distribution of species with the predicted capacity to transmit SARS-CoV-2; (a) depicts global species richness of the top 10 per cent of model-predicted zoonotic capacity. Geographic ranges of this subset of species were filtered to those associated with human-dominated or human-altered habitats (b), and further filtered to show the subset of species that overlaps with areas of high human SARS-CoV-2 positive case counts (over 100 000 cumulative cases as of 17 May 2021) (c). For a full list of model-predicted zoonotic capacity of species by country, see electronic supplementary material, file S2 [20]. (Online version in colour.)

Update of

Comment in

Similar articles

Cited by

References

    1. Dong E, Du H, Gardner L. 2020. An interactive web-based dashboard to track COVID-19 in real time. Lancet Infect. Dis. 20, 533-534. ( 10.1016/S1473-3099(20)30120-1) - DOI - PMC - PubMed
    1. World Health Organization. 2021. WHO coronavirus disease (COVID-19) dashboard. See https://covid19.who.int.
    1. Keele BF, et al. 2006. Chimpanzee reservoirs of pandemic and nonpandemic HIV-1. Science 313, 523-526. ( 10.1126/science.1126531) - DOI - PMC - PubMed
    1. Gage KL, Kosoy MY. 2005. Natural history of plague: perspectives from more than a century of research. Annu. Rev. Entomol. 50, 505-528. ( 10.1146/annurev.ento.50.071803.130337) - DOI - PubMed
    1. Taubenberger JK, Reid AH, Lourens RM, Wang R, Jin G, Fanning TG. 2005. Characterization of the 1918 influenza virus polymerase genes. Nature 437, 889. ( 10.1038/nature04230) - DOI - PubMed

Publication types

Substances