

Comparisons of corneal biomechanical and tomographic parameters among thin normal cornea, forme fruste keratoconus, and mild keratoconus
- PMID: 34784958
- PMCID: PMC8596950
- DOI: 10.1186/s40662-021-00266-y
Comparisons of corneal biomechanical and tomographic parameters among thin normal cornea, forme fruste keratoconus, and mild keratoconus
Abstract
Background: To compare the dynamic corneal response (DCR) and tomographic parameters of thin normal cornea (TNC) with thinnest corneal thickness (TCT) (≤ 500 µm), forme fruste keratoconus (FFKC) and mild keratoconus (MKC) had their central corneal thickness (CCT) matched by Scheimpflug imaging (Pentacam) and corneal visualization Scheimpflug technology (Corvis ST).
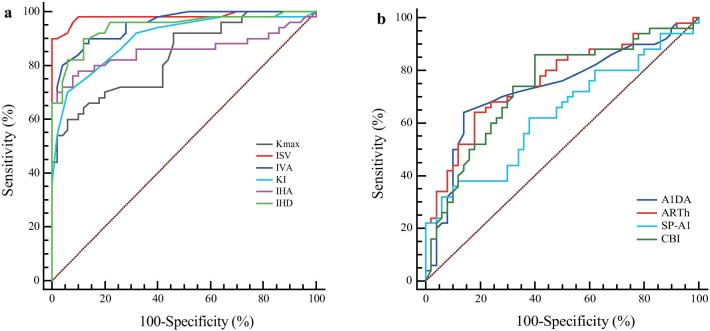
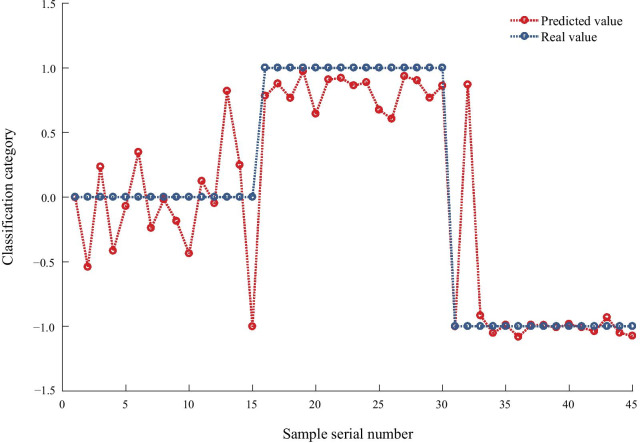
Methods: CCT were matched in 50 eyes with FFKC, 50 eyes with MKC, and 53 TNC eyes with TCT ≤ 500 µm. The differences in DCR and tomographic parameters among the three groups were compared. The receiver operating characteristic (ROC) curve was used to analyze the diagnostic significance of these parameters. Back propagation (BP) neural network was used to establish the keratoconus diagnosis model.
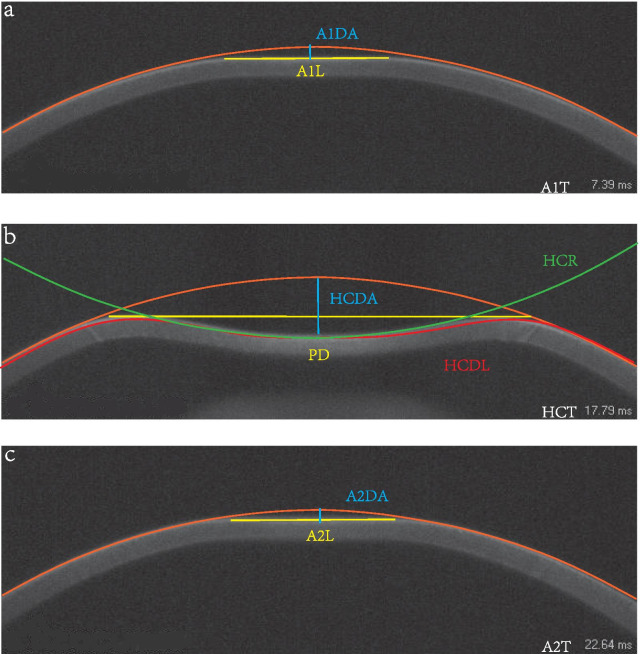
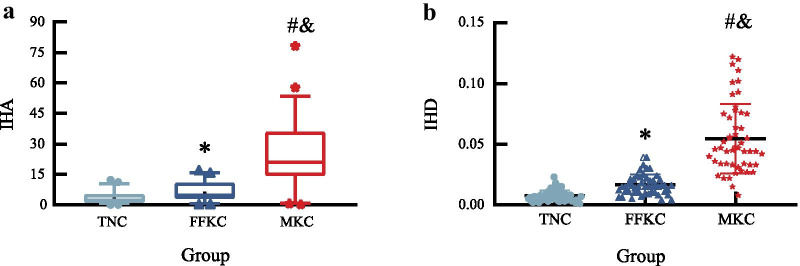
Results: Fifty CCT-matched FFKC eyes, 50 MKC eyes and 50 TNC eyes were included. The age and biomechanically corrected intraocular pressure (bIOP) did not differ significantly among the three groups (all P > 0.05). The index of height asymmetry (IHA) and height decentration (IHD) differed significantly among the three groups (all P < 0.05). IHD also had sufficient strength (area under the ROC curves (AUC) > 0.80) to differentiate FFKC and MKC from TNC eyes. Partial DCR parameters showed significant differences between the MKC and TNC groups, and the deflection amplitude of the first applanation (A1DA) showed a good potential to differentiate (AUC > 0.70) FFKC and MKC from TNC eyes. Diagnosis model by BP neural network showed an accurate diagnostic efficiency of about 91%.
Conclusions: The majority of the tomographic and DCR parameters differed among the three groups. The IHD and partial DCR parameters assessed by Corvis ST distinguished FFKC and MKC from TNC when controlled for CCT.
Keywords: Corneal biomechanical parameters; Forme fruste keratoconus; Mild keratoconus; Thin normal cornea.
© 2021. The Author(s).
Conflict of interest statement
The authors declare that there is no conflict of interests regarding the publication of this study.
Figures
Similar articles
-
Differences of Corneal Biomechanics Among Thin Normal Cornea, Forme-Fruste Keratoconus, and Cornea After SMILE.Front Bioeng Biotechnol. 2022 May 13;10:861924. doi: 10.3389/fbioe.2022.861924. eCollection 2022. Front Bioeng Biotechnol. 2022. PMID: 35646859 Free PMC article.
-
A Potential Screening Index of Corneal Biomechanics in Healthy Subjects, Forme Fruste Keratoconus Patients and Clinical Keratoconus Patients.Front Bioeng Biotechnol. 2021 Dec 23;9:766605. doi: 10.3389/fbioe.2021.766605. eCollection 2021. Front Bioeng Biotechnol. 2021. PMID: 35004638 Free PMC article.
-
Comparison of the morphological and biomechanical characteristics of keratoconus, forme fruste keratoconus, and normal corneas.Semin Ophthalmol. 2021 Nov 17;36(8):671-678. doi: 10.1080/08820538.2021.1896752. Epub 2021 Mar 18. Semin Ophthalmol. 2021. PMID: 33734947
-
A Systematic Review of Subclinical Keratoconus and Forme Fruste Keratoconus.J Refract Surg. 2020 Apr 1;36(4):270-279. doi: 10.3928/1081597X-20200212-03. J Refract Surg. 2020. PMID: 32267959
-
Early diagnosis of keratoconus using corneal biomechanics and OCT derived technologies.Eye Vis (Lond). 2025 May 12;12(1):18. doi: 10.1186/s40662-025-00435-3. Eye Vis (Lond). 2025. PMID: 40350508 Free PMC article. Review.
Cited by
-
Comparison of anterior segment parameters of the eye between type 2 diabetic with and without diabetic retinopathy and non-diabetic.Int J Ophthalmol. 2023 Apr 18;16(4):571-578. doi: 10.18240/ijo.2023.04.11. eCollection 2023. Int J Ophthalmol. 2023. PMID: 37077477 Free PMC article.
-
Revisiting Pentacam Parameters in the Diagnosis of Subclinical and Mild Keratoconus Based on Different Grading System Definitions.Turk J Ophthalmol. 2023 Dec 21;53(6):324-335. doi: 10.4274/tjo.galenos.2023.68188. Epub 2023 Nov 27. Turk J Ophthalmol. 2023. PMID: 38008938 Free PMC article.
-
Differences of Corneal Biomechanics Among Thin Normal Cornea, Forme-Fruste Keratoconus, and Cornea After SMILE.Front Bioeng Biotechnol. 2022 May 13;10:861924. doi: 10.3389/fbioe.2022.861924. eCollection 2022. Front Bioeng Biotechnol. 2022. PMID: 35646859 Free PMC article.
-
Spatial Assessment of Heterogeneous Tissue Natural Frequency Using Micro-Force Optical Coherence Elastography.Front Bioeng Biotechnol. 2022 Mar 11;10:851094. doi: 10.3389/fbioe.2022.851094. eCollection 2022. Front Bioeng Biotechnol. 2022. PMID: 35360399 Free PMC article.
-
Tear Proteomic Analysis From Offspring of Keratoconus Patients: New Insights Into Corneal Biomechanical Weakness and Disease Risk Stages.Invest Ophthalmol Vis Sci. 2025 May 1;66(5):41. doi: 10.1167/iovs.66.5.41. Invest Ophthalmol Vis Sci. 2025. PMID: 40434347 Free PMC article.
References
-
- Morishige N, Shin-Gyou-Uchi R, Azumi H, Ohta H, Morita Y, Yamada N, et al. Quantitative analysis of collagen lamellae in the normal and keratoconic human cornea by second harmonic generation imaging microscopy. Invest Ophthalmol Vis Sci. 2014;55(12):8377–8385. doi: 10.1167/iovs.14-15348. - DOI - PubMed
Grants and funding
LinkOut - more resources
Full Text Sources
Miscellaneous
