. 2021 Nov 16;9(1):183.
doi: 10.1186/s40478-021-01273-9.

Chemogenetic modulation of sensory neurons reveals their regulating role in melanoma progression

Affiliations

Chemogenetic modulation of sensory neurons reveals their regulating role in melanoma progression

Pedro A C Costa et al. Acta Neuropathol Commun. .

Abstract

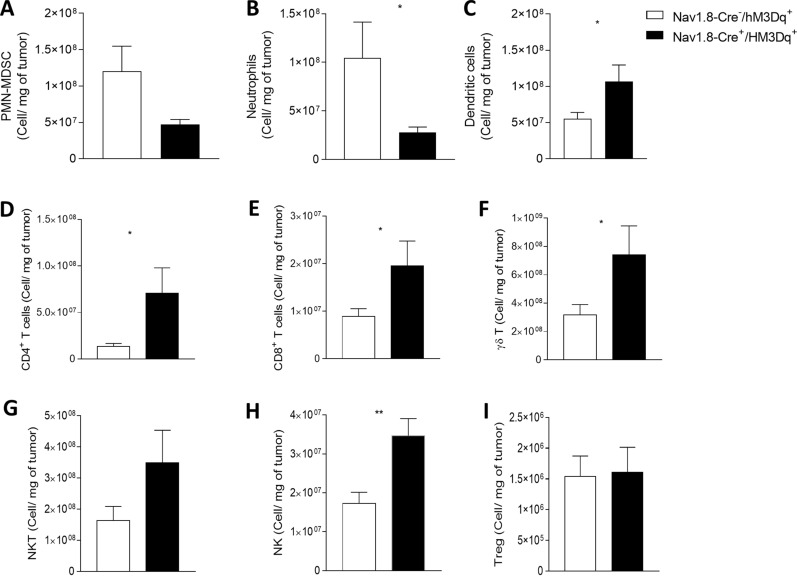
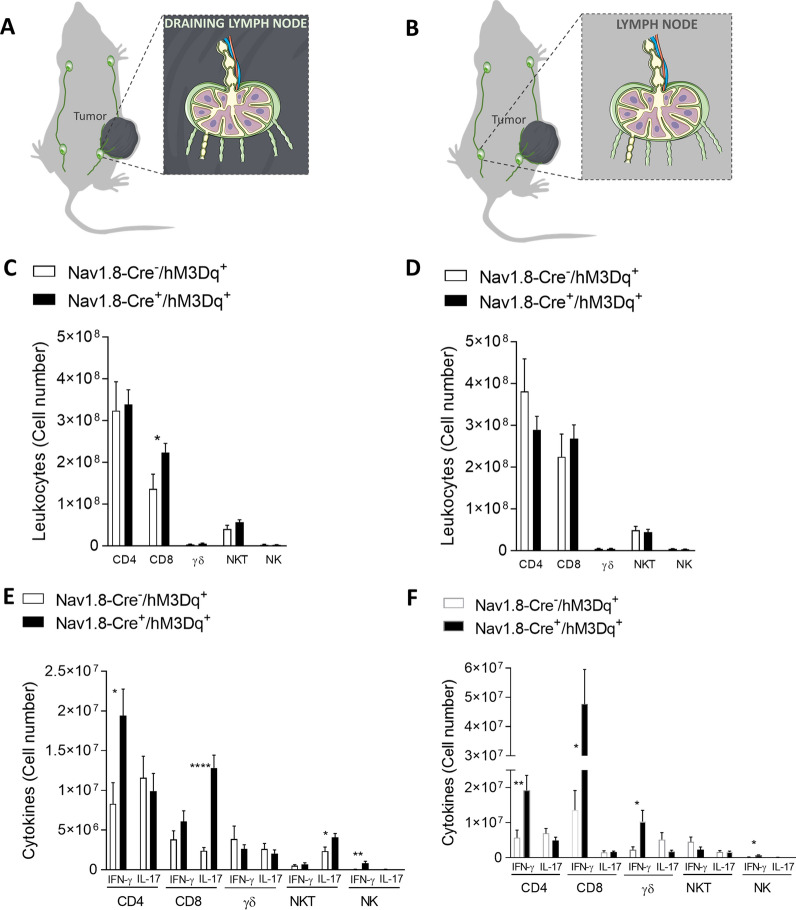
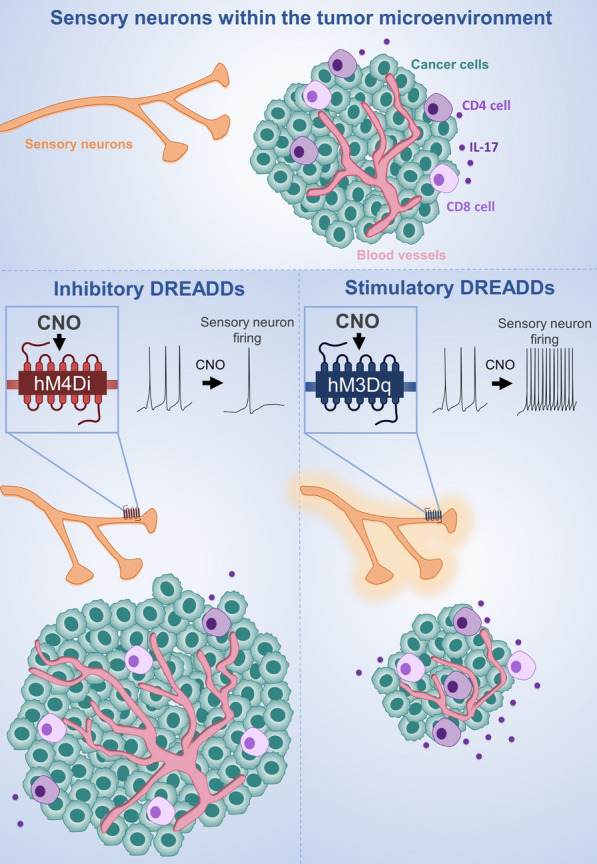
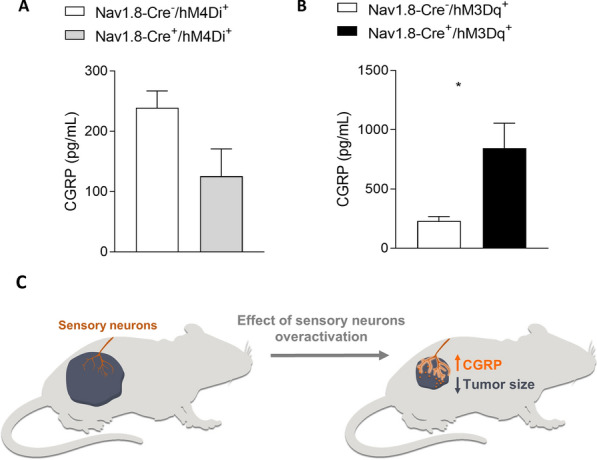
Sensory neurons have recently emerged as components of the tumor microenvironment. Nevertheless, whether sensory neuronal activity is important for tumor progression remains unknown. Here we used Designer Receptors Exclusively Activated by a Designer Drug (DREADD) technology to inhibit or activate sensory neurons' firing within the melanoma tumor. Melanoma growth and angiogenesis were accelerated following inhibition of sensory neurons' activity and were reduced following overstimulation of these neurons. Sensory neuron-specific overactivation also induced a boost in the immune surveillance by increasing tumor-infiltrating anti-tumor lymphocytes, while reducing immune-suppressor cells. In humans, a retrospective in silico analysis of melanoma biopsies revealed that increased expression of sensory neurons-related genes within melanoma was associated with improved survival. These findings suggest that sensory innervations regulate melanoma progression, indicating that manipulation of sensory neurons' activity may provide a valuable tool to improve melanoma patients' outcomes.

Keywords: Chemogenetics; Melanoma; Neuronal activity; Sensory neurons; Tumor microenvironment.


Conflict of interest statement

The authors have no competing interests to declare.

Figures

Fig. 1
Fig. 1
Chemogenetic inhibition of neuronal activity in sensory Nav1.8 + nerve fibers triggers melanoma growth. A Schematic diagram of the Nav1.8-Cre + /hM4Di + experimental mouse model. Cre recombinase directs the expression of hM4Di specifically to sensory neurons in those mice. After the administration of CNO to those mice, neuronal activity in sensory neurons is inhibited. B Tumor-infiltrating sensory neurons are targeted in Nav1.8-Cre mice. 1 × 105 B16F10 melanoma cells were subcutaneously injected into Nav1.8-Cre/TdTomato mice, and tumor tissues were surgically removed 16 days later. Representative image of a Nav1.8-Cre/TdTomato mouse tumoral section with sensory nerve fibers infiltrating the tumor labelled with TdTomato fluorescence (red) and nuclei with DAPI (blue). C Capsaicin-induced spontaneous behavior test corroborates chemogenetic inhibition of sensory Nav1.8 + nerve fibers in Nav1.8‐Cre+/hM4Di+ mice after CNO treatment. Column charts show the licking time after capsaicin application of Nav1.8‐Cre/hM4Di+ (n = 5) and Nav1.8‐Cre+/hM4Di+ (n = 5) animals. D Representation of the protocol for subcutaneous allograft melanoma growth. 1 × 105 B16F10 melanoma cells were subcutaneously injected into Nav1.8‐Cre/hM4Di + (n = 5) and Nav1.8‐Cre + /hM4Di + (n = 5) mice, followed by tumors removal for analysis after 16 days. CNO was daily intra-peritoneal injected at 1 mg/kg. E Development curve of tumor growth from Nav1.8‐Cre/hM3Dq+ and Nav1.8‐Cre+/hM3Dq+. Tumor volumes were assessed over time with a caliper. F Representative macroscopic image of B16F10 melanoma after dissection, left panel (Nav1.8‐Cre/hM4Di+) and right panel (Nav1.8‐Cre+/hM4Di+). G Tumor weight. (Nav1.8‐Cre/hM4Di+: 0.50 ± 0.04 g; Nav1.8‐Cre+/hM4Di+: 0.98 ± 0.23 g). Data are shown as mean ± SEM. Unpaired t test (ns P > 0.05; *P < 0.05; **P < 0.01)
Fig. 2
Fig. 2
Chemogenetic inhibition of neuronal activity in sensory Nav1.8 + innervations increases intra-tumoral proliferation and angiogenesis, and blocks anti-tumoral immune response. 1 × 105 B16F10 melanoma cells were subcutaneously injected into Nav1.8‐Cre/hM4Di + (n = 5) and Nav1.8‐Cre + /hM4Di + (n = 5) mice, followed by tumors removal for analysis after 16 days. A Representative immunofluorescence images of tumors labelled for endothelial cells (CD31; red) to identify blood vessels and nuclei (DAPI; blue). B Quantification of angiogenesis in melanomas by blood vessel area. C Representative immunofluorescence images of tumors labelled for Ki67 (Ki67; green) to identify cell proliferation and nuclei (DAPI; blue). D Quantification of proliferation in melanomas by the counting of Ki67 + cells per μm2. Absolute number of CD4 + E and CD8 + G T cells from the melanomas of B16F10–inoculated mice. F Graph shows absolute numbers of CD4 + T cells producers of IL-17. IL-17 levels were measured in cells isolated from tumors of B16F10–inoculated Nav1.8-Cre/hM4Di+ and Nav1.8-Cre+/hM4Di+ animals. Data are shown as mean ± SEM. Unpaired t test (ns P > 0.05; *P < 0.05)
Fig. 3
Fig. 3
Overstimulation of sensory Nav1.8 + nerve fibers decreases melanoma growth. A Schematic diagram of the Nav1.8-Cre + /hM3Dq + experimental mouse model. Cre recombinase directs the expression of hM3Dq specifically to sensory neurons in those mice. After the administration of CNO to those mice, neuronal activity in sensory neurons is overactivated. B Representation of the protocol for subcutaneous allograft melanoma growth. 1 × 105 B16F10 melanoma cells were subcutaneously injected into Nav1.8‐Cre/hM3Dq + (n = 14) and Nav1.8‐Cre + /hM3Dq + (n = 13) mice, and tumors were removed for analysis after 16 days. CNO was injected daily intra-peritoneally at 1 mg/kg. C Development curve of tumor growth from Nav1.8‐Cre/hM3Dq+ and Nav1.8‐Cre+/hM3Dq+. Tumor volumes were assessed over time with a caliper. D Representative macroscopic images of B16F10 melanoma tumors after dissection, left panel (Nav1.8‐Cre/hM3Dq+) and right panel (Nav1.8‐Cre+/hM3Dq+). E Tumor weight. (Nav1.8‐Cre/hM3Dq+: 0.38 ± 0.07; Nav1.8‐Cre+/hM3Dq+: 0.17 ± 0.03). F Tumor weight corrected by animal body weight. G Representative immunofluorescence images of tumors labelled for Ki67 (Ki67; green) to identify cell proliferation and nuclei (DAPI; blue). H Quantification of proliferation in melanomas from Nav1.8‐Cre/hM3Dq+ and Nav1.8‐Cre+/hM3Dq+ animals. I Quantification of proliferation (Ki67 +) by flow cytometry in CD45- cells from tumors of Nav1.8‐Cre/hM3Dq+ and Nav1.8‐Cre+/hM3Dq+ mice. J Representative immunofluorescence images of tumor sections labelled for endothelial cells (CD31; red) to identify blood vessels and nuclei (DAPI; blue). K Quantification of angiogenesis in melanomas by blood vessel area. Data are shown as mean ± SEM. Unpaired t test (ns P > 0.05; *P < 0.05; **P < 0.01)
Fig. 4
Fig. 4
Sensory neurons overactivation improves anti-tumor immunity by decreasing tumor-infiltrating immunosuppressive cells, increasing dendritic cells and by promoting CD4 + T, CD8 + T, γδT, NKT, and NK-cell infiltration. Immune cells from B16F10–inoculated mice were analyzed ex vivo in Nav1.8-Cre/hM3Dq+ (n = 14) and Nav1.8-Cre+/hM3Dq+ (n = 13) mice. Column charts show the proportion of PMN/MDSC (A) Neutrophils (B) and Dendritic cells (C) quantified in the tumor microenvironment. (D-I) TIL from B16F10–inoculated Nav1.8-Cre-/hM3Dq + (n = 14) and Nav1.8-Cre + /hM3Dq + (n = 13) mice were analyzed ex vivo. Absolute number of CD4 + T cells (D), CD8 + T cells (E), γδ T cells (F), NKT cells (G), NK cells (H), and Treg cells (I) from the melanomas of B16F10–inoculated mice. Data are shown as mean ± SEM, Unpaired t test, *.01 < P < .05; **.001 < P < .01
Fig. 5
Fig. 5
Sensory neurons overstimulation prevent the increase of immune checkpoint markers in tumor infiltrating CD8 + T cells and CD4 + T cells. Immune cells from tumors of B16F10–inoculated mice were analyzed ex vivo in Nav1.8-Cre/hM3Dq+ (n = 14) and Nav1.8-Cre+/hM3Dq+ (n = 13) mice. Column charts show proportion of CTLA-4 (A, D, G, J, M, P), PD-1 (B, E, H, K, N, Q) and CTLA-4/PD-1 co-expressing (C, F, I, L, O, R) CD4 + T cells (A, B, C), CD8 + T cells (D, E, F), γδ T cells (G, H, I), NKT cells (J, K, L), NK cells (M, N, O), and Treg cells (P, Q, R) from tumors of B16F10–inoculated mice. Data are shown as mean ± SEM, Unpaired t test, *.01 < P < .05; **.001 < P < .01
Fig. 6
Fig. 6
Sensory neurons overactivation promote an increase in tumor-infiltrating IL-17-producing CD4 + and CD8 + T cells. TIL from melanomas of B16F10–inoculated Nav1.8-Cre-/hM3Dq + (n = 14) and Nav1.8-Cre + /hM3Dq + (n = 13) mice were analyzed. TIL from B16F10–inoculated mice were analyzed after 4 h of culture. A Column charts show absolute numbers of CD4 + and CD8 + T cells producers of IFN-γ and IL-17. B Column charts show absolute number of γδ T cells, NKT cells and NK cells producing IFN-γ and IL-17. Cytokines levels were measured in cells isolated from tumors of B16F10–inoculated Nav1.8-Cre/hM3Dq+ and Nav1.8-Cre+/hM3Dq+ mice. Data are shown as mean ± SEM, Unpaired t test, *.01 < P < .05; **.001 < P < .01
Fig. 7
Fig. 7
Tumor-draining lymph nodes present an increase in effector CD8 + T-cells after overstimulation of sensory neurons, while the number of lymphocytes in tumor non-draining lymph nodes doesnt change. A Schematic representation of the collected tumor draining lymph nodes. TIL from tumor-draining lymph nodes of B16F10–inoculated Nav1.8-Cre-/hM3Dq + (n = 14) and Nav1.8-Cre + /hM3Dq + (n = 13) mice were analyzed. B Absolute number of CD4 + , CD8 + , γδ, NKT and NK cells from tumor-draining lymph nodes of B16F10–inoculated mice. C IFN-γ and IL-17 were quantified in CD4, CD8, γδ, NKT and NK cells. D Schematic representation of the collected tumor non-draining lymph nodes. TIL from tumor non-draining lymph nodes of B16F10–inoculated Nav1.8-Cre-/hM3Dq + (n = 14) and Nav1.8-Cre + /hM3Dq + (n = 13) mice were analyzed. E Absolute number of CD4 + , CD8 + , γδ, NKT and NK cells from tumor non-draining lymph nodes of B16F10–inoculated mice. F IFN-γ and IL-17 were quantified in CD4, CD8, γδ, NKT and NK cells. Cytokines levels were measured in cells from tumor-draining and tumor non-draining lymph nodes of B16F10–inoculated Nav1.8-Cre-/hM3Dq + and Nav1.8-Cre + /hM3Dq + mice. Data are shown as mean ± SEM. Unpaired t test, *.01 < P < .05; **.001 < P < .01; ****P < 0.0001
Fig. 8
Fig. 8
Overexpression of genes related to sensory nerves is associated with Skin Cutaneous Melanomas (SKCM) patients improved survival. A Biological Processes of genes overexpressed in Skin Cutaneous Melanomas (SKCM) samples from alive patients versus dead patients. Patients were stratified (alive or dead) based on their vital status in a 5-year interval of their tumor diagnosis (clinical data available at TCGA and curated by Liu et al. (2018) [85]. We stratified patients in two groups, alive or dead, based on a 5-year interval of their tumor diagnosis. B Interactions among genes related to sensory neurons. C Gene signature using sensory neurons-related genes. High expression of these genes (lower patient scores) is associated with a better overall survival of SKCM patients (patients were stratified based on their median Reboot score). Overall survival of patients showing expression of sensory neurons-related genes. More negative scores are associated with higher gene expression. D Expression of SNC10A (Nav1.8) in SKCM samples. Only patients presenting tumors expressing SNC10A were used. E We evaluated the survival probability of patients with melanoma based on their tumor transcriptome. Patients were stratified based on lower/upper quartiles of SCN10A expression values. Overall survival of SKCM patients based on the level of expression of SCN10A. High expression of SCN10A (Nav1.8) correlates with best outcomes in patients with melanoma
Fig. 9
Fig. 9
Schematic illustration summarizing the results of sensory neurons’ activity inhibition and overactivation in the melanoma microenvironment
Fig. 10
Fig. 10
Increase in sensory neurons activity leads to increase in intra-tumoral calcitonin gene-related peptide (CGRP). CGRP concentration was measured in tumor samples from Nav1.8-Cre + /hM4Di + and Nav1.8-Cre-/hM4Di + animals (A) and from Nav1.8-Cre + /hM3Dq + and Nav1.8-Cre-/hM3Dq + mice (B). (C) Schematic representation of the association between intra-tumoral concentration of CGRP and tumor size. (n = 5). Data are shown as mean ± SEM

Similar articles

Cited by

References

    1. Allen JK, Armaiz-Pena GN, Nagaraja AS, Sadaoui NC, Ortiz T, Dood R, Ozcan M, Herder DM, Haemmerle M, Gharpure KM, et al. Sustained adrenergic signaling promotes intratumoral innervation through BDNF induction. Cancer Res. 2018;78:3233–3242. doi: 10.1158/0008-5472.CAN-16-1701. - DOI - PMC - PubMed
    1. Amaya F, Wang H, Costigan M, Allchorne AJ, Hatcher JP, Egerton J, Stean T, Morisset V, Grose D, Gunthorpe MJ, et al. The voltage-gated sodium channel Na(v)1.9 is an effector of peripheral inflammatory pain hypersensitivity. J Neurosci. 2006;26:12852–12860. doi: 10.1523/JNEUROSCI.4015-06.2006. - DOI - PMC - PubMed
    1. Ankathatti Munegowda M, Deng Y, Mulligan SJ, Xiang J. Th17 and Th17-stimulated CD8(+) T cells play a distinct role in Th17-induced preventive and therapeutic antitumor immunity. Cancer Immunol Immunother. 2011;60:1473–1484. doi: 10.1007/s00262-011-1054-y. - DOI - PMC - PubMed
    1. Ansel JC, Brown JR, Payan DG, Brown MA. Substance P selectively activates TNF-alpha gene expression in murine mast cells. J Immunol. 1993;150:4478–4485. - PubMed
    1. Armbruster BN, Li X, Pausch MH, Herlitze S, Roth BL. Evolving the lock to fit the key to create a family of G protein-coupled receptors potently activated by an inert ligand. Proc Natl Acad Sci U S A. 2007;104:5163–5168. doi: 10.1073/pnas.0700293104. - DOI - PMC - PubMed

Publication types

MeSH terms

Substances