Review
. 2021 Dec 1;11(12):2968-2986.
doi: 10.1158/2159-8290.CD-21-0634.

Detecting Liquid Remnants of Solid Tumors: Circulating Tumor DNA Minimal Residual Disease

Affiliations
Review

Detecting Liquid Remnants of Solid Tumors: Circulating Tumor DNA Minimal Residual Disease

Everett J Moding et al. Cancer Discov. .

Abstract

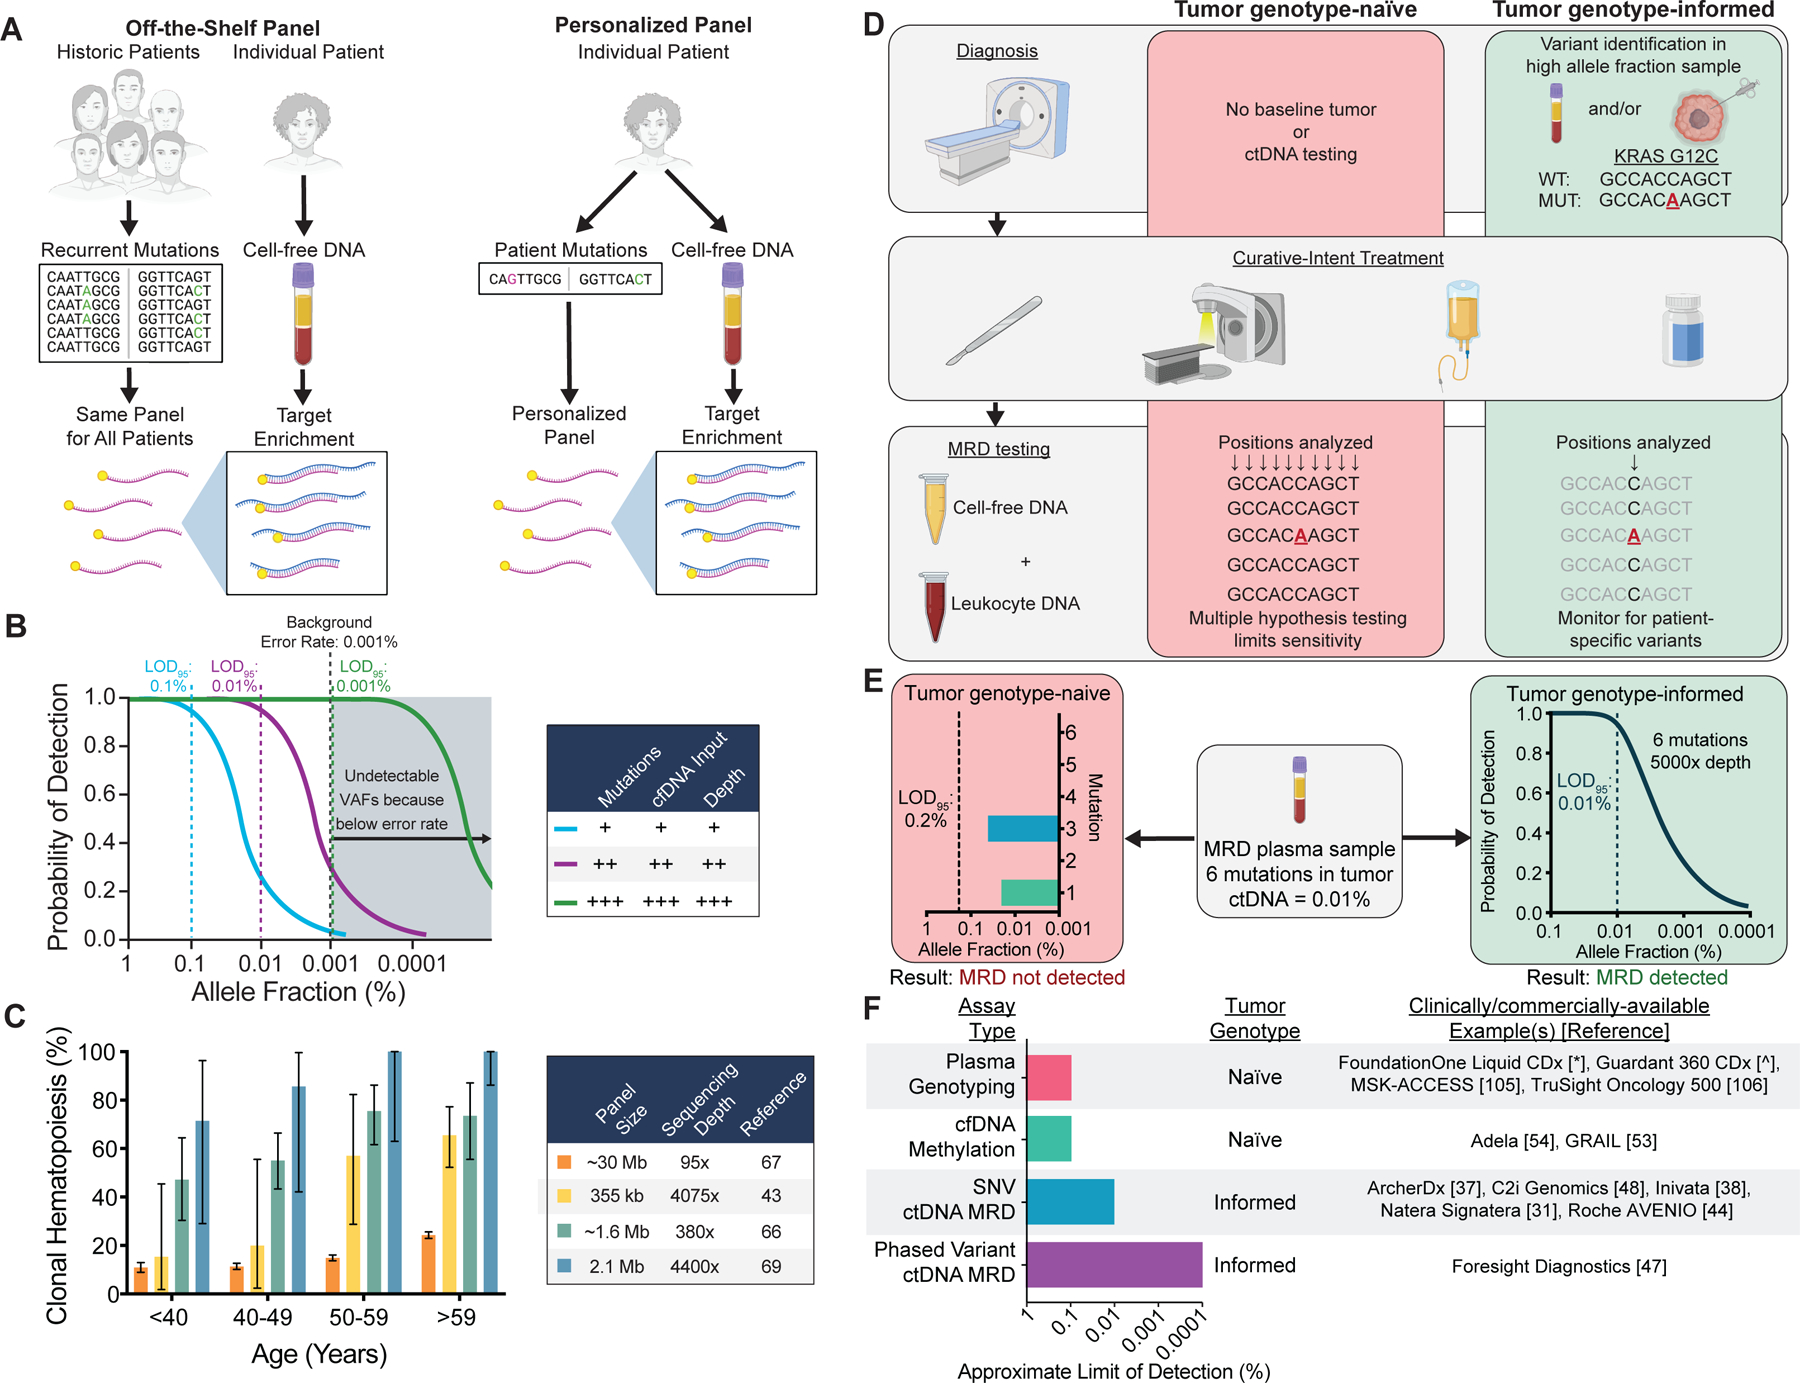
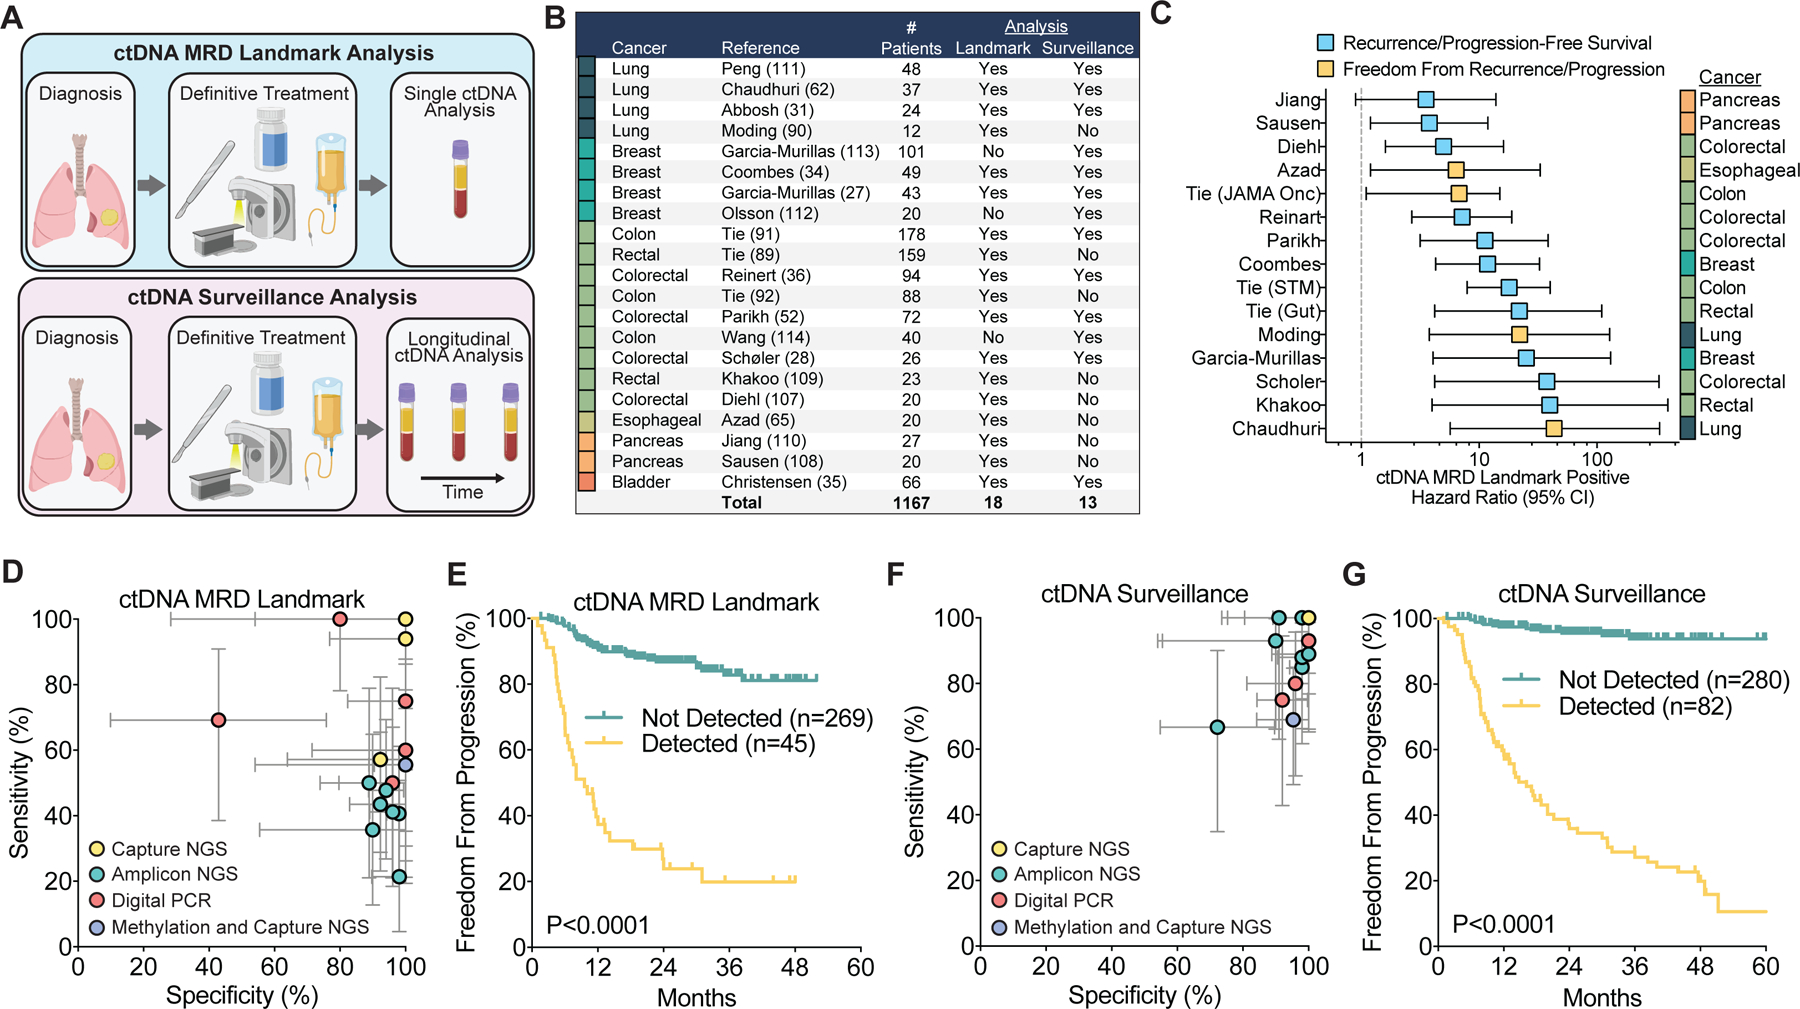
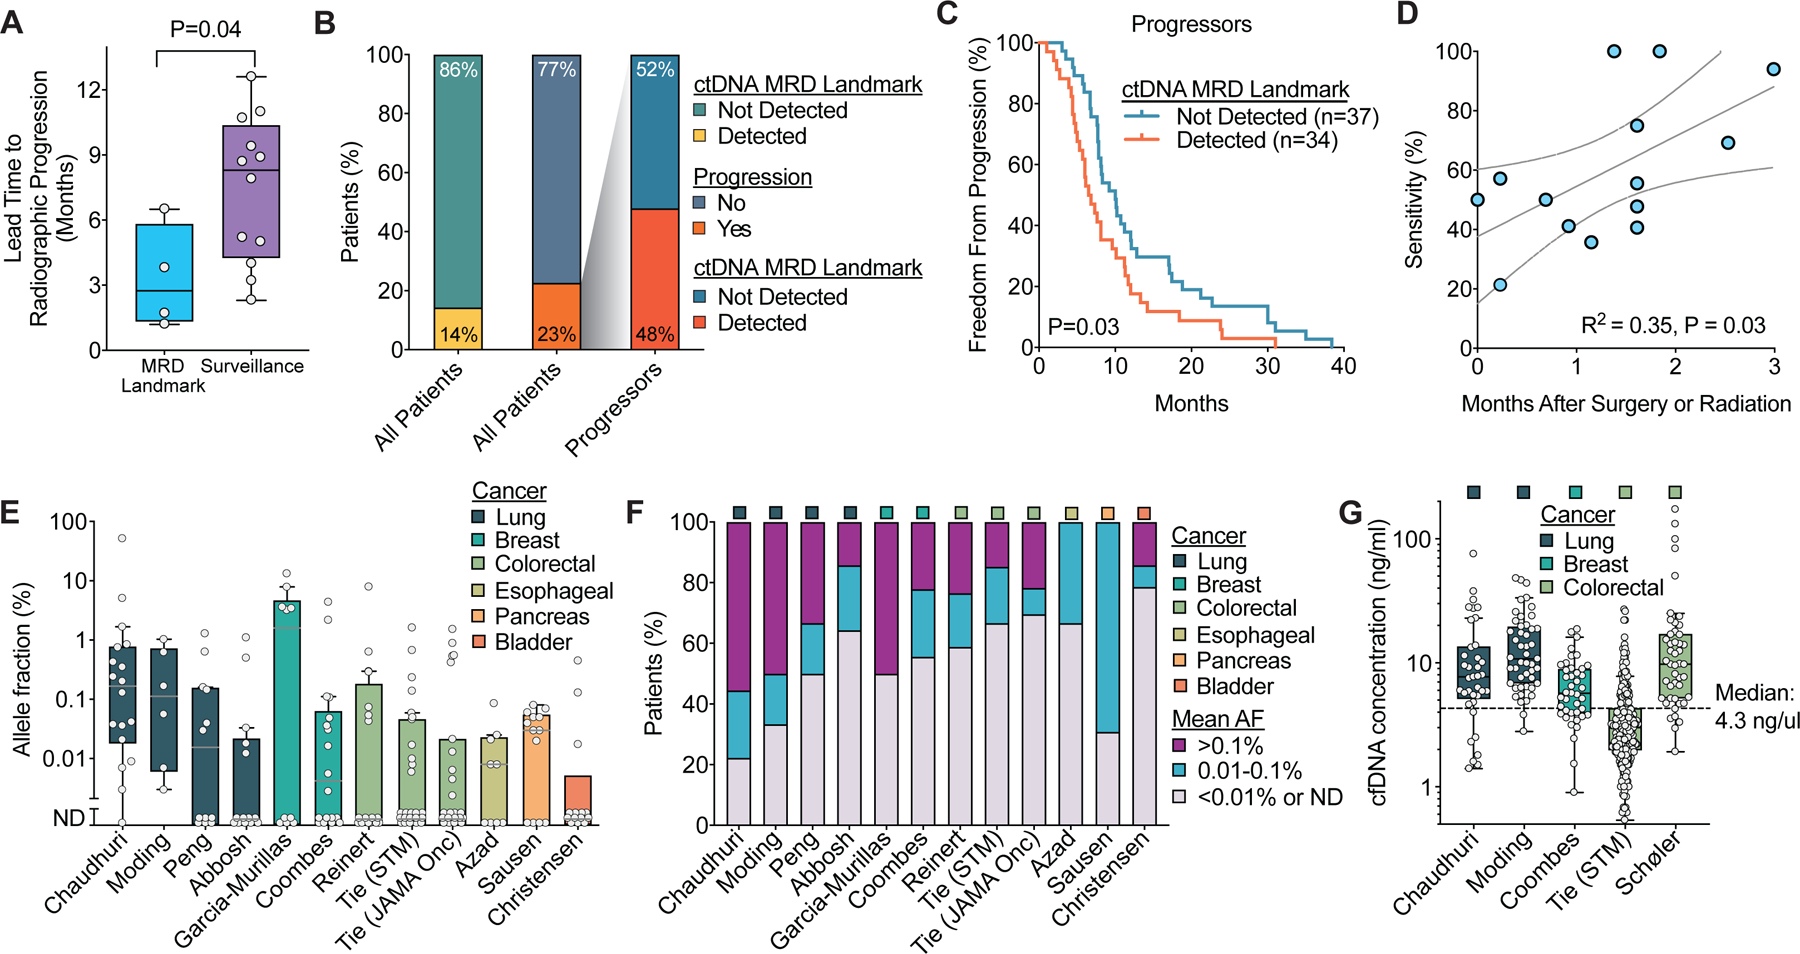
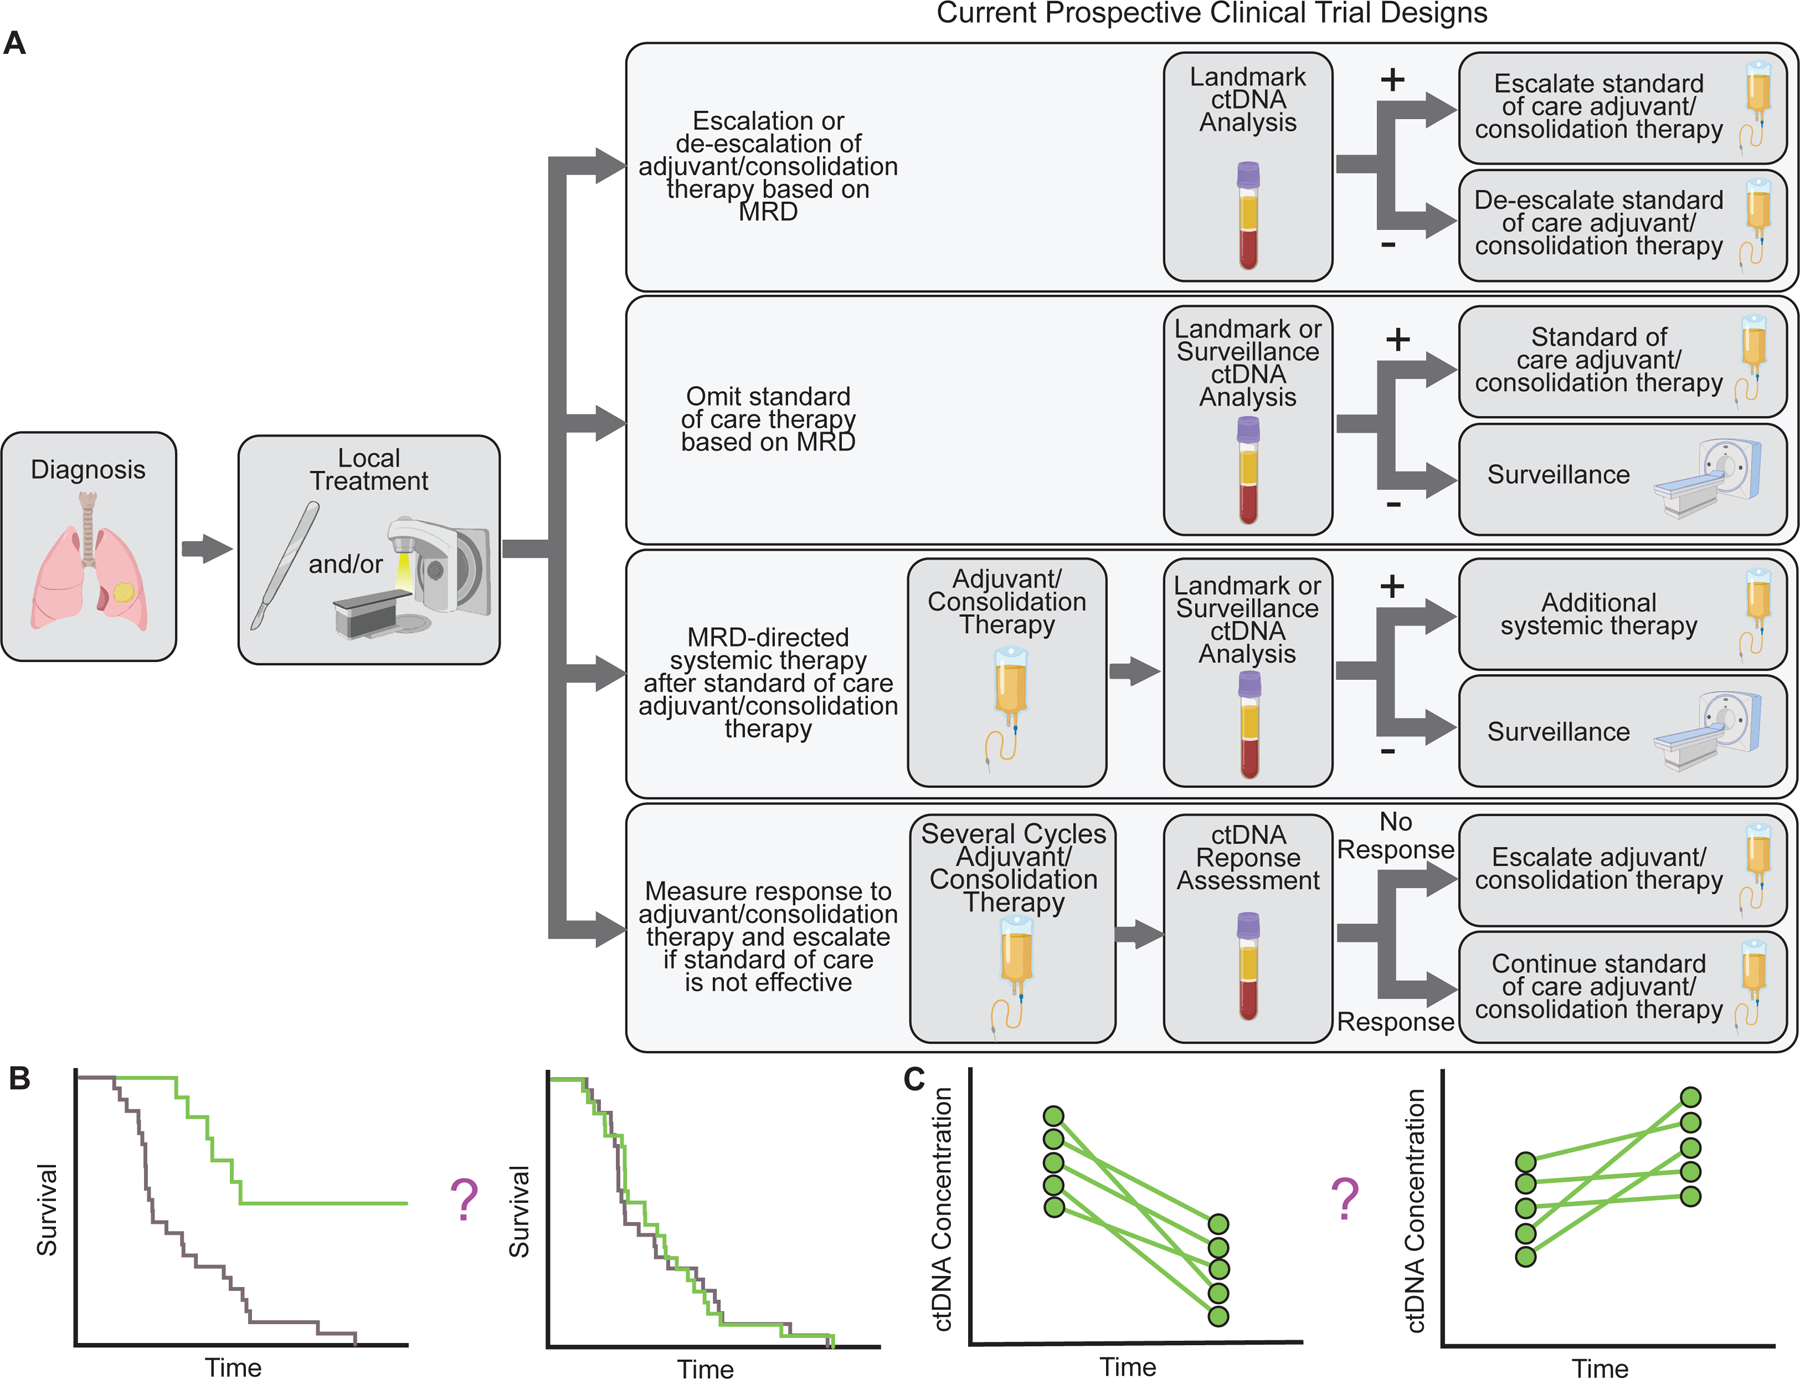
Growing evidence demonstrates that circulating tumor DNA (ctDNA) minimal residual disease (MRD) following treatment for solid tumors predicts relapse. These results suggest that ctDNA MRD could identify candidates for adjuvant therapy and measure response to such treatment. Importantly, factors such as assay type, amount of ctDNA release, and technical and biological background can affect ctDNA MRD results. Furthermore, the clinical utility of ctDNA MRD for treatment personalization remains to be fully established. Here, we review the evidence supporting the value of ctDNA MRD in solid cancers and highlight key considerations in the application of this potentially transformative biomarker.

Significance: ctDNA analysis enables detection of MRD and predicts relapse after definitive treatment for solid cancers, thereby promising to revolutionize personalization of adjuvant and consolidation therapies.


Conflict of interest statement

Competing Interests

E.J.M. has served as a paid consultant for DeciBio. B.Y.N. is currently an employee and stockholder at Roche/Genentech and has patent filings related to immunomodulatory RNA and cancer biomarkers. A.A.A. and M.D. are co-inventors on patent applications related to CAPP-Seq and have patent filings related to other cancer biomarkers. A.A.A. reports ownership interest in CiberMed and Foresight Diagnostics, paid consultancy from Roche/Genentech and Gilead, and research support from BMS. M. Diehn reports research funding from Varian Medical Systems, AstraZeneca, and Illumina, ownership interest in CiberMed and Foresight Diagnostics, patent filings related to cancer biomarkers, paid consultancy from AstraZeneca, Genentech, Novartis, Boehringer Ingelheim, Illumina, Roche Sequencing Solutions, Gritstone Oncology, and BioNTech, and travel/honoraria from RefleXion.

Figures

Figure 1:
Figure 1:
Technical approaches for ctDNA MRD detection and factors affecting assay sensitivity and specificity. A) Schematic comparing assays using off-the-shelf versus personalized sequencing panels. Off-the-shelf panels are designed to cover recurrently mutated genes in the cancer type(s) of interest. The same panel is applied to tumor tissue and plasma of every patient, and personalization is achieved by bioinformatically considering only the positions mutated in the matched tumor . Personalized panels are designed to cover patient-specific mutations identified through sequencing of their tumor DNA. In this approach, personalization is achieved by every patient having a unique panel. B) Factors affecting the probability of ctDNA detection. Increasing the number of mutations tracked, the sequencing depth at mutant positions, or the cfDNA input can increase the probability of detection. Technical background from sources such as polymerase errors and oxidative damage sets the lower limit of detection due to an inability to distinguish artifacts from true tumor variants. Limit of detection with 95% probability = LOD95. C) Prevalence of at least 1 clonal hematopoiesis variant detected in plasma as a function of the sequencing panel size and sequencing depth in published studies (,–77). Error bars represent binomial 95% confidence intervals. D) Schematic of tumor genotype-informed versus tumor genotype-naïve ctDNA analysis. In genotype-naïve analysis, the MRD sample is interrogated at all sequenced genomic positions, leading to reduced sensitivity due to multiple hypothesis testing. In tumor genotype-informed analysis, variants are identified from tumor tissue or pre-treatment plasma samples with high tumor allele fraction. Only patient-specific variants are monitored in the MRD sample. In both cases, genotyping DNA from leukocytes in the peripheral blood can improve specificity by identifying variants stemming from clonal hematopoiesis. E) Comparison of the LODs of tumor genotype-naïve and tumor genotype-informed ctDNA analysis at a median sequencing depth of 5000× for a patient with 6 tumor mutations and a ctDNA allele fraction of 0.01%. Due to multiple hypothesis testing with tumor genotype-naïve analysis, the LOD95 is 0.2%, and no mutations are detected above background despite mutations with allele fractions of 0.02% (1/5000 molecules) and 0.04% (2/5000 molecules) being present in the sample. In contrast, in the same sample tumor genotype-informed analysis at 5000× depth is associated with an LOD95 of 0.01% (approximated by a binomial distribution), and therefore ctDNA MRD has a 95% chance of being detected. F) Summary of assay types, tumor genotyping requirements, and approximate LODs (i.e. analytical sensitivity) for commercially/clinically available ctDNA analysis tests. Since no data comparing these methods on the same samples are available, the approximate limit of detection at which 95% of samples would be expected to be called positive for each group of assays is estimated from published manuscripts and/or conference abstracts and rounded to the nearest log (31,37,38,44,47,48,53,54,105,106). * = http://www.accessdata.fda.gov/cdrh_docs/pdf19/P190032B.pdf ^ = https://www.accessdata.fda.gov/cdrh_docs/pdf20/P200010B.pdf
Figure 2:
Figure 2:
Performance of ctDNA analysis approaches for detecting MRD in solid tumors. A) Schematic comparing MRD landmark and surveillance ctDNA analysis. MRD landmark analysis determines the ctDNA status of a patient at one defined timepoint, shortly after completing curative therapy. Surveillance analysis evaluates multiple post-treatment blood draws over time, and patients are considered positive if ctDNA is detected in any sample. B) Summary table of studies included in the analysis. C) Summary of hazard ratios with 95% confidence intervals for freedom from recurrence/progression or recurrence/progression-free survival in published studies using MRD landmark analysis. D) Clinical sensitivity and specificity for ctDNA detection at the first post-treatment time point (ctDNA MRD landmark) (,,,–,,,,–,–111). Clinical sensitivity is defined as the percentage of patients who relapsed in the follow up period and who were ctDNA positive at the landmark. Clinical specificity is defined as the percentage of patients who did not relapse in the follow up period who were ctDNA negative at the landmark. Patients who received adjuvant/consolidation therapy after ctDNA testing were excluded. Each study is colored based on the ctDNA analysis approach utilized. Error bars represent binomial 95% confidence intervals. E) Freedom from progression from the start of therapy based on ctDNA detection using MRD landmark analysis combining studies with individual patient survival reported (35,90,91,108,111). Studies with a median time of first blood collection after completing surgery or radiation therapy of greater than 20 weeks were excluded to minimize guarantee-time bias. Median time of first blood draw after completing surgery or radiation therapy for included studies was 7 weeks (range 2 hours to 11 weeks). P-value calculated using a two-sided log-rank test. F) Clinical sensitivity and specificity for ctDNA detection with longitudinal monitoring post-treatment (ctDNA Surveillance) (,,,–,,,,–114). Error bars represent binomial 95% confidence intervals. G) Freedom from progression from the start of therapy based on ctDNA detection using surveillance analysis across studies with individual patient survival reported (35,91,111,112,114). P-value calculated using a two-sided log-rank test.
Figure 3:
Figure 3:
Summary of lead times and ctDNA levels after curative-intent therapy in solid tumors. A) Comparison of lead time from blood draw to progression on standard of care imaging for ctDNA MRD landmark (65,90,92,108) and ctDNA surveillance studies (,,,–,,,–114). Boxes represent median and interquartile range (IQR) and whiskers represent 1.5 times the IQR per the Tukey method. B-C) Analysis of outcomes by ctDNA status at the MRD landmark among patients who ultimately developed progressive disease using the studies from Figure 2E to assess the possibility that patients who are ctDNA negative at the MRD landmark but ultimately progress have more indolent disease. B) Stacked box plot summarizing the proportion of all patients and proportion of progressors with ctDNA MRD detected. C) Freedom from progression from the start of therapy based on ctDNA MRD detection only in patients who developed progressive disease. P-value calculated using a two-sided log-rank test. D) Linear correlation of clinical sensitivity for landmark MRD studies with the median time after completing surgery or radiation therapy for the ctDNA landmark blood draw. Studies with a median time of greater than 20 weeks were excluded. Line of best fit is shown with 95% confidence intervals. E) Box plots of mean ctDNA allele fraction at the first post-treatment time point across studies in patients who ultimately relapsed. Only studies with allele fractions reported are included. Boxes represent median and IQR and whiskers represent 1.5 times the IQR per the Tukey method. F) Distribution of mean allele fractions at the first post-treatment time point in the studies from E. G) Box plots of cfDNA concentration at the first blood draw after completing local therapy across studies. Boxes represent median and IQR and whiskers represent 1.5 times the IQR per the Tukey method.
Figure 4:
Figure 4:
Examples of designs of ongoing interventional clinical trials testing personalization of adjuvant/consolidation therapy based on ctDNA MRD. A) Schematic depicting examples of ongoing interventional clinical trials using ctDNA MRD to guide treatment. B-C) Potential clinical trial endpoints for ctDNA MRD studies. B) Survival (overall survival, disease free survival, or event free survival) for patients managed based on ctDNA MRD can be compared with a control arm or historical cohort or patients managed according to standard of care. C) For patients with ctDNA MRD, ctDNA clearance or change in ctDNA concentration could be used as a surrogate endpoint.

Similar articles

Cited by

References

    1. Siegel RL, Miller KD, Fuchs HE, Jemal A. Cancer Statistics, 2021. CA Cancer J Clin. 2021;71:7–33. - PubMed
    1. Luskin MR, Murakami MA, Manalis SR, Weinstock DM. Targeting minimal residual disease: a path to cure? Nat Rev Cancer. 2018;18:255–63. - PMC - PubMed
    1. Goddard ET, Bozic I, Riddell SR, Ghajar CM. Dormant tumour cells, their niches and the influence of immunity. Nat Cell Biol. 2018;20:1240–9. - PubMed
    1. Pignon J-P, Tribodet H, Scagliotti GV, Douillard J-Y, Shepherd FA, Stephens RJ, et al. Lung adjuvant cisplatin evaluation: a pooled analysis by the LACE Collaborative Group. J Clin Oncol. 2008;26:3552–9. - PubMed
    1. Sargent D, Sobrero A, Grothey A, O’Connell MJ, Buyse M, Andre T, et al. Evidence for cure by adjuvant therapy in colon cancer: observations based on individual patient data from 20,898 patients on 18 randomized trials. J Clin Oncol. 2009;27:872–7. - PMC - PubMed

Publication types

MeSH terms