

Insulin sensitivity variations in apparently healthy Arab male subjects: correlation with insulin and C peptide
- PMID: 34785564
- PMCID: PMC8596034
- DOI: 10.1136/bmjdrc-2020-002039
Insulin sensitivity variations in apparently healthy Arab male subjects: correlation with insulin and C peptide
Abstract
Introduction: Decreased insulin sensitivity occurs early in type 2 diabetes (T2D). T2D is highly prevalent in the Middle East and North Africa regions. This study assessed the variations in insulin sensitivity in normal apparently healthy subjects and the levels of adiponectin, adipsin and inflammatory markers.
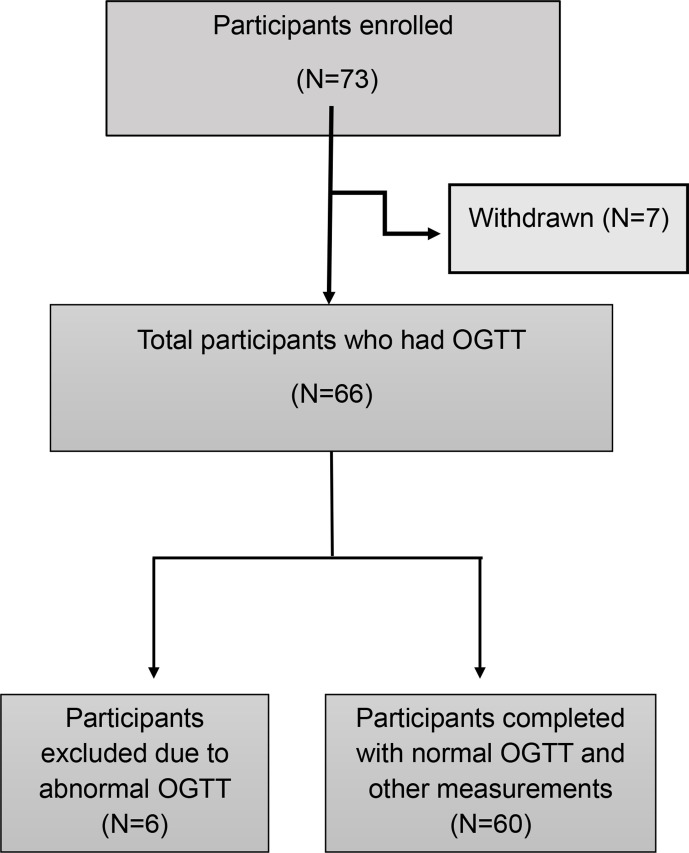
Research design and methods: A total of 60 participants (aged 18-45, body mass index <28) with a normal oral glucose tolerance test (OGTT) completed hyperinsulinemic-euglycemic clamp (40 mU/m2/min) and body composition test by dual-energy X-ray absorptiometry scan. Blood samples were assayed for glucose, insulin, C peptide, inflammatory markers, oxidative stress markers, adiponectin and adipsin.
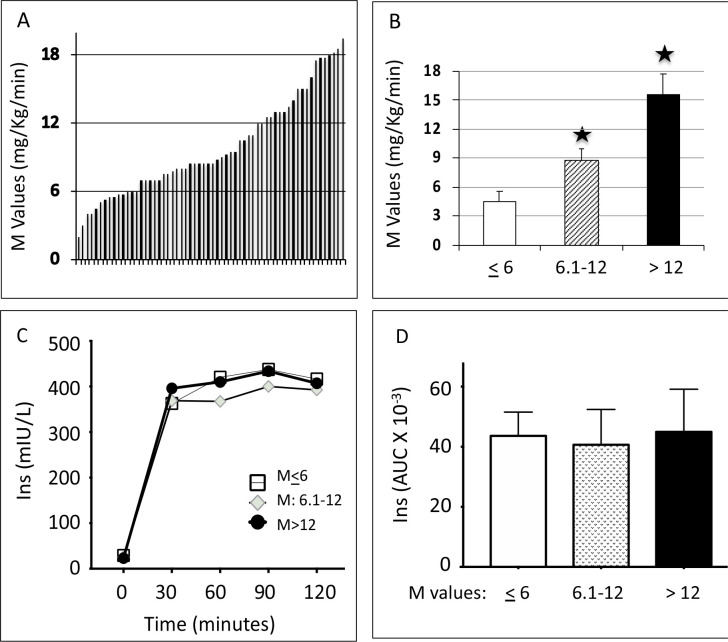
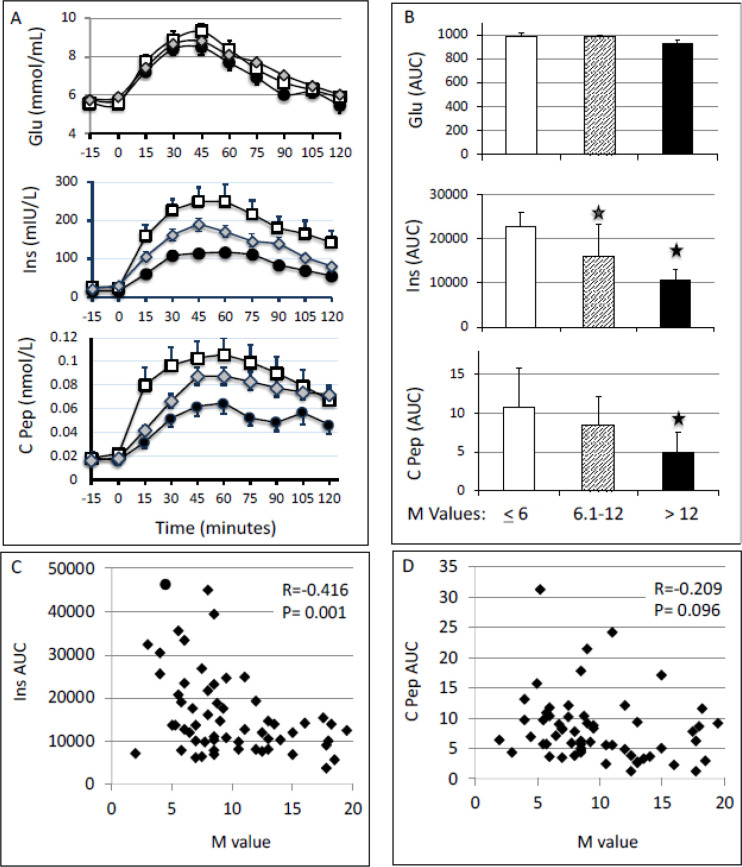
Results: The subjects showed wide variations in the whole-body glucose disposal rate (M value) from 2 to 20 mg/kg/min and were divided into three groups: most responsive (M>12 mg/kg/min, n=17), least responsive (M≤6 mg/kg/min, n=14) and intermediate responsive (M=6.1-12 mg/kg/min, n=29). Insulin and C peptide responses to OGTT were highest among the least insulin sensitive group. Triglycerides, cholesterol, alanine transaminase (ALT) and albumin levels were higher in the least responsive group compared with the other groups. Among the inflammatory markers, C reactive protein (CRP) was highest in the least sensitivity group compared with the other groups; however, there were no differences in the level of soluble receptor for advanced glycation end products and Tumor Necrosis Factor Receptor Superfamily 1B (TNFRS1B). Plasma levels of insulin sensitivity markers, adiponectin and adipsin, and oxidative stress markers, oxidized low-density lipoprotein, total antioxidant capacity and glutathione peroxidase 1, were similar between the groups.
Conclusions: A wide range in insulin sensitivity and significant differences in triglycerides, cholesterol, ALT and CRP concentrations were observed despite the fact that the study subjects were homogenous in terms of age, gender and ethnic background, and all had normal screening comprehensive chemistry and normal glucose response to OGTT. The striking differences in insulin sensitivity reflect differences in genetic predisposition and/or environmental exposure. The low insulin sensitivity status associated with increased insulin level may represent an early stage of metabolic abnormality.
Keywords: diabetes mellitus; glucose tolerance test; hyperinsulinism; insulin resistance; type 2.
© Author(s) (or their employer(s)) 2021. Re-use permitted under CC BY-NC. No commercial re-use. See rights and permissions. Published by BMJ.
Conflict of interest statement
Competing interests: None declared.
Figures
Similar articles
-
The Clamp-Like Index: a novel and highly sensitive insulin sensitivity index to calculate hyperinsulinemic clamp glucose infusion rates from oral glucose tolerance tests in nondiabetic subjects.Diabetes Care. 2007 Sep;30(9):2374-80. doi: 10.2337/dc07-0422. Epub 2007 Jun 26. Diabetes Care. 2007. PMID: 17595351
-
Metabolic predictors of impaired glucose tolerance and type 2 diabetes in a predisposed population--A prospective cohort study.BMC Endocr Disord. 2015 Sep 25;15:51. doi: 10.1186/s12902-015-0048-8. BMC Endocr Disord. 2015. PMID: 26407933 Free PMC article.
-
The inflammatory status score including IL-6, TNF-α, osteopontin, fractalkine, MCP-1 and adiponectin underlies whole-body insulin resistance and hyperglycemia in type 2 diabetes mellitus.Acta Diabetol. 2014 Feb;51(1):123-31. doi: 10.1007/s00592-013-0543-1. Epub 2013 Dec 27. Acta Diabetol. 2014. PMID: 24370923
-
Factors influencing insulin sensitivity during hyperinsulinemic-euglycemic clamp in healthy Korean male subjects.Diabetes Metab Syndr Obes. 2019 Apr 10;12:469-476. doi: 10.2147/DMSO.S195350. eCollection 2019. Diabetes Metab Syndr Obes. 2019. PMID: 31114276 Free PMC article.
-
Inflammation, insulin resistance, and adiposity: a study of first-degree relatives of type 2 diabetic subjects.Diabetes Care. 2004 Aug;27(8):2033-40. doi: 10.2337/diacare.27.8.2033. Diabetes Care. 2004. PMID: 15277436
Cited by
-
iPSCs derived from insulin resistant offspring of type 2 diabetic patients show increased oxidative stress and lactate secretion.Stem Cell Res Ther. 2022 Aug 20;13(1):428. doi: 10.1186/s13287-022-03123-4. Stem Cell Res Ther. 2022. PMID: 35987697 Free PMC article.
-
Circulating total and H-specific GDF15 levels are elevated in subjects with MASLD but not in hyperlipidemic but otherwise metabolically healthy subjects with obesity.Cardiovasc Diabetol. 2024 May 18;23(1):174. doi: 10.1186/s12933-024-02264-5. Cardiovasc Diabetol. 2024. PMID: 38762719 Free PMC article. Clinical Trial.
-
Glucose Fluctuation Inhibits Nrf2 Signaling Pathway in Hippocampal Tissues and Exacerbates Cognitive Impairment in Streptozotocin-Induced Diabetic Rats.J Diabetes Res. 2024 Jan 19;2024:5584761. doi: 10.1155/2024/5584761. eCollection 2024. J Diabetes Res. 2024. PMID: 38282656 Free PMC article.
-
Daytime and nighttime glycemic control with control-IQ technology vs. standard therapy in type 1 diabetes: a systematic review and meta-analysis with trial sequential analysis and GRADE assessment.Diabetol Metab Syndr. 2025 Aug 12;17(1):325. doi: 10.1186/s13098-025-01906-2. Diabetol Metab Syndr. 2025. PMID: 40790781 Free PMC article. Review.
-
Association between various insulin resistance surrogates and gallstone disease based on national health and nutrition examination survey.Sci Rep. 2025 Jul 16;15(1):25877. doi: 10.1038/s41598-025-09482-1. Sci Rep. 2025. PMID: 40670519 Free PMC article.
References
Publication types
MeSH terms
Substances
LinkOut - more resources
Full Text Sources
Medical
Research Materials
Miscellaneous