. 2021 Nov 23;118(47):e2115410118.
doi: 10.1073/pnas.2115410118.

Decidual NK cells kill Zika virus-infected trophoblasts

Affiliations

Decidual NK cells kill Zika virus-infected trophoblasts

Sumit Sen Santara et al. Proc Natl Acad Sci U S A. .

Abstract

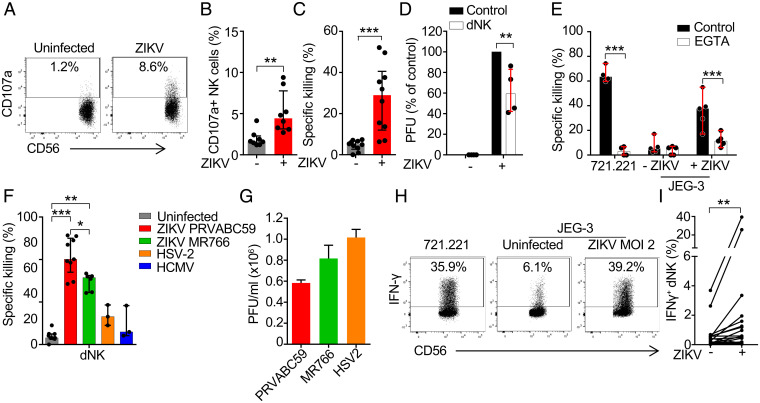
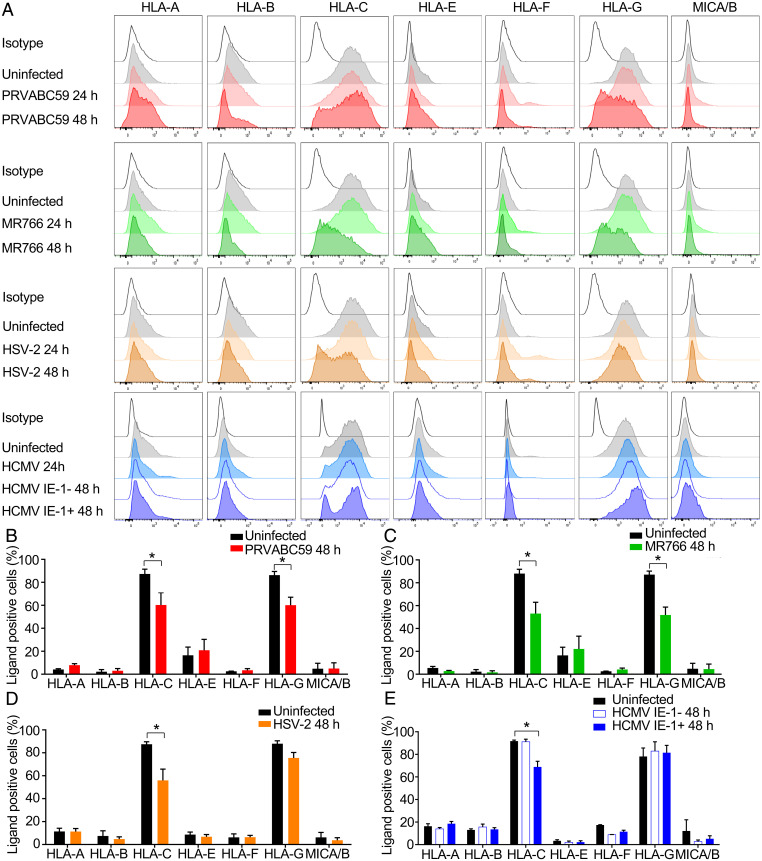
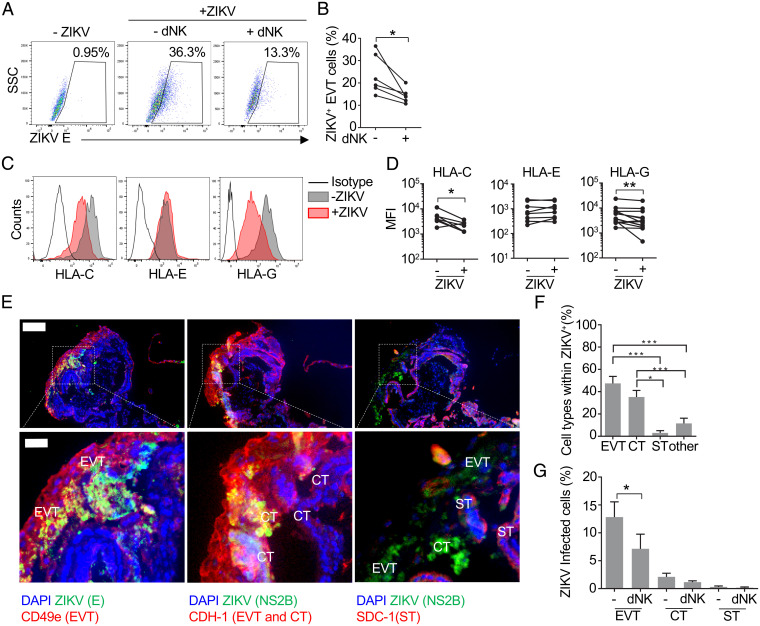
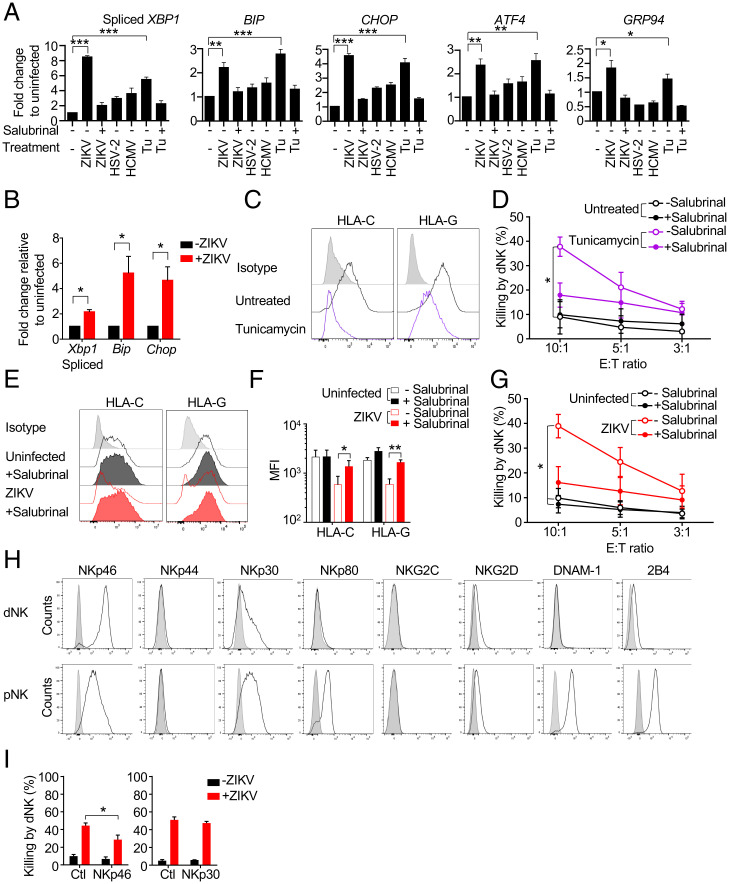
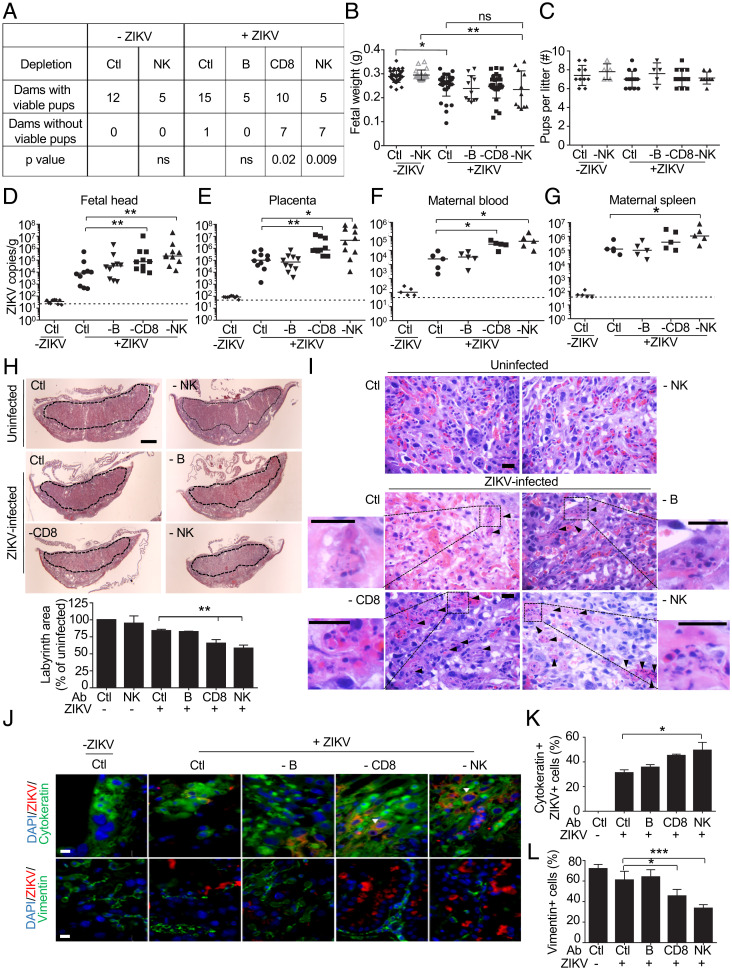
Zika virus (ZIKV) during pregnancy infects fetal trophoblasts and causes placental damage and birth defects including microcephaly. Little is known about the anti-ZIKV cellular immune response at the maternal-fetal interface. Decidual natural killer cells (dNK), which directly contact fetal trophoblasts, are the dominant maternal immune cells in the first-trimester placenta, when ZIKV infection is most hazardous. Although dNK express all the cytolytic molecules needed to kill, they usually do not kill infected fetal cells but promote placentation. Here, we show that dNK degranulate and kill ZIKV-infected placental trophoblasts. ZIKV infection of trophoblasts causes endoplasmic reticulum (ER) stress, which makes them dNK targets by down-regulating HLA-C/G, natural killer (NK) inhibitory receptor ligands that help maintain tolerance of the semiallogeneic fetus. ER stress also activates the NK activating receptor NKp46. ZIKV infection of Ifnar1 -/- pregnant mice results in high viral titers and severe intrauterine growth restriction, which are exacerbated by depletion of NK or CD8 T cells, indicating that killer lymphocytes, on balance, protect the fetus from ZIKV by eliminating infected cells and reducing the spread of infection.

Keywords: ER stress; ZIKV; decidual NK; extravillous trophoblast; pregnancy.


Conflict of interest statement

The authors declare no competing interest.

Figures

Fig. 1.
Fig. 1.
dNK kill ZIKV-infected JEG-3. (A and B) Representative flow cytometry plots (A) and median proportion (B) of dNK degranulating to uninfected and ZIKV PRVABC59–infected JEG-3 (8-h coculture, effector:target [E:T] ratio 1:3) (n = 8). (C) dNK specific killing of uninfected and ZIKV PRVABC59–infected JEG-3 (n = 10). (D) Viral plaque assay (on Vero cells) of supernatants after 8-h coculture of ZIKV PRVABC59–infected JEG-3 with dNK (E:T ratio 10:1), relative to infected JEG-3 without added NK cells (n = 4). PFU, plaque forming units. (E) Effect of EGTA on dNK killing (n = 4). (F) Comparison of dNK specific killing of JEG-3 that were uninfected or infected with indicated viruses (n = 3 to 9). (G) Levels of infection of the indicated viruses in JEG-3. (H) Representative flow cytometry plots of IFN-γ production by dNK after 8-h coculture with 721.221 or uninfected and ZIKV PRVABC59 infected JEG-3 (MOI 2, E:T ratio 1:3) (I) and percentage of IFN-γ producing dNK in response to infection (n = 21). Killing assays in C, E, and F were 8-h 51Cr release assays performed at an E:T ratio of 10:1. Bars show median ± interquartile range (BF) of biological replicates or mean ± SEM (G) of three independent experiments. In all infection experiments, ZIKV (PRVABC59 and MR766), MOI = 2; HSV-2, MOI = 0.5; HCMV, MOI = 3. *P < 0.05; **P < 0.01; ***P < 0.001 by Wilcoxon rank sum test (B–E and I), nonparametric unpaired ANOVA (Kruskal–Wallis test) followed by Dunn’s posttest (F), and nonparametric paired ANOVA (Friedman’s test) followed by Dunn’s posttest (G).
Fig. 2.
Fig. 2.
ZIKV infection down-regulates HLA-C and HLA-G in JEG-3. (A–E) Representative flow cytometry plots (A) or mean ± SEM values (three to five independent experiments) (B–E) of the percentage of HLA and MICA/B positive fractions on uninfected JEG-3 or JEG-3 infected with ZIKV PRVABC59 (MOI 2) (B), ZIKV MR766 (MOI 2) (C), HSV-2 (MOI 0.5) (D), or HCMV (MOI 3) (E) for indicated times. IE-1, immediate early protein 1. *P < 0.05 by Wilcoxon rank sum test (B–E).
Fig. 3.
Fig. 3.
ZIKV mostly infects extravillous and cytotrophoblasts in placental explants and down-regulates HLA-G and HLA-C in isolated EVT. (A) Representative flow cytometry dot plots of intracellular staining for ZIKV protein E in purified primary EVT that were uninfected (Left) or infected with ZIKV (1012 PFU) and cultured alone for 36 h (Middle) or alone for 24 h followed by 12-h coculture with autologous dNK (E:T ratio 10:1) (Right). (B) Percentage of ZIKV+ cells in purified infected EVT cultures that were cocultured or not with a 10-fold excess of autologous dNK (n = 6) for 12 h (after 24-h infection). (C) Representative flow cytometry histograms of HLA-C (Left), HLA-E (Middle), and HLA-G (Right) surface expression in uninfected and ZIKV-infected (24 h, 1012 PFU) isolated purified EVT. (D) Mean fluorescence intensity (MFI) of HLA-C (Left), HLA-E (Middle), and HLA-G (Right) in uninfected or ZIKV-infected purified EVT (n = 7 to 13). (E) Representative immunofluorescence images of three consecutive 5-µm cryosections of a placental villous tree infected with ZIKV-PRVABC59 for 72 h (108 PFU) and stained for DAPI, ZIKV proteins (NS2B and E), integrin-α5/CD49a (EVT marker), E-cadherin (CDH-1, cytotrophoblast [CT] and EVT marker), and SDC-1 (syncytiotrophoblast [ST] marker). Cell types were identified by surface marker staining, nuclear size, and localization in tissue. (Scale bar, 100 µm [insets in the bottom, 25 µm].) (F) Distribution of ZIKV-infected placental cell types 72 h after infection of 3D villous explants. Bars represent the mean ± SEM of the percentages calculated in 10 to 15 imaging fields (217× magnification) from three donors. (G) Percentage of EVT, CT, and ST infected with ZIKV in the presence or absence of autologous dNK. Bars represent the mean ± SEM of the percentages calculated in 10 to 15 imaging fields (217× magnification) from three donors. *P < 0.05; **P < 0.01; ***P < 0.001 by Wilcoxon rank sum test (B and D), paired nonparametric ANOVA (Friedman’s test) followed by Dunn’s posttest comparing each cell type to each other (F), and Kolmogorov–Smirnov test (G).
Fig. 4.
Fig. 4.
ZIKV-induced ER stress mediates HLA-C and -G down-regulation and NK killing. (A) ER stress, assessed by XBP1 splicing and increases in BIP, CHOP, ATF4, and GRP94 mRNA in JEG-3 that were uninfected or infected with ZIKV PRVABC59, HSV-2, or HCMV for 1 to 2 d or treated with tunicamycin (Tu) for 1 d. Some samples were pretreated with the ER stress inhibitor salubrinal as indicated. mRNA levels, determined by qRT-PCR, were normalized to ACTB (n = 3 independent experiments). (B) Assessment of ER stress in total mRNA harvested from E15.5 placentas of pregnant Ifnar1−/− dams that were uninfected or ZIKV-infected with ZIKV PRVABC59 on E6.5 (n = 4). mRNAs were measured by qRT-PCR, normalized to Actb, and shown relative to uninfected mouse placentas. (C) Representative flow cytometry histograms of the effect of 24-h tunicamycin treatment on the expression of HLA-C and –G in JEG-3. (D) Specific dNK killing (8-h Cr release assay) of JEG-3 that were treated or not with tunicamycin for 24 h in the presence or absence of salubrinal (n = 3). (E) Representative flow cytometry histograms and (F) mean fluorescence intensity (MFI) of HLA-C and HLA-G expression in uninfected or ZIKV PRVABC59–infected JEG-3 that had been pretreated or not with salubrinal (n = 3 independent experiments). (G) Specific dNK killing (8-h Cr release assay) of uninfected and ZIKV PRVABC59–infected JEG-3 that had been pretreated or not with salubrinal (n = 5). (H) Representative flow cytometry histograms of expression of activating receptors in freshly isolated dNK and pNK. (I) Effect of blocking antibodies for the indicated receptors on dNK killing of uninfected (black) or ZIKV-infected (red) JEG3 (8-h Cr release, E:T ratio 10:1) (n = 3 to 9). Ctl, control antibody. Bars represent mean ± SEM. In all infection experiments, ZIKV (PRVABC59 and MR766), MOI = 2; HSV-2, MOI = 0.5; and HCMV, MOI = 3. *P < 0.05; **P < 0.01; ***P < 0.001 by unpaired one-way ANOVA (A), unpaired t test (B and F), nonparametric paired ANOVA (Friedman’s test followed by Dunn’s posttest) of areas under curves (D and G), and Wilcoxon rank sum test (I).
Fig. 5.
Fig. 5.
NK or CD8 T cell depletion compromises pregnancy after ZIKV PRVABC59 infection of A129 mice. (A) Pregnancy outcome of uninfected and ZIKV PRVABC59–infected (103 PFU on E6.5) Ifnar1−/− dams, treated with control antibody or depleted of B cells, CD8, or NK cells before and after infection (P values by χ2-square test comparing specific depletion with control [Ctl] antibody). (B and C) Fetal weight (B) (n = 11 to 36) and number of pups/litter (C) (n = 5 to 15) on E15.5. (D–G) Viral burden (by qRT-PCR relative to Actb) on E15.5 in fetal head (D) (n = 10), placenta (E) (n = 10), and maternal serum (F) (n = 5) and spleen (G) (n = 5) of the same dams. Data represent individual mice, pooled from two or three independent experiments. Dotted lines represent the limit of sensitivity of the assay. (H) Representative hematoxylin and eosin staining of mouse placentas on E15.5 from mice treated with control (Ctl) or depleting antibodies (Top, labyrinth marked by dotted line; scale bar, 1 mm) and mean labyrinth cross-sectional area compared to uninfected control mice given Ctl antibody (Ab) (Bottom) (n = 3). (I) Representative hematoxylin and eosin–stained mouse placental sections from uninfected and ZIKV-infected dams treated with control or indicated depleting antibody on E15.5. Arrows indicate apoptotic cells and insets display magnified images of the indicated area. (Scale bar, 10 µm.) (J) Representative immunofluorescence microscopy images of placentas from uninfected or ZIKV-infected pregnant dams treated with Ctl or depleting antibody and stained for cytokeratin (CK, trophoblast marker) or vimentin (V, endothelial/stromal cell marker) and ZIKV proteins (mouse serum against ZIKV) and DAPI. Infected giant trophoblasts are indicated by arrows. (Scale bars, 10 µm.) (K) Mean percentage of CK+ cells that stain for ZIKV in placentas from uninfected or ZIKV-infected pregnant dams treated with control or depleting Ab (n = 4 or 5 mice per group). (L) Percentage of V+ cells per high-power field in infected placentas compared to placentas from uninfected mice treated with Ctl Ab (n = 4 or 5 mice per group). Bar graphs show mean ± SEM. *P < 0.05; **P < 0.01; ***P < 0.001 (B, C, H, K, and L) by ordinary one-way ANOVA followed by Tukey’s multiple comparison test and (D–G) by Mann–Whitney U test. ns, not statistically significant.

Similar articles

Cited by

References

    1. Tabata T., et al. , Zika virus targets different primary human placental cells, suggesting two routes for vertical transmission. Cell Host Microbe 20, 155–166 (2016). - PMC - PubMed
    1. Miner J. J., Diamond M. S., Zika virus pathogenesis and tissue tropism. Cell Host Microbe 21, 134–142 (2017). - PMC - PubMed
    1. Yockey L. J., et al. , Vaginal exposure to Zika virus during pregnancy leads to fetal brain infection. Cell 166, 1247–1256.e4 (2016). - PMC - PubMed
    1. Apps R., et al. , Human leucocyte antigen (HLA) expression of primary trophoblast cells and placental cell lines, determined using single antigen beads to characterize allotype specificities of anti-HLA antibodies. Immunology 127, 26–39 (2009). - PMC - PubMed
    1. Apps R., Gardner L., Moffett A., A critical look at HLA-G. Trends Immunol. 29, 313–321 (2008). - PubMed

Publication types