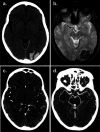
Overview of Imaging Modalities in Stroke
- PMID: 34785603
- PMCID: PMC11418094
- DOI: 10.1212/WNL.0000000000012794
Overview of Imaging Modalities in Stroke
Abstract
Purpose of the review: This article reviews common imaging modalities used in diagnosis and management of acute stroke. Each modality is discussed individually and clinical scenarios are presented to demonstrate how to apply these modalities in decision-making.
Recent findings: Advances in neuroimaging provide unprecedented accuracy in determining tissue viability as well as tissue fate in acute stroke. In addition, advances in machine learning have led to the creation of decision support tools to improve the interpretability of these studies.
Summary: Noncontrast head computed tomography (CT) remains the most commonly used initial imaging tool to evaluate stroke. Its exquisite sensitivity for hemorrhage, rapid acquisition, and widespread availability make it the ideal first study. CT angiography (CTA), the most common follow-up study after noncontrast head CT, is used primarily to identify intracranial large vessel occlusions and cervical carotid or vertebral artery disease. CTA is highly sensitive and can improve accuracy of patient selection for endovascular therapy through delineations of ischemic core. CT perfusion is widely used in endovascular therapy trials and benefits from multiple commercially available machine-learning packages that perform automated postprocessing and interpretation. Magnetic resonance imaging (MRI) and magnetic resonance angiography (MRA) can provide valuable insights for outcomes prognostication as well as stroke etiology. Optical coherence tomography (OCT), positron emission tomography (PET), single-photon emission computerized tomography (SPECT) offer similar insights. In the clinical scenarios presented, we demonstrate how multimodal imaging approaches can be tailored to gain mechanistic insights for a range of cerebrovascular pathologies.
© 2021 American Academy of Neurology.
Conflict of interest statement
A. Czap is funded by a grant from the NIH (2T32NS007412-21). S. Sheth served at the Neuroimaging Core Laboratory for Penumbra COMPLETE registry; performs neuroimaging in his clinical practice and bills for this procedure; and is funded by grants from the NIH (U18EB029353 and R01NS121154), American Academy of Neurology/Society of Vascular and Interventional Neurology, and the Translational Research Institute for Space Health (19-19BRASH-2-0030). Go to
Figures


References
-
- Mettler FA Jr, Huda W, Yoshizumi TT, Mahesh M. Effective doses in radiology and diagnostic nuclear medicine: a catalog. Radiology. 2008;248(1):254-263. - PubMed
-
- Osborn AG. Diagnostic imaging. Brain, 2nd ed. Amirsys; 2010.
-
- von Kummer R, Bourquain H, Bastianello S, et al. . Early prediction of irreversible brain damage after ischemic stroke at CT. Radiology. 2001;219(1):95-100. - PubMed
-
- Wardlaw JM, Mielke O. Early signs of brain infarction at CT: observer reliability and outcome after thrombolytic treatment: systematic review. Radiology. 2005;235(2):444-453. - PubMed
-
- Barber PA, Demchuk AM, Zhang J, Buchan AM. Validity and reliability of a quantitative computed tomography score in predicting outcome of hyperacute stroke before thrombolytic therapy: Alberta Stroke Programme Early CT Score. Lancet. 2000;355(9216):1670-1674. - PubMed
Publication types
MeSH terms
Grants and funding
LinkOut - more resources
Full Text Sources
Medical
Research Materials
