. 2021 Nov 16;12(1):6620.
doi: 10.1038/s41467-021-26733-7.

Programmable viscoelasticity in protein-RNA condensates with disordered sticker-spacer polypeptides

Affiliations

Programmable viscoelasticity in protein-RNA condensates with disordered sticker-spacer polypeptides

Ibraheem Alshareedah et al. Nat Commun. .

Abstract

Liquid-liquid phase separation of multivalent proteins and RNAs drives the formation of biomolecular condensates that facilitate membrane-free compartmentalization of subcellular processes. With recent advances, it is becoming increasingly clear that biomolecular condensates are network fluids with time-dependent material properties. Here, employing microrheology with optical tweezers, we reveal molecular determinants that govern the viscoelastic behavior of condensates formed by multivalent Arg/Gly-rich sticker-spacer polypeptides and RNA. These condensates behave as Maxwell fluids with an elastically-dominant rheological response at shorter timescales and a liquid-like behavior at longer timescales. The viscous and elastic regimes of these condensates can be tuned by the polypeptide and RNA sequences as well as their mixture compositions. Our results establish a quantitative link between the sequence- and structure-encoded biomolecular interactions at the microscopic scale and the rheological properties of the resulting condensates at the mesoscale, enabling a route to systematically probe and rationally engineer biomolecular condensates with programmable mechanics.


Conflict of interest statement

The authors declare no competing interests.

Figures

Fig. 1
Fig. 1. Determination of frequency-dependent viscoelastic moduli of peptide-RNA condensates using passive microrheology with optical tweezers (pMOT).
a A bright-field image showing a polystyrene bead (1 µm) trapped within a [KGKGG]5-rU40 condensate using an optical trap. Scale bar = 10 µm. b A conceptual scheme of the pMOT experiment. The bead is optically trapped within a biomolecular condensate sitting on a microscope glass surface. c A representative 2D trajectory of the bead shown in (a) within the optical trap inside a [KGKGG]5-rU40 condensate. d The trajectory of the trapped bead in the X-direction. e Normalized distribution of displacements along the X- and Y-directions for the trajectory in c and d. f The normalized position autocorrelation function [NPAF, A(t)] as calculated from the trajectory in c for a bead that is optically trapped inside [KGKGG]5-rU40 condensate (green and black) and inside water (blue) as a reference. Solid lines are multi-exponential fits (see Supplementary Note 1). g The average viscoelastic moduli as obtained from normalized position autocorrelation function using equation-1 for [KGKGG]5-rU40 condensates. G’ and G” represent the elastic and viscous modulus, respectively. Solid lines are averages of the moduli of 10-20 condensates. Error bars represent the standard deviation as calculated from the moduli of 10-20 condensates. Inset: frequency-dependent condensate viscosity as determined from the viscous modulus using the relation η(ω)=G(ω)/ω. h The ensemble-averaged mean square displacement (MSD) of 200 nm polystyrene beads within [KGKGG]5-rU40 condensates using video particle tracking (VPT) microrheology in absence of optical traps (see Methods section for further details). i Comparison between the zero-shear viscosity as determined by pMOT (n = 26 measurements over 3 independent samples) and VPT-derived (n = 7 measurements over 3 independent samples) viscosity. Error bars represent the range of the data.
Fig. 2
Fig. 2. Sequence-dependent control over linear viscoelastic (LVE) behavior of peptide-RNA condensates.
a A scheme showing the sticker-spacer architecture of associative peptide and RNA chains. Here, sticker-RNA interactions drive the condensation. b A plot showing the average elastic modulus (G’, black) and the average viscous modulus (G”, red) of [RGRGG]5-rU40 condensates (n = 17 measurements over 3 independent samples). Green lines are fits to experimental data using a single-mode Maxwell fluid model. The crossover frequency is indicated by the black dashed line and is the inverse of terminal relaxation timeτM. Shaded regions represent the dominant elastic regime (light-blue) and the dominant viscous regime (light-green), respectively. Error bars represent one standard deviation (±1 s.d.). c The relative abundance of different amino acids within the inter-RG/RGG spacers of RG/RGG motifs in human RNA-binding proteins represented as bubble charts. Sizes of individual bubbles represent the fraction of inter-RG/RGG spacers that contain the corresponding amino acid (see Methods section). Residues that occurred in more than 10% of the analyzed protein sequences (RG/RGG domains from 407 human RNA-binding protein sequences) are indicated in cyan. Residues marked with red circles are utilized for peptide design for the experimental studies reported here. d The average frequency-dependent viscoelastic moduli of [RGXGG]5-rU40 condensates where X = P/S/R/F/Y. The crossover frequencies are indicated by black dashed lines. Shaded regions represent the dominant elastic regime (light-blue) and the dominant viscous regime (light-green), respectively. Error bars represent ±1 s.d. e The terminal relaxation time τM of [RGXGG]5-rU40 condensates as measured by pMOT (X = P/S/R/F/Y). f The zero-shear viscosity of [RGXGG]5-rU40 condensates as measured by pMOT (X = P/S/R/F/Y). g An LVE state diagram indicating the timescales at which the elastic modulus dominates (blue) and the timescales where the viscous modulus dominates (green) in [RGXGG]5-rU40 condensates (X = P/S/R/F/Y). Error bars represent one standard deviation (±1 s.d.). For dg, the sample size is n = (29,16,17,17,16) measurements over 3 independent samples for X = (P,S,R,F,Y), respectively.
Fig. 3
Fig. 3. Effect of spacer sequence variation on the frequency-dependent viscoelasticity of peptide-RNA condensates.
a Average viscoelastic moduli of [RxRxx]5-rU40 condensates. The crossover frequencies are indicated by black dashed lines. Shaded regions represent the dominant elastic regime (light-blue) and the dominant viscous regime (light-green), respectively. Error bars represent one standard deviation (±1 s.d.). b The frequency-dependent viscosity of [RxRxx]5-rU40 condensates as measured by pMOT. Error bars represent one standard deviation (±1 s.d.). c The zero-shear viscosity of [RxRxx]5-rU40 condensates as measured by pMOT. d The terminal relaxation time τM of [RxRxx]5-rU40 condensates as measured by pMOT. For the data shown in ad: x = P/Q/G/A. For the data in ad, the sample size is n = (18,14,18,17) measurements for x = (P,Q,A,G), respectively.
Fig. 4
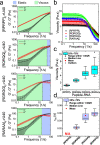
Fig. 4. Peptide-RNA interactions govern the condensate LVE properties.
a A material state diagram showing the elastic (G’) and viscous (G”) moduli at 1 Hz frequency for the various condensates tested in this study. This plot shows a broad range of tunability in condensate viscoelasticity via sequence perturbations. b Bright-field images of [RGRGG]5-rU40 condensates showing phase separation upon cooling. Scale bar is 20 µm. c Temperature-salt state diagram for [RGPGG]5, [RPRPP]5, [RGRGG]5, [RGFGG]5, and [RGYGG]5 mixtures with rU40 RNA. Shaded regions indicate the salt and temperature conditions that allow phase separation. The most stable peptide-RNA condensates are [RGYGG]5-rU40 and the least stable are [RGPGG]5-rU40 condensates. Error bars represent the temperature range between a phase separated sample and a homogeneous (not phase separated) sample. d A scheme summarizing the all-atom simulations of tri-amino acids [GXG] and a tri-nucleotide [rUrUrU] where X was set to either Arg or Pro or Tyr. e All-atom simulation equilibrium snapshots of Pro-rU, Arg-rU, and Tyr-rU interactions. Note the π-π stacking in the case of Tyr-rU pair that leads to stronger interactions with RNA. f Free energy profiles of [GXG]-[rUrUrU] attraction from model peptide-RNA all-atom constant temperature simulations shown in e. X is set to Arg, Pro, or Tyr. The tripeptide that is stickiest to [rUrUrU] is [GYG] while [GPG] has the weakest interaction with the trinucleotide. g Snapshots from the coexistence simulations with coarse grained molecular models of full peptide sequences and rU40 RNA showing the equilibrium configuration of peptide and RNA chains in [RGPGG]5-rU40, [RGRGG]5-rU40, and [RGYGG]5-rU40 mixtures at a temperature of 450 K. The rU units are colored in red. The Pro units are colored in blue. The Arg units are colored in green. The Tyr units are colored in orange. Corresponding density profiles are shown along the z-direction of the box. h Temperature-density phase diagrams for [RGPGG]5-rU40, [RGRGG]5-rU40, and [RGYGG]5-rU40 condensates as extracted from the coexistence simulations in g. At each temperature, the densities of the condensed and dilute phases are shown.
Fig. 5
Fig. 5. Continuous tuning of LVE behavior of peptide-RNA condensates by two orthogonal approaches.
a Polypeptide sequences of the RGnY peptide design with n representing the number of Tyr residues. RG0Y corresponds to [RGRGG]5, RG5Y corresponds to [RGYGG]5 (see Supplementary Table 1). b The zero-shear viscosity of RGnY-rU40 condensates as measured by pMOT. c The terminal relaxation time τM of RGnY-rU40 condensates as measured by pMOT (see Supplementary Fig. 10). d An experimental LVE state diagram indicating the timescales at which the elastic modulus dominates (blue) and the timescales where the viscous modulus dominates (green) in RGnY-rU40 condensates. Error bars represent one standard deviation (±1 s.d.). e A scheme showing the preparation of condensates formed by mixing [RGYGG]5, [RGPGG]5, and rU40 RNA with variable [RGYGG]5-to-[RGPGG]5 ratios. Here, the total peptide concentration is fixed at 5.0 mg/ml and the relative fractions of [RGYGG]5 and [RGPGG]5 are varied. f The zero-shear viscosity of condensates formed by mixtures of [RGYGG]5, [RGPGG]5, and RNA at variable [RGYGG]5-to-[RGPGG]5 ratios. g The terminal relaxation time (τM) of the same condensates as in f. See Supplementary Fig. 12 for the viscoelastic moduli. h An experimental LVE state diagram indicating the timescales at which the elastic modulus dominates (blue) and the timescales where the viscous modulus dominates (green) in [RGYGG]5-[RGPGG]5-rU40 condensates as a function of [RGYGG]5-to-[RGPGG]5 ratio. Error bars represent one standard deviation (±1 s.d.). For bd, the sample size is n = (17,20,10,16) for (RG0Y, RG1Y, RG3Y, RG5Y), respectively. For gh, the sample size is n = (29,14,36,18,18,16) for [RGYGG]5 fractions of (0%,20%,40%,60%,80%,100%), respectively.
Fig. 6
Fig. 6. Effect of RNA sequence and structure on the LVE properties of peptide-RNA condensates.
a A scheme showing the sequence and expected disordered structure of the peptide and dT40. b A Scheme showing the sequence and expected structure of G5T30C5. c Average viscoelastic moduli of condensates formed by [RGPGG]5 and dT40 as measured by pMOT. Error bars represent one standard deviation (±1 s.d.). d Average viscoelastic moduli of condensates formed by [RGPGG]5 and G5T30C5 as measured by pMOT. Error bars represent one standard deviation (±1 s.d.). e Zero-shear viscosity of [RGPGG]5-ssNA condensates for both structured (G5T30C5) and unstructured (dT40) NA as calculated from the data in b and d. f Terminal relaxation time of [RGPGG]5-NA condensates for both structured (G5T30C5) and unstructured (dT40) NA as calculated from the data in b and d. For the data in cf, the sample size is n=(22 and 20) measurements over 3 independent samples for (dT40 and G5T30C5), respectively. g Brightfield image of condensates prepared by mixing [RGPGG]5 and (G4C2)5 NA at 5.0 mg/ml and 2.5 mg/ml concentrations, respectively. Scale bar is 20 µm. h Mean squared displacement (MSD) of 200 nm polystyrene particles within condensates formed by [RGPGG]5 peptide with dT40 (red) and (G4C2)5 (black). This data show that (G4C2)5 forms condensates that have substantially slower network dynamics as compared to the condensates formed by dT40. The orange dashed lines extrapolate the two behaviors (flat MSD at short lag-times and increasing MSD at long lag-times) and the blue line indicates the extrapolated transition point at ~5 s. i A scheme summarizing the relation between the strength of intermolecular interactions and LVE properties of peptide-RNA condensates. Comparison between two idealized systems A (blue) and B (green) is shown with interaction parameter χA > χB. Due to stronger interactions in system A, the difference between the phase separation temperature (blue curve) and the experimental temperature is greater, leading to a deeper quench within the two-phase regime (red double-sided arrows). Additionally, stronger interactions in system A cause higher viscosity η and a slower bond reconfiguration time τ, which retards the network flow.

References

    1. Iserman C, et al. Genomic RNA elements drive phase separation of the SARS-CoV-2 nucleocapsid. Mol. Cell. 2020;80:1078–1091. e1076. - PMC - PubMed
    1. Azaldegui CA, Vecchiarelli AG, Biteen JS. The emergence of phase separation as an organizing principle in bacteria. Biophys. J. 2021;120:1123–1138. - PMC - PubMed
    1. Ladouceur A-M, et al. Clusters of bacterial RNA polymerase are biomolecular condensates that assemble through liquid–liquid phase separation. Proc. Natl Acad. Sci. USA. 2020;117:18540–18549. - PMC - PubMed
    1. Franzmann TM, et al. Phase separation of a yeast prion protein promotes cellular fitness. Science. 2018;359:eaao5654. - PubMed
    1. Laflamme G, Mekhail K. Biomolecular condensates as arbiters of biochemical reactions inside the nucleus. Commun. Biol. 2020;3:1–8. - PMC - PubMed

Publication types