

The influence of stimulus and behavioral histories on predictive control of smooth pursuit eye movements
- PMID: 34785718
- PMCID: PMC8595731
- DOI: 10.1038/s41598-021-01733-1
The influence of stimulus and behavioral histories on predictive control of smooth pursuit eye movements
Abstract
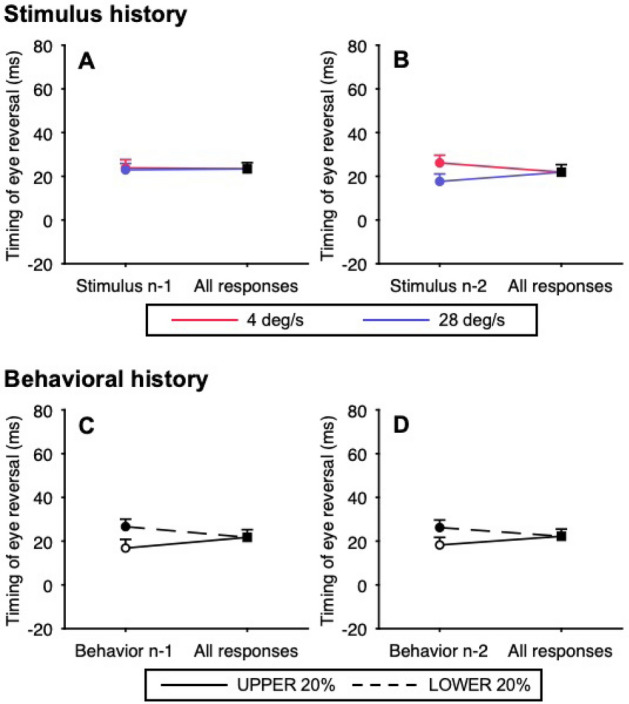
The smooth pursuit system has the ability to perform predictive feedforward control of eye movements. This study attempted to examine how stimulus and behavioral histories of past trials affect the control of predictive pursuit of target motion with randomized velocities. We used sequential ramp stimuli where the rightward velocity was fixed at 16 deg/s while the leftward velocity was either fixed (predictable) at one of seven velocities (4, 8, 12, 16, 20, 24, or 28 deg/s) or randomized (unpredictable). As a result, predictive pursuit responses were observed not only in the predictable condition but also in the unpredictable condition. Linear mixed-effects (LME) models showed that both stimulus and behavioral histories of the previous two or three trials influenced the predictive pursuit responses in the unpredictable condition. Intriguingly, the goodness of fit of the LME model was improved when both historical effects were fitted simultaneously rather than when each type of historical data was fitted alone. Our results suggest that predictive pursuit systems allow us to track randomized target motion using weighted averaging of the information of target velocity (stimulus) and motor output (behavior) in past time sequences.
© 2021. The Author(s).
Conflict of interest statement
The authors declare no competing interests.
Figures


Similar articles
-
Differential effects of blinks on horizontal saccade and smooth pursuit initiation in humans.Exp Brain Res. 2004 Jun;156(3):314-24. doi: 10.1007/s00221-003-1791-z. Epub 2004 Feb 14. Exp Brain Res. 2004. PMID: 14968272
-
Prediction and a stationary, structured visual background influence the dynamics of the smooth-pursuit offset in humans.Exp Brain Res. 1998 Dec;123(4):361-7. doi: 10.1007/s002210050581. Exp Brain Res. 1998. PMID: 9870596
-
Eye movement and visual motion perception in schizophrenia I: Apparent motion evoked smooth pursuit eye movement reveals a hidden dysfunction in smooth pursuit eye movement in schizophrenia.Exp Brain Res. 2007 Sep;182(3):399-413. doi: 10.1007/s00221-007-1000-6. Epub 2007 Jun 19. Exp Brain Res. 2007. PMID: 17576546
-
The neuronal basis of on-line visual control in smooth pursuit eye movements.Vision Res. 2015 May;110(Pt B):257-64. doi: 10.1016/j.visres.2014.06.008. Epub 2014 Jul 1. Vision Res. 2015. PMID: 24995378 Free PMC article. Review.
-
Predictive Smooth Pursuit Eye Movements.Annu Rev Vis Sci. 2019 Sep 15;5:223-246. doi: 10.1146/annurev-vision-091718-014901. Epub 2019 Jul 5. Annu Rev Vis Sci. 2019. PMID: 31283450 Review.
Cited by
-
Bayesian approaches to smooth pursuit of random dot kinematograms: effects of varying RDK noise and the predictability of RDK direction.J Neurophysiol. 2024 Feb 1;131(2):394-416. doi: 10.1152/jn.00116.2023. Epub 2023 Dec 27. J Neurophysiol. 2024. PMID: 38149327 Free PMC article.
-
Reduced latency in manual interception with anticipatory smooth eye movements.iScience. 2025 Jan 20;28(2):111849. doi: 10.1016/j.isci.2025.111849. eCollection 2025 Feb 21. iScience. 2025. PMID: 39967873 Free PMC article.
References
-
- Carl JR, Gellman RS. Human smooth pursuit: Stimulus-dependent responses. J. Neurophysiol. 1987;57:1446–1463. - PubMed
-
- Leigh RJ, Zee DS. The Neurology of Eye Movements. Oxford University Press; 2015.
-
- Jacobs RJ. Visual resolution and contour interaction in the fovea and periphery. Vision Res. 1979;19:1187–1195. - PubMed
-
- Kowler E, Rubinstein JF, Santos EM, Wang J. Predictive smooth pursuit eye movements. Annu. Rev. Vis. Sci. 2019;5:223–246. - PubMed
-
- Fiehler K, Brenner E, Spering M. Prediction in goal-directed action. J. Vis. 2019;19:2. - PubMed
Publication types
MeSH terms
Grants and funding
LinkOut - more resources
Full Text Sources
Research Materials
Miscellaneous
