. 2021 Nov 16;4(1):1295.
doi: 10.1038/s42003-021-02820-9.

Modulation of AggR levels reveals features of virulence regulation in enteroaggregative E. coli

Affiliations

Modulation of AggR levels reveals features of virulence regulation in enteroaggregative E. coli

Alejandro Prieto et al. Commun Biol. .

Abstract

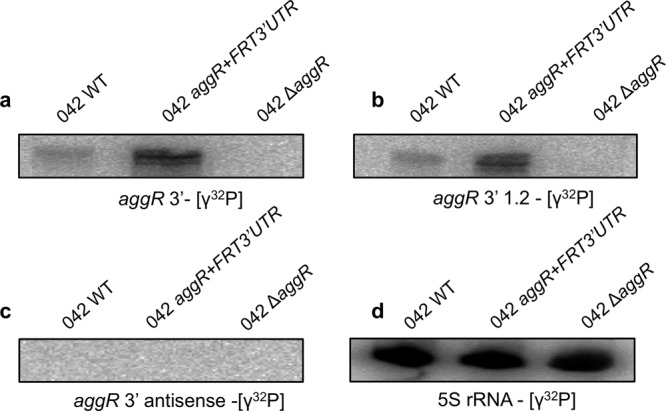
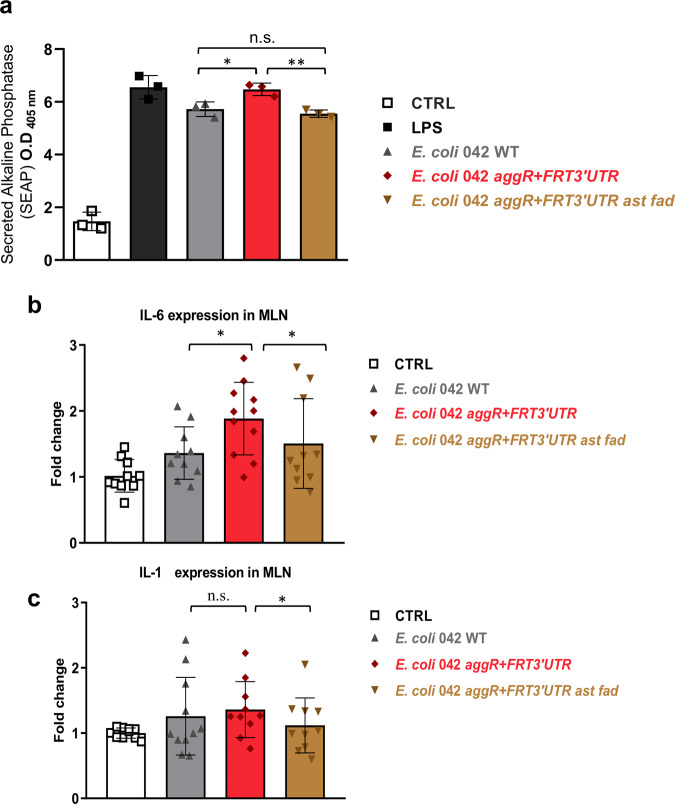
Enteroaggregative Escherichia coli (EAEC) strains are one of the diarrheagenic pathotypes. EAEC strains harbor a virulence plasmid (pAA2) that encodes, among other virulence determinants, the aggR gene. The expression of the AggR protein leads to the expression of several virulence determinants in both plasmids and chromosomes. In this work, we describe a novel mechanism that influences AggR expression. Because of the absence of a Rho-independent terminator in the 3'UTR, aggR transcripts extend far beyond the aggR ORF. These transcripts are prone to PNPase-mediated degradation. Structural alterations in the 3'UTR result in increased aggR transcript stability, leading to increased AggR levels. We therefore investigated the effect of increased AggR levels on EAEC virulence. Upon finding the previously described AggR-dependent virulence factors, we detected novel AggR-regulated genes that may play relevant roles in EAEC virulence. Mutants exhibiting high AggR levels because of structural alterations in the aggR 3'UTR show increased mobility and increased pAA2 conjugation frequency. Furthermore, among the genes exhibiting increased fold change values, we could identify those of metabolic pathways that promote increased degradation of arginine, fatty acids and gamma-aminobutyric acid (GABA), respectively. In this paper, we discuss how the AggR-dependent increase in specific metabolic pathways activity may contribute to EAEC virulence.


Conflict of interest statement

The authors declare no competing interests.

Figures

Fig. 1
Fig. 1. Expression of transcriptional aggR::lacZ fusions and quantification of cellular aggregation of E. coli strain 042 and derivatives.
a The aggR::lacZ and aggR3´UTR::lacZ strains were grown in LB medium or DMEM at 37 °C. Samples were collected at the onset of the stationary phase (OD600 2.0). The aggR::lacZ construct contains the lacZ gene in the coding region of the aggR gene, and the aggR3UTR::lacZ construct contains the lacZ gene reporter fusion located after the stop codon of the aggR gene. The results show the means and the standard deviation of three independent experiments. Significance was analyzed by unpaired two–sided Student’s t-test. Significance is indicated as **p < 0.01. b Quantification of cellular aggregates as indicated by a decrease in the OD600. E. coli 042 wt, pAA2-, ΔaggR and aggR + FRT3UTR cell aggregates at 25 °C and 37 °C in LB medium. c Picture of a representative experiment showing the hypercellular aggregation of the aggR + FRT3UTR strain at 37 °C (black arrow).
Fig. 2
Fig. 2. The AafA and Aap proteins are overexpressed in the aggR + FRT3UTR strain.
SDS-PAGE analysis of (a) whole cell extracts, (b) cellular fractions, and (c) the cell-free secreted proteins of the E. coli 042 wt, pAA2-, ΔaggR and aggR + FRT3UTR strains. Black arrows in (a) and (b) point to the overexpressed AafA protein in the aggR + FRT3UTR genetic background. Blue asterisk in (c) correspond to the Pic protein, and red asterisk highlight the Pet protein, respectively. The black arrow in (c) points to the overexpressed dispersin protein in the aggR + FRT3UTR genetic background.
Fig. 3
Fig. 3. Northern blot analysis of the aggR transcript.
RNA was extracted from strains E. coli 042 wt and aggR + FRT3UTR, with the ΔaggR strain used as a control for the specificity of the probes. a and b correspond to the levels of the aggR transcript detected by [γ32P] probes that were complementary to the sense strands, while (c) corresponds to the levels of the aggR transcript detected using a [γ32P] probe complementary to the antisense strand of the aggR gene. d 5 S rRNA was used as the loading control. The experiment was repeated three times. A representative experiment is presented.
Fig. 4
Fig. 4. Detailed map of the aggR genetic region and in silico prediction of Rho-dependent and Rho-independent terminators that map downstream of the aggR gene coding sequences.
a Details of the genetic region to which the aggR gene maps. Genetic determinants flanking the aggR gene of the pAA2 plasmid in strain 042. Insertion elements are indicated in black and yellow. Arrows indicate the direction of transcription. To simplify the interpretation, the reverse complement was used to show the aggR gene in the sense strand. b Alignment of the regions that include the aggR gene and downstream sequences in the pAA plasmids of strains 042, C700-09, 55989 and O104:H4, respectively. c Detailed map of the aggR gene and 3′UTR sequences in plasmid pAA2. Black letters correspond to the 3′ end of the promoter sequence of the aggR gene. The 5′UTR (light blue letters) and 3′UTRs (dark blue letters) of aggR are shown, as are the sequences corresponding to the IS1A element located downstream of the gene (orange letters, IRL elements; yellow letters, IS1A coding region; and brown letters, IRR element). The -10 element of the aggR promoter as well as the aggR transcription start site are also shown. The black arrow corresponds to the start of the promoter region, and the red arrow corresponds to the aggR transcriptional start site. d Diagram showing the in silico prediction of Rho-dependent and Rho-independent terminators that map downstream of the aggR gene coding sequences. Rho-independent (yellow) and Rho-dependent (rut, in orange) terminators (in silico predicted, see material and methods) located downstream of the aggR coding sequences in the pAA plasmids of E. coli strains 042, C700-09, 55989 and O104:H4 are shown.
Fig. 5
Fig. 5. Alteration of the 3′UTR gene of E. coli 55989 enteroaggregative strain shows the same phenotype as the E. coli 042 strain.
a Growth curves of E. coli strains 55989 wt and aggR + FRT3UTR in LB medium. b SDS-PAGE analysis of whole cell extracts (left) and the cell-free secreted proteins (right) of the E. coli 55989 wt and aggR + FRT3UTR strains. White arrow points to the overexpressed Agg3A protein, while black arrow points to the Aap protein overexpressed in the secretome of the strain E. coli 55989 aggR + FRT3UTR. c Quantification of cellular aggregation as indicated by a decrease in the OD600. d Picture of a representative experiment showing the hypercellular aggregation of the 55989 aggR + FRT3UTR strain at 37 °C (black arrow).
Fig. 6
Fig. 6. Northern blot analysis of the 042 aggR transcript in different genetic backgrounds harboring different deletions in the 3′ sequences of the aggR gene.
a mRNA levels of the aggR gene detected by using a [γ32P] probe complementary to the end of the aggR gene sense strand of different strains. b The 5 S rRNA used as a loading control. The experiment was repeated three times, and a representative experiment is shown.
Fig. 7
Fig. 7. Walking RT-PCR performed to analyze the length of the aggR transcript.
a Details of the oligonucleotides used in the walking RT-PCR experiment and the lengths of the corresponding predicted amplicons. bg Amplification products corresponding to the aggR transcript detected with the different sets of primers used. The experiment was repeated three times, and a representative experiment is shown.
Fig. 8
Fig. 8. Northern blot analysis of the aggR transcript of E. coli strains 042 wt, aggR + FRT3UTR, ΔaggR and the 042 derivatives lacking either RNaseE or PNP ribonuclease function.
a mRNA levels of the aggR gene detected by using a [γ32P] probe complementary to the end of the aggR gene sense strand. b 5 S rRNA was used as a loading control. c Picture of a representative experiment showing the hyper aggregation of the aggR + FRT3UTR and the Δpnp strains at 37 °C. The experiment was repeated three times, and a representative experiment is shown.
Fig. 9
Fig. 9. Motility and conjugation frequencies quantification of the E. coli 042 and derivatives.
a The aggR + FRT3UTR strain is hypermotile. Motility assays of E. coli 042 wt, pAA2-, ΔaggR and aggR + FRT3UTR were performed at 37 °C. Representative experiment showing the motility halos of the different strains analyzed after incubation on LB 0.3% agar plates for 16 h at 37 °C. b Mean diameter of the motility halo in the different strains corresponding to three independent biological replicates. Significance was analyzed by unpaired two–sided Student’s t-test. Significance is indicated as *p < 0.05 and **p < 0.01; n.s: not significant. c Conjugation frequencies of the pAA2 plasmid in the 042 aap-FLAG and 042 aggR + FRT3UTR donor strains at 37 °C and 25 °C. The 042 aap-FLAG strain was used instead of the wt donor strain, as the Kmr determinant associated with the aap-FLAG construct presumably does not influence pAA2 plasmid conjugation. Conjugation frequencies correspond to a mean of three independent experiments. Significance is indicated as *p < 0.05 and **p < 0.01.
Fig. 10
Fig. 10. In vitro and in vivo quantification of strain 042 aggR + FRT3UTR virulence.
a TLR4 mediated NF-κB induction in HEK-BlueTM hTLR4 cells upon infection with strains 042 wt, 042 aggR + FRT3UTR and 042 aggR + FRT3UTR ast fad. Phosphatase alkaline activity was used to measure TLR4-mediated NF-κB induction. CTRL, negative control (culture medium added). LPS, positive control (lipopolysaccharide added). Data are expressed as means values ± SD. Significance is indicated as *p < 0.05 and **p < 0.01; n.s: not significant. Relative expression of Il-6 (b) and Il-1β (c) in mesenteric lymph node (MLN) leukocytes of mice infected with the 042 wt strain and aggR + FRT3UTR and aggR + FRT3UTR ast fad mutants. Mice were intragastrical administered with PBS (control group) and strains 042 wt, aggR + FRT3UTR and aggR + FRT3UTR ast fad. The results are expressed as the means ± SEM (n = 10 mice per group). Significance is indicated as *p < 0.05; n.s: not significant.

References

    1. Kaper JB, Nataro JP, Mobley HLT. Pathogenic Escherichia coli. Nat. Rev. Microbiol. 2004;2:123–140. - PubMed
    1. Bhan MK, et al. Enteroaggregative Escherichia coli Associated with Persistent Diarrhea in a Cohort of Rural Children in India. J. Infect. Dis. 1989;159:1061–1064. - PubMed
    1. Fang GD, Lima AAM, Martins CV, Nataro JP, Guerrant RL. Etiology and epidemiology of persistent diarrhea in northeastern Brazil: a hospital-based, prospective, case-control study. J. Pediatr. Gastroenterol. Nutr. 1995;21:137–144. - PubMed
    1. Okeke IN, Lamikanra A, Steinrück H, Kaper JB. Characterization of Escherichia coli strains from cases of childhood diarrhea in provincial southwestern Nigeria. J. Clin. Microbiol. 2000;38:7–12. - PMC - PubMed
    1. França, F. L. S. et al. Genotypic and Phenotypic Characterisation of Enteroaggregative Escherichia coli from Children in Rio de Janeiro, Brazil. PLoS One8, e69971 (2013). - PMC - PubMed

Publication types

MeSH terms