

Endoplasmic reticulum stress promotes sorafenib resistance via miR-188-5p/hnRNPA2B1-mediated upregulation of PKM2 in hepatocellular carcinoma
- PMID: 34786210
- PMCID: PMC8569435
- DOI: 10.1016/j.omtn.2021.09.014
Endoplasmic reticulum stress promotes sorafenib resistance via miR-188-5p/hnRNPA2B1-mediated upregulation of PKM2 in hepatocellular carcinoma
Abstract
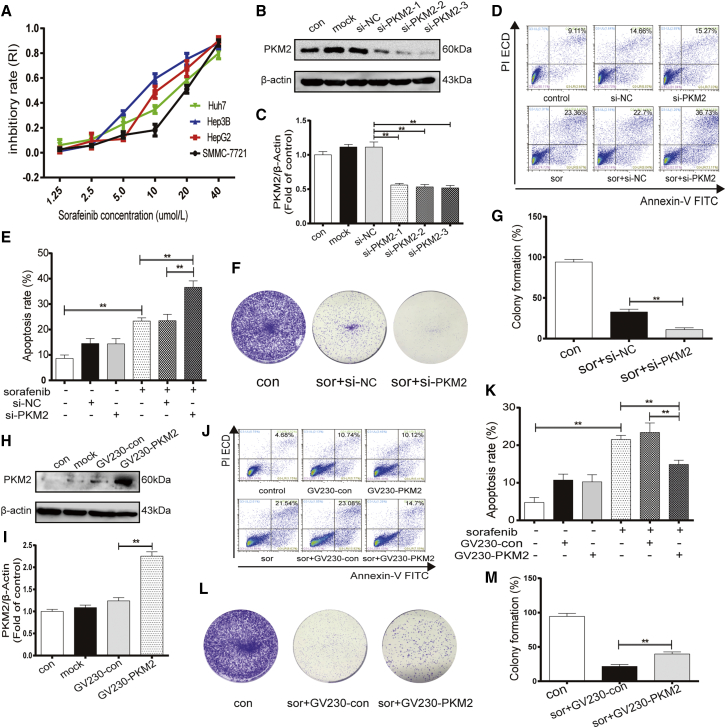
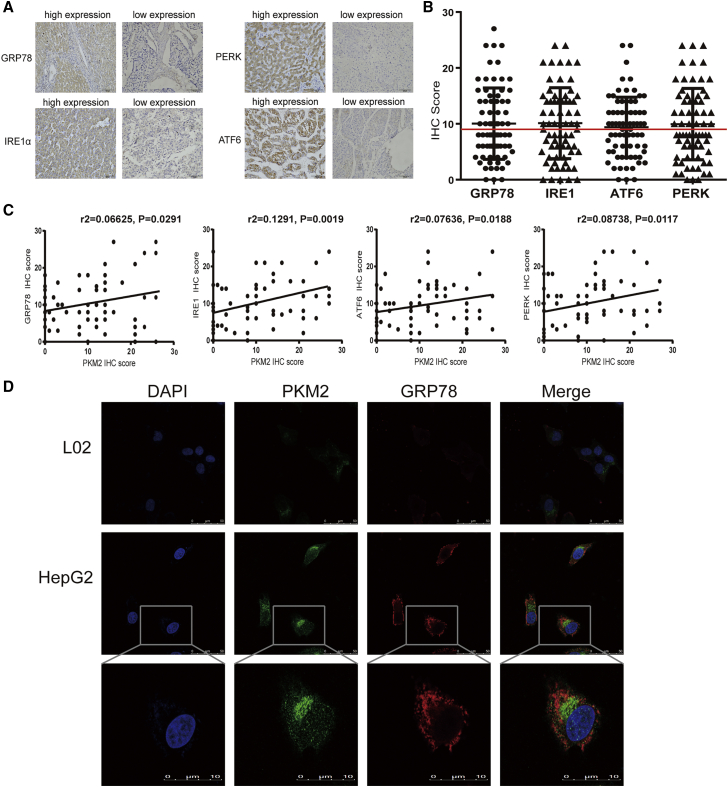
Emerging evidence has shown that endoplasmic reticulum (ER) stress promotes sorafenib resistance in hepatocellular carcinoma (HCC). However, the underlying mechanisms are poorly understood. The purpose of this study was to explore the mechanism by which ER stress promotes sorafenib resistance in HCC. We found that pyruvate kinase isoform M2 (PKM2) was highly expressed in human HCC tissues and co-related with worse clinicopathologic features and overall survival. Activation of ER stress positively correlated with PKM2 expression both in HCC tissue samples and tunicamycin (TM)-induced HCC cell lines. PKM2 knockdown increased sorafenib-induced apoptosis and decreased the ability of colony formation, while upregulation of PKM2 reverses this phenomenon. Furthermore, high-throughput sequencing identified that activation of ER stress significantly downregulated the expression of miR-188-5p in HCC cells. According to bioinformatics analysis and dual-luciferase assays, we further confirmed that hnRNPA2B1 is the target gene of miR-188-5p. Downregulating the expression of hnRNPA2B1 with siRNA could decrease the expression of PKM2 and enhance sorafenib-induced apoptosis in HepG2 cells. Our study demonstrated that ER stress could promote sorafenib resistance through upregulating PKM2 via miR-188-5p/hnRNPA2B1. Therefore, targeting the miR-188-5p/hnRNPA2B1/PKM2 pathway and ER stress may prove instrumental in overcoming sorafenib resistance in HCC treatment.
Keywords: PKM2; endoplasmic reticulum stress; hepatocellular carcinoma; hnRNPA2B1; miR-188-5p; sorafenib.
© 2021 The Author(s).
Conflict of interest statement
The authors declare no competing interests.
Figures


Similar articles
-
Long noncoding RNA SNHG16 induces sorafenib resistance in hepatocellular carcinoma cells through sponging miR-140-5p.Onco Targets Ther. 2019 Jan 4;12:415-422. doi: 10.2147/OTT.S175176. eCollection 2019. Onco Targets Ther. 2019. PMID: 30655679 Free PMC article.
-
Melatonin Increases the Sensitivity of Hepatocellular Carcinoma to Sorafenib through the PERK-ATF4-Beclin1 Pathway.Int J Biol Sci. 2019 Jul 21;15(9):1905-1920. doi: 10.7150/ijbs.32550. eCollection 2019. Int J Biol Sci. 2019. PMID: 31523192 Free PMC article.
-
MiR-374b re-sensitizes hepatocellular carcinoma cells to sorafenib therapy by antagonizing PKM2-mediated glycolysis pathway.Am J Cancer Res. 2019 Apr 1;9(4):765-778. eCollection 2019. Am J Cancer Res. 2019. PMID: 31106002 Free PMC article.
-
LncRNA NEAT1 modulates sorafenib resistance in hepatocellular carcinoma through regulating the miR-149-5p/AKT1 axis.Saudi J Gastroenterol. 2020 May 26;26(4):194-203. doi: 10.4103/sjg.SJG_4_20. Online ahead of print. Saudi J Gastroenterol. 2020. PMID: 32461380 Free PMC article.
-
CCL23 in Balancing the Act of Endoplasmic Reticulum Stress and Antitumor Immunity in Hepatocellular Carcinoma.Front Oncol. 2021 Oct 4;11:727583. doi: 10.3389/fonc.2021.727583. eCollection 2021. Front Oncol. 2021. PMID: 34671553 Free PMC article. Review.
Cited by
-
Comprehensive analysis reveals TSEN54 as a robust prognosis biomarker and promising immune-related therapeutic target for hepatocellular carcinoma.Aging (Albany NY). 2023 Apr 8;15(7):2734-2771. doi: 10.18632/aging.204645. Epub 2023 Apr 8. Aging (Albany NY). 2023. PMID: 37059591 Free PMC article.
-
Warburg effect and lactylation in cancer: mechanisms for chemoresistance.Mol Med. 2025 Apr 22;31(1):146. doi: 10.1186/s10020-025-01205-6. Mol Med. 2025. PMID: 40264038 Free PMC article. Review.
-
Endoplasmic reticulum stress-related super enhancer promotes epithelial-mesenchymal transformation in hepatocellular carcinoma through CREB5 mediated activation of TNC.Cell Death Dis. 2025 Feb 6;16(1):73. doi: 10.1038/s41419-025-07356-y. Cell Death Dis. 2025. PMID: 39915455 Free PMC article.
-
Ginsenoside Rk1 inhibits HeLa cell proliferation through an endoplasmic reticulum signaling pathway.J Ginseng Res. 2023 Sep;47(5):645-653. doi: 10.1016/j.jgr.2023.04.004. Epub 2023 Apr 14. J Ginseng Res. 2023. PMID: 37720575 Free PMC article.
-
Association between glycolysis markers and prognosis of liver cancer: a systematic review and meta-analysis.World J Surg Oncol. 2023 Dec 20;21(1):390. doi: 10.1186/s12957-023-03275-4. World J Surg Oncol. 2023. PMID: 38114977 Free PMC article.
References
-
- Teng Y.X., Li M.J., Xiang B.D., Zhong J.H. Tenofovir may be superior to entecavir for preventing hepatocellular carcinoma and mortality in individuals chronically infected with HBV: a meta-analysis. Gut. 2020;69:1900–1902. - PubMed
-
- Raoul J.L., Edeline J. Systemic treatment of hepatocellular carcinoma: standard of care in China and elsewhere. Lancet Oncol. 2020;21:479–481. - PubMed
-
- Niu L., Liu L., Yang S., Ren J., Lai P.B.S., Chen G.G. New insights into sorafenib resistance in hepatocellular carcinoma: responsible mechanisms and promising strategies. Biochim. Biophys. Acta Rev. Cancer. 2017;1868:564–570. - PubMed
LinkOut - more resources
Full Text Sources
Miscellaneous
