

Impact of the COVID-19 Pandemic on the U.S. Electricity Demand and Supply: An Early View From Data
- PMID: 34786283
- PMCID: PMC8545301
- DOI: 10.1109/ACCESS.2020.3016912
Impact of the COVID-19 Pandemic on the U.S. Electricity Demand and Supply: An Early View From Data
Abstract
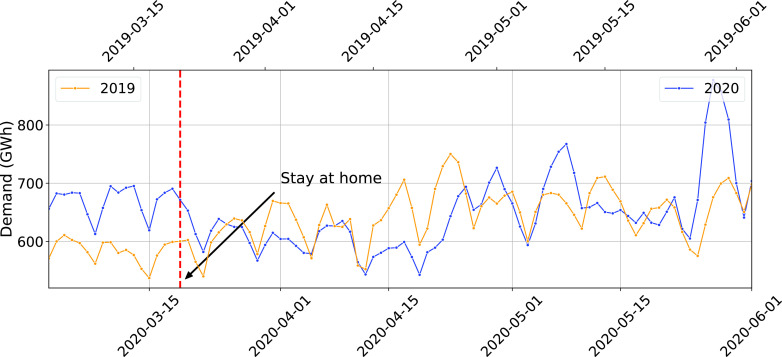
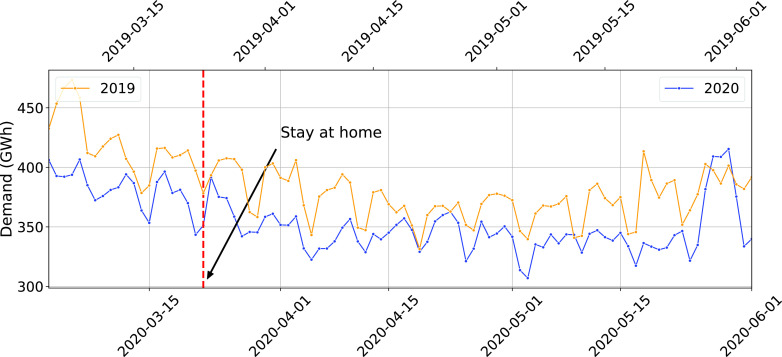
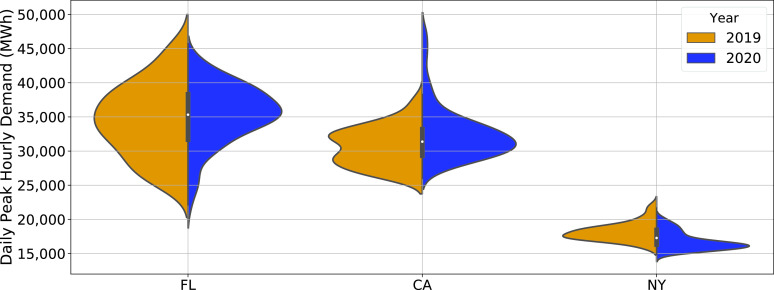
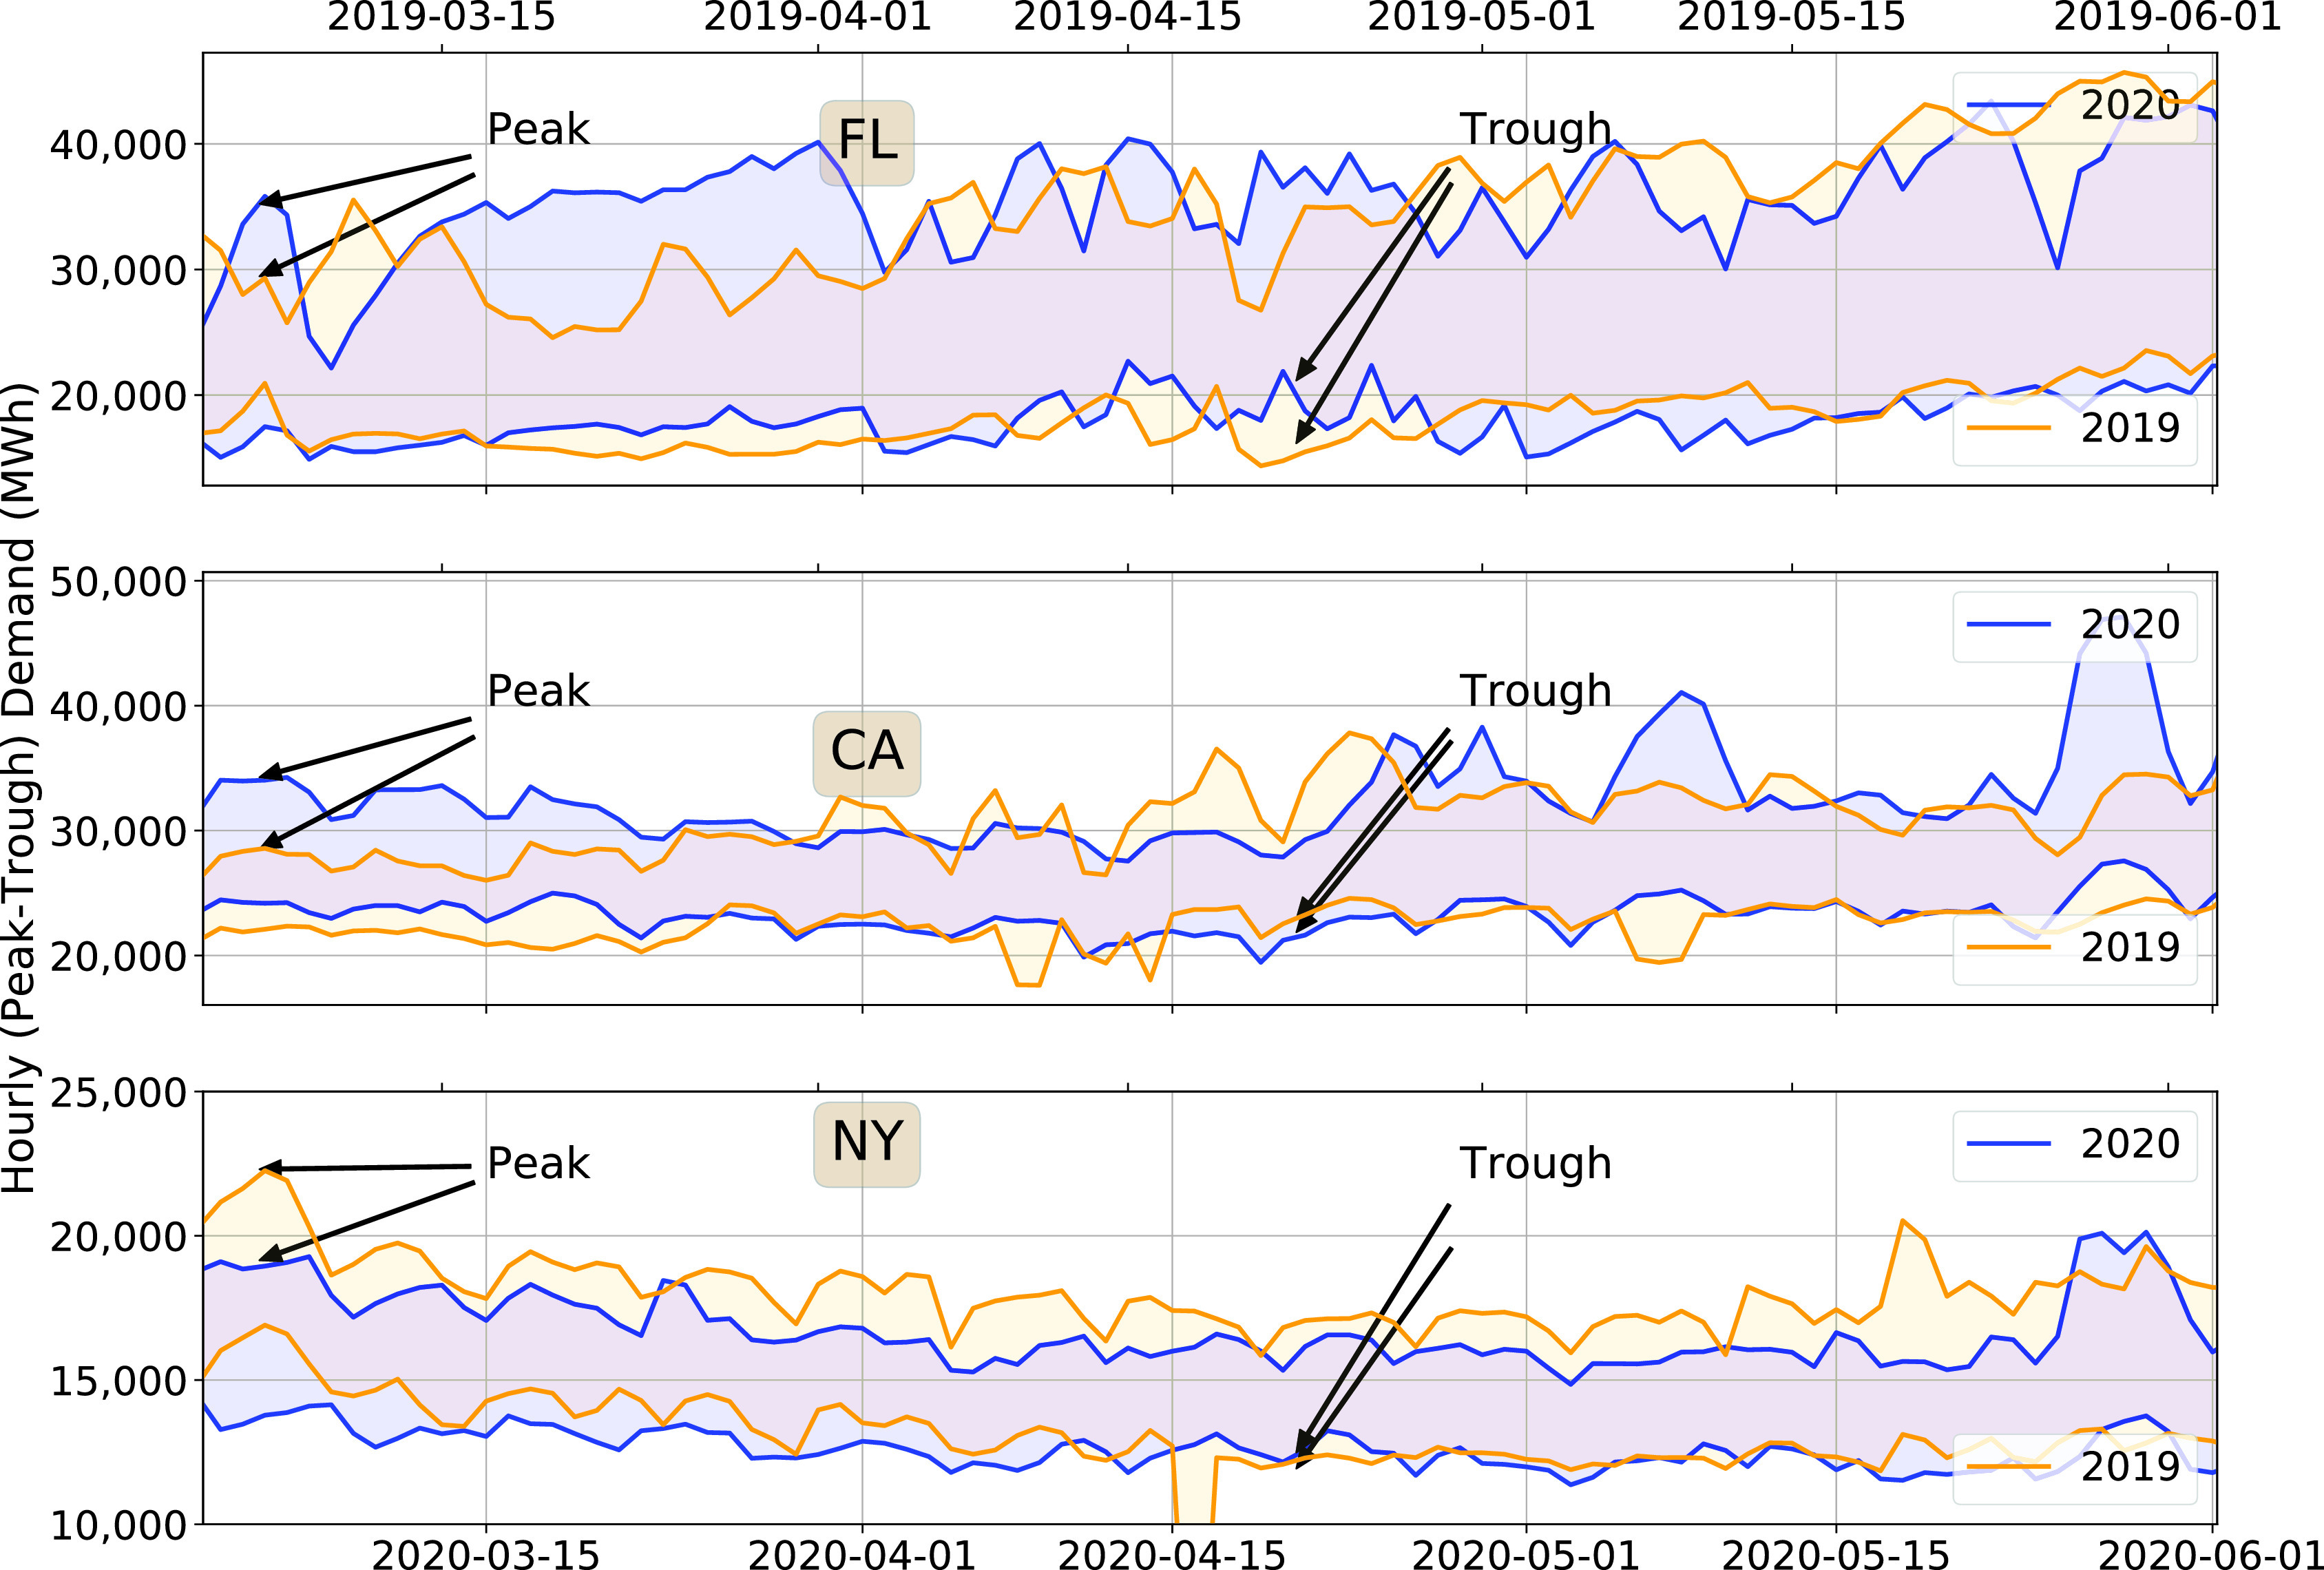
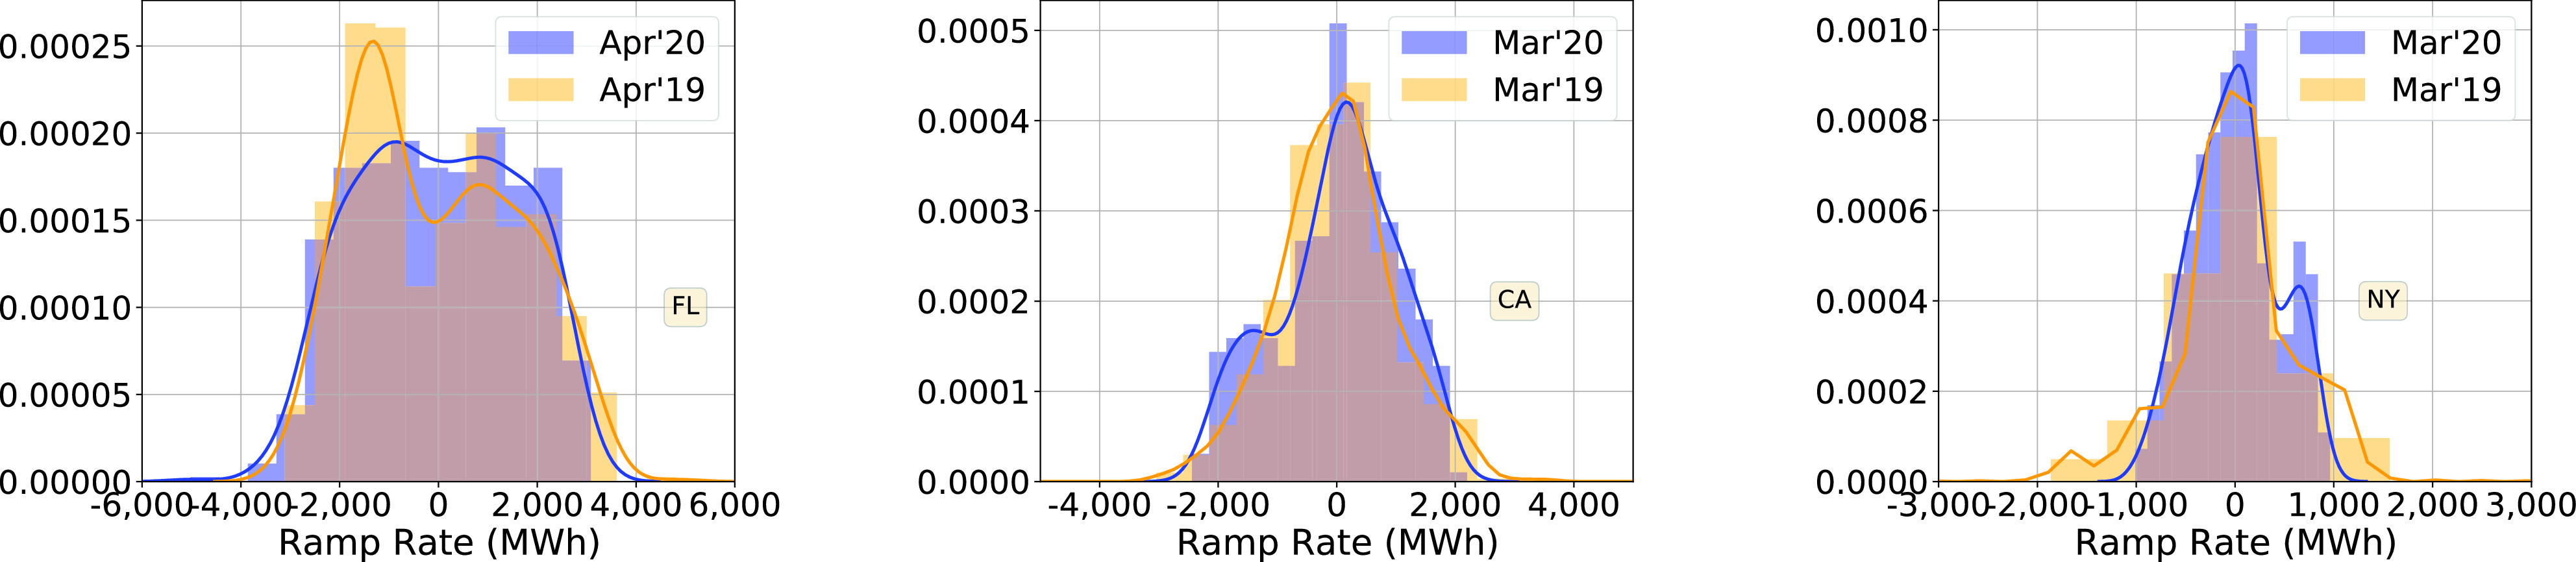
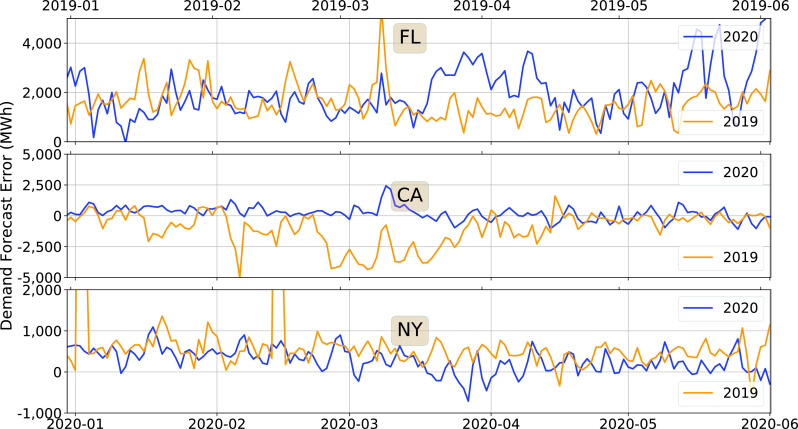
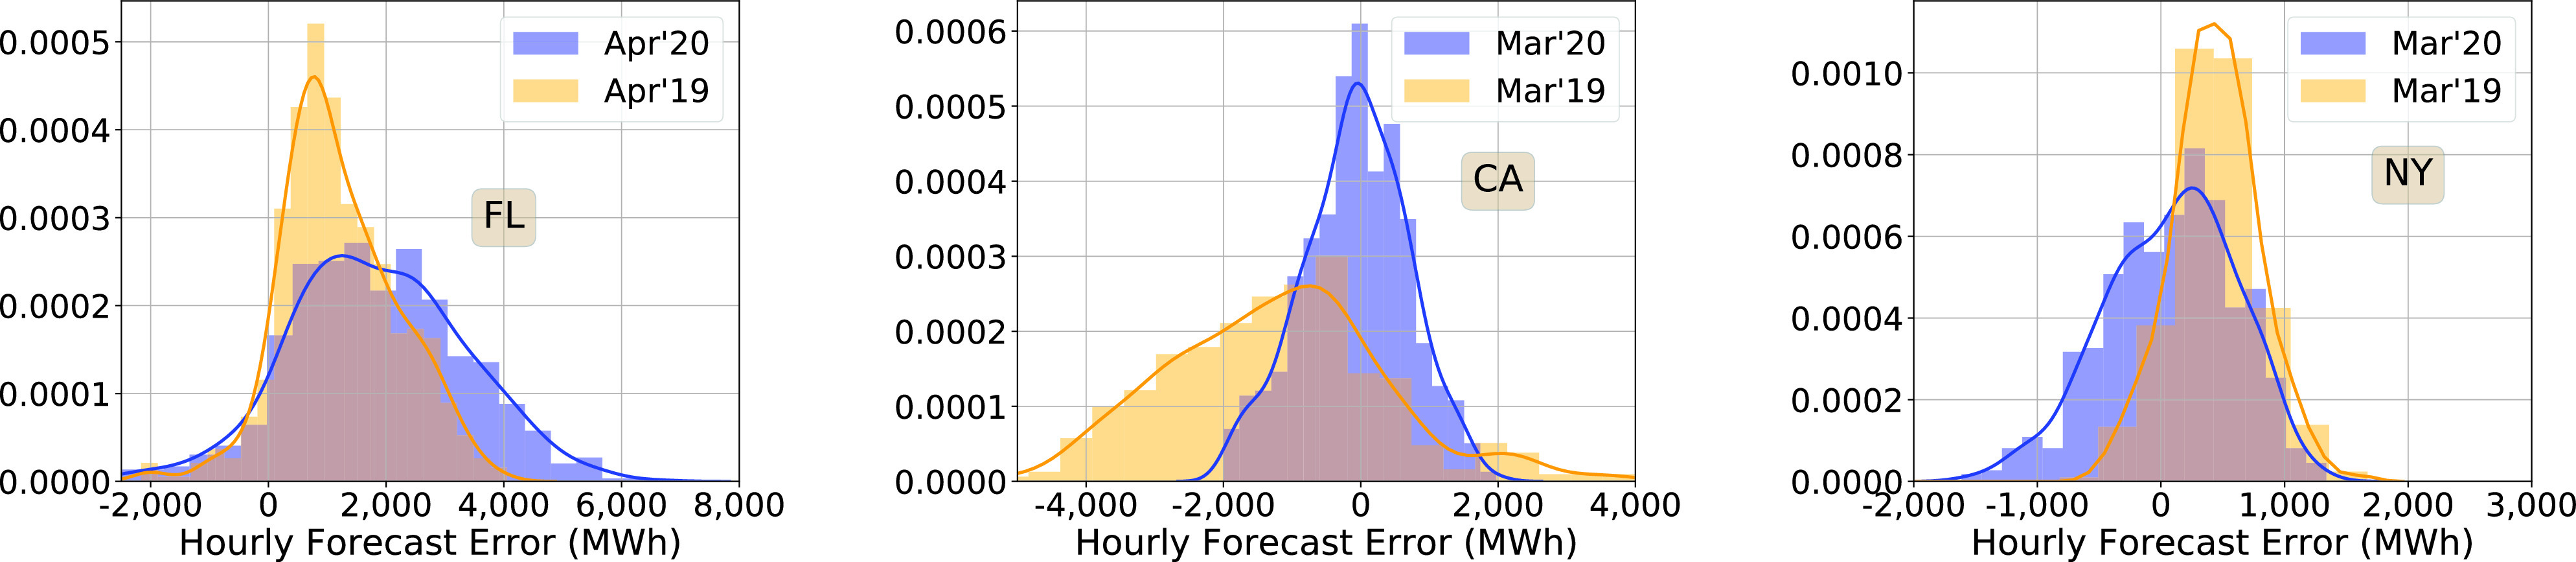
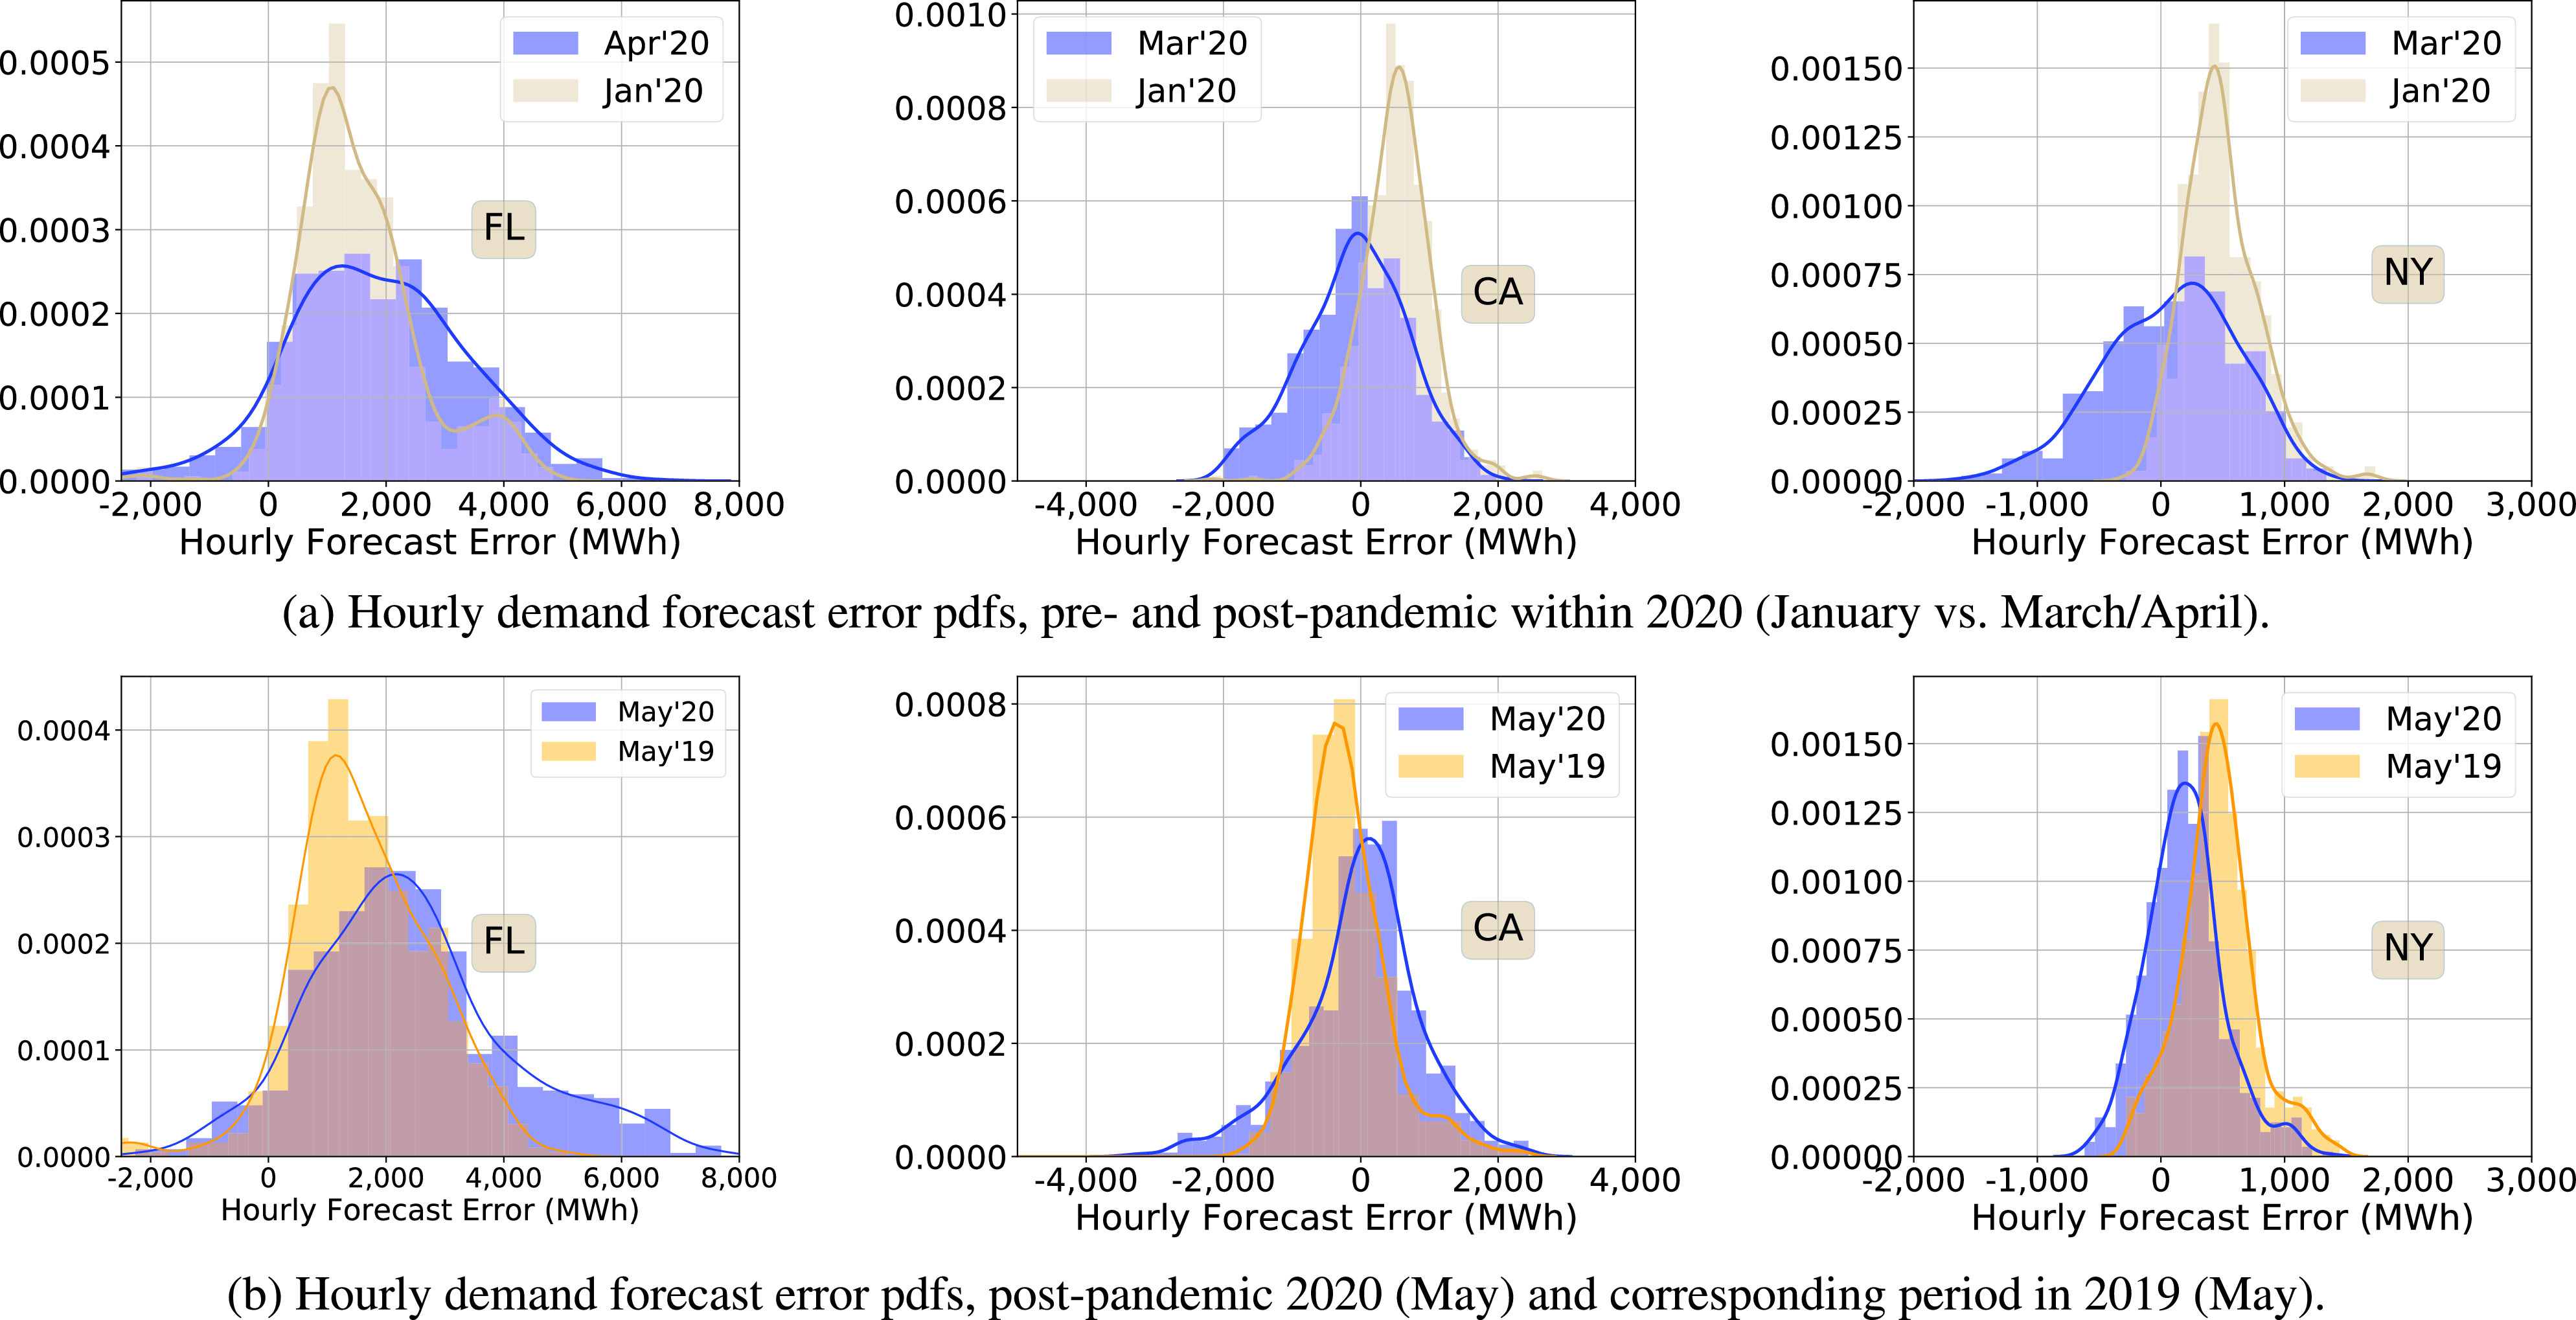
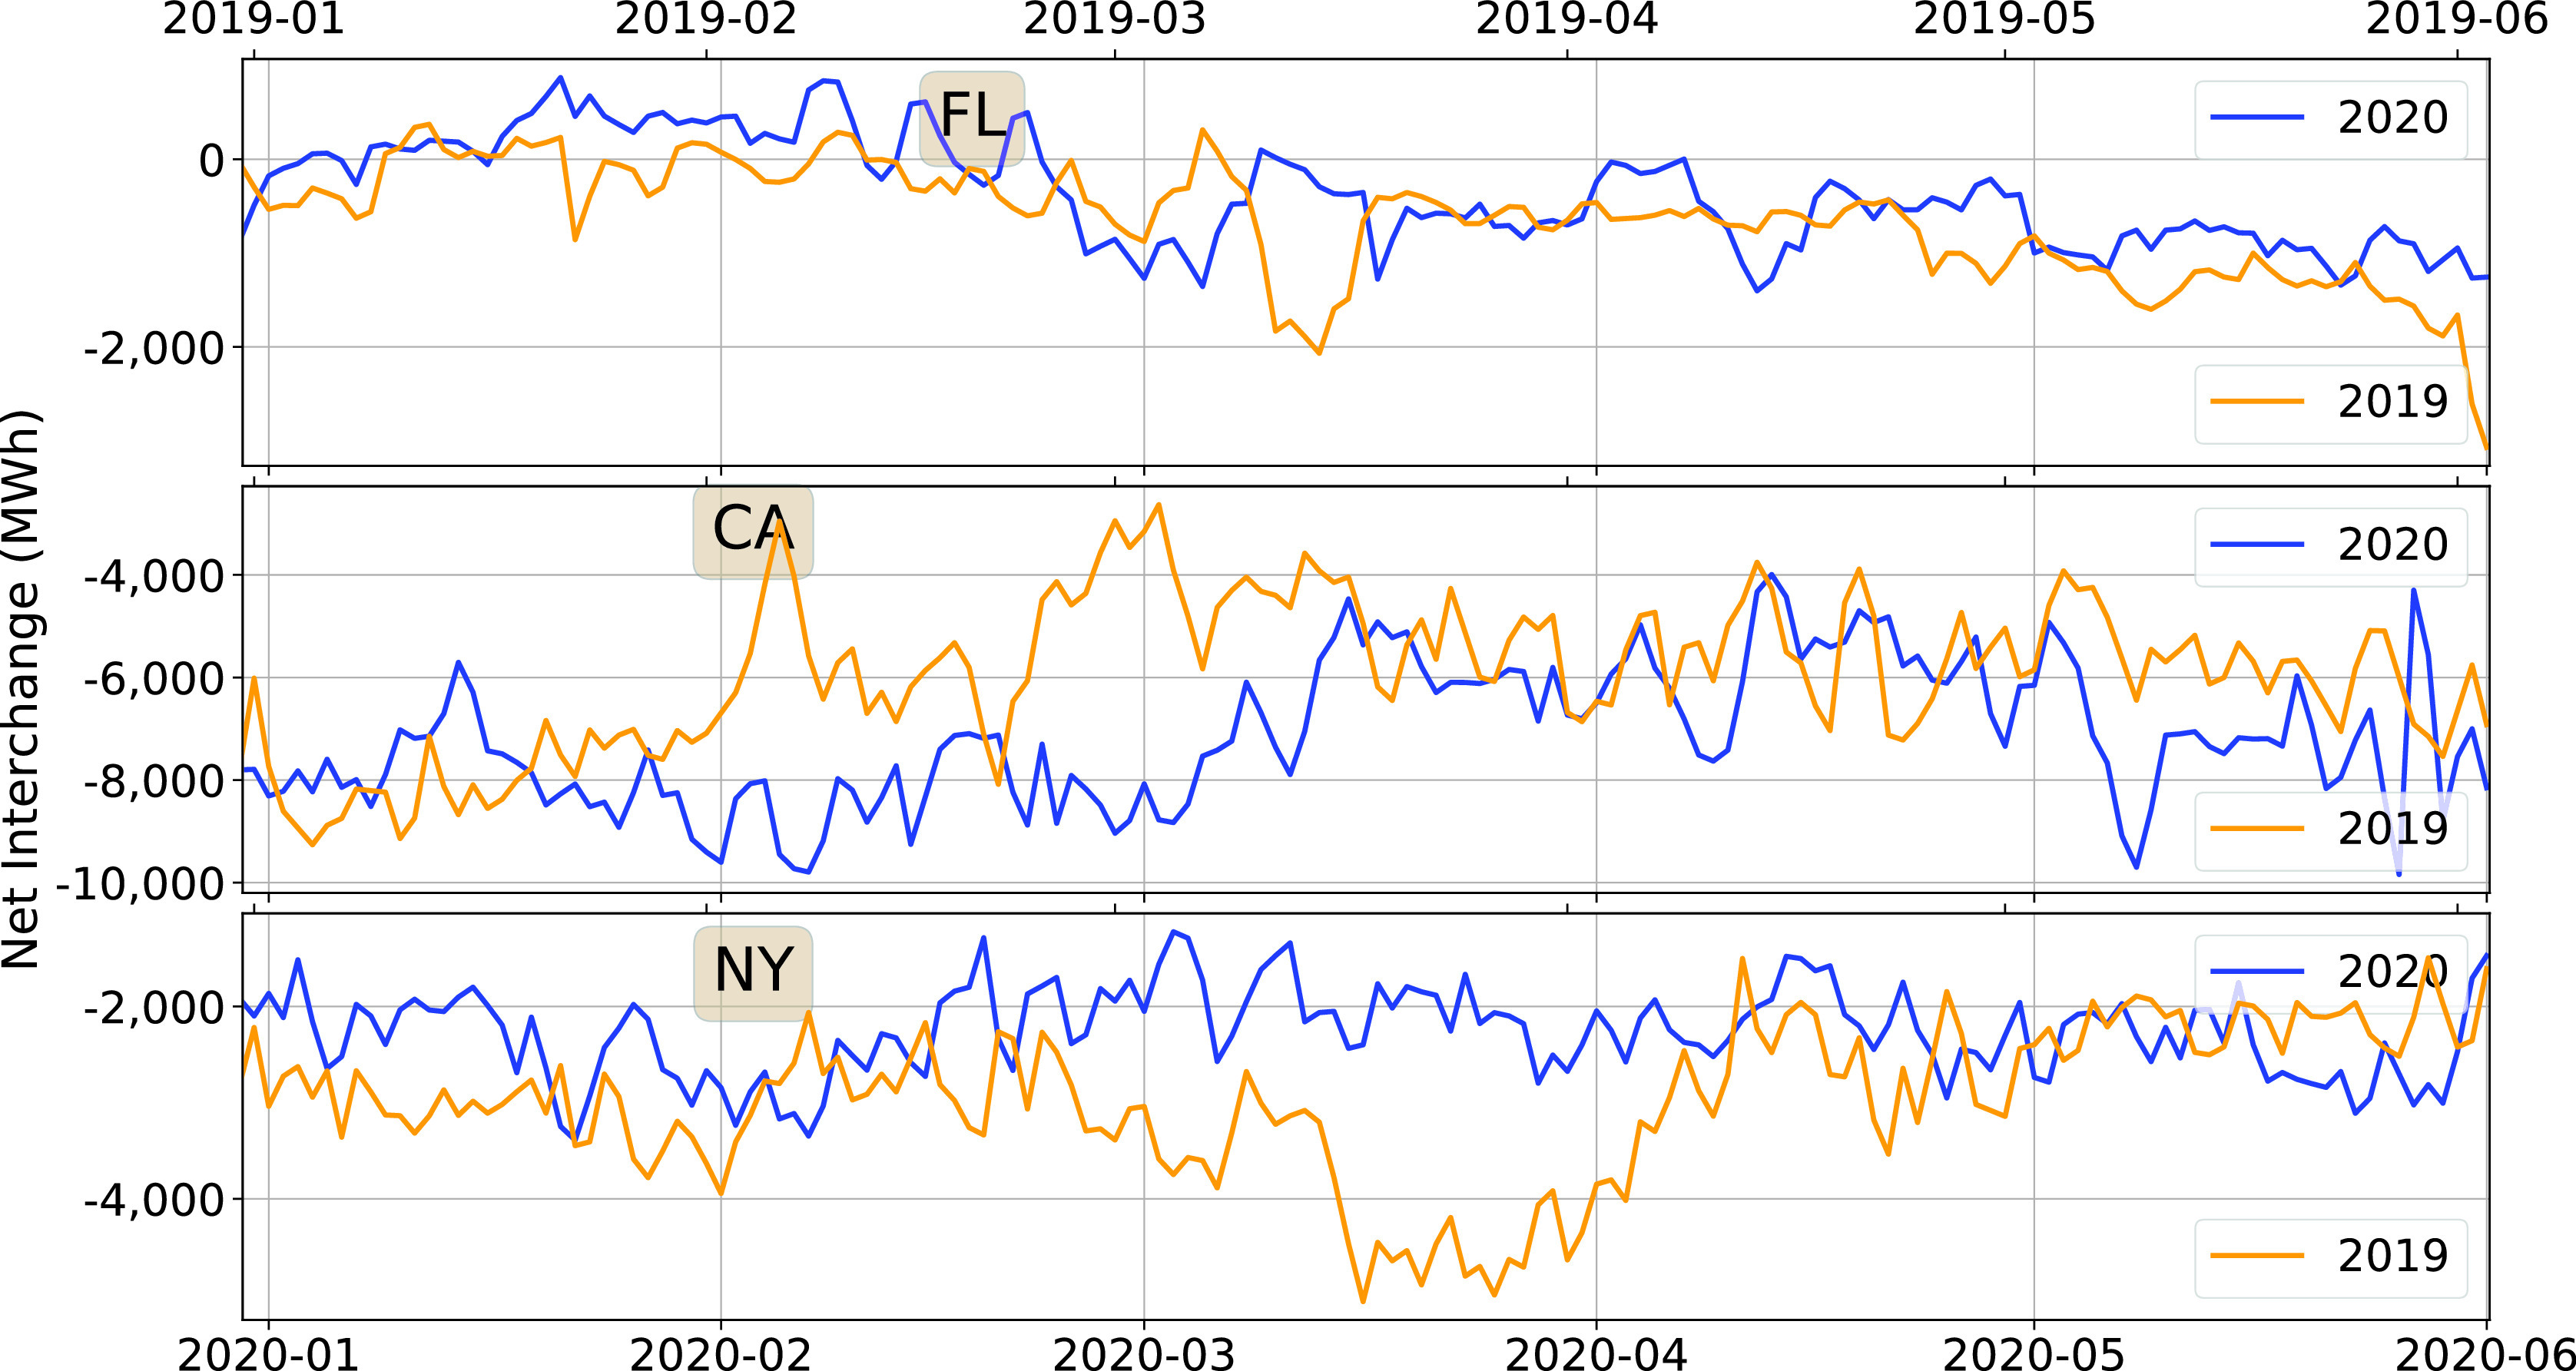
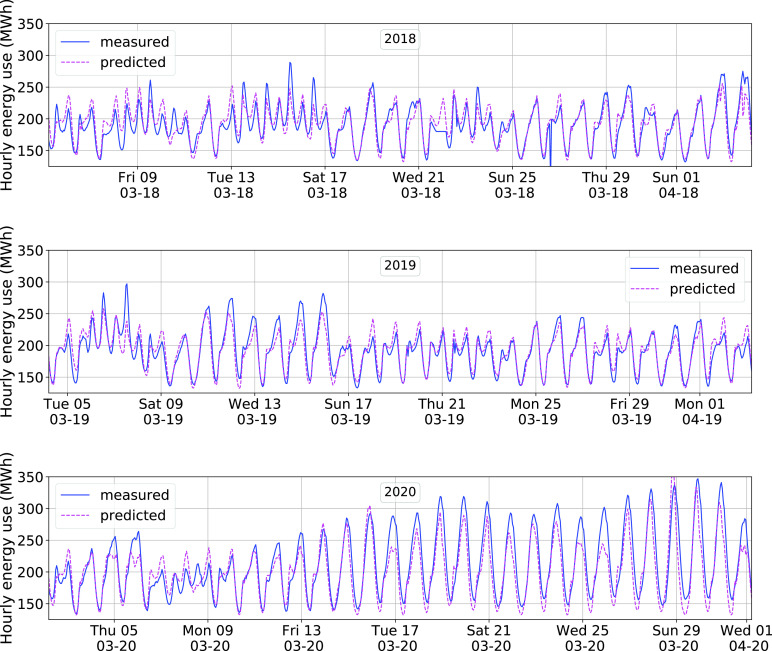
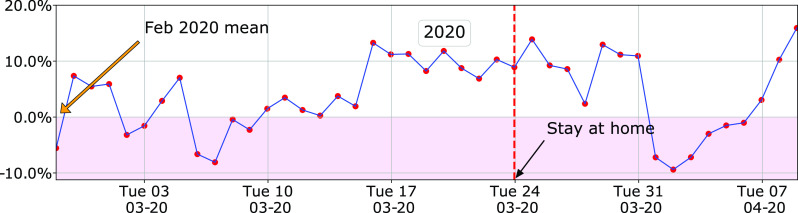
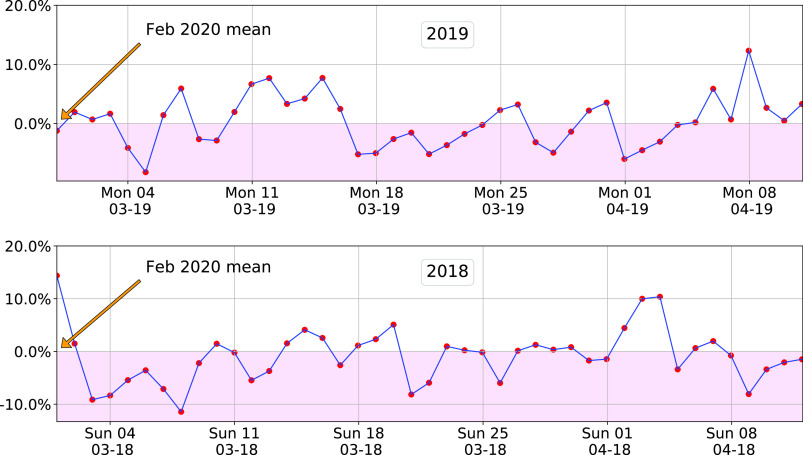
After the onset of the recent COVID-19 pandemic, a number of studies reported on possible changes in electricity consumption trends. The overall theme of these reports was that "electricity use has decreased during the pandemic, but the power grid is still reliable"-mostly due to reduced economic activity. In this paper, we analyze electricity data until the end of May 2020, examining both electricity demand and variables that can indicate stress on the power grid. We limit this study to three states in the U.S. California, Florida and New York. The results indicate that the effect of the pandemic on electricity demand is not a simple reduction, and there are noticeable differences among regions analyzed. The variables that can indicate stress on the grid (e.g., daily peak and trough of the hourly demand, demand ramp rate, demand forecast error, and net electricity interchange) also conveyed mixed messages: some indicate an increase in stress, some indicate a decrease, and some do not indicate any clear difference. A positive message is that some of the changes that were observed around the time stay-at-home orders were issued appeared to revert back by May 2020. A key challenge in ascribing any observed change to the pandemic is correcting for weather as it can be challenging to accurately define it for large geographic regions. We provide a weather-correction method, apply it to a small city-wide area in North Central Florida, and discuss the implications of the estimated changes in demand. The results indicate that a 10% (95% CI [2%, 18%]) increase in electricity demand is likely to have occurred due to COVID-19 for the city analyzed.
Keywords: COVID-19; Electricity; forecasting; power grid operation; regression; weather correction.
This work is licensed under a Creative Commons Attribution 4.0 License. For more information, see https://creativecommons.org/licenses/by/4.0/.
Figures


References
-
- BizEE. Degree Days—Handle With Care! Accessed: Jun. 25, 2020. [Online]. Available: https://www.energylens.com/articles/degree-days
-
- Bui Q. and Wolfers J., “Another way to see the recession: Power usage is way down,” New York Times, Apr. 2020. Accessed: May 6, 2020.
-
- Buitinck L., Louppe G., Blondel M., Pedregosa F., Mueller A., Grisel O., Niculae V., Prettenhofer P., Gramfort A., Grobler J., Layton R., VanderPlas J., Joly A., Holt B., and Varoquaux G., “API design for machine learning software: Experiences from the scikit-learn project,” in Proc. ECML PKDD Workshop, Lang. Data Mining Mach. Learn., 2013, pp. 108–122.
-
- CAISO Market Analysis and Forecasting. (May 24, 2020). COVID-19 Impacts to California ISO Load & Markets. Accessed: May 27, 2020. [Online]. Available: http://www.caiso.com/Documents/COVID-19-Impacts-ISOLoadForecast-Presenta...
-
- Callahan J.. Wary of Mold, District Will Keep AC on at Vacant Schools this Summer. Accessed: Jul. 30, 2020. [Online]. Available: https://www.ocala.com/news/20190418/wary-of-mold-district-will-keep-ac-o...
LinkOut - more resources
Full Text Sources