

Development and validation of a prognostic nomogram model for Chinese patients with primary small cell carcinoma of the esophagus
- PMID: 34786384
- PMCID: PMC8567530
- DOI: 10.12998/wjcc.v9.i30.9011
Development and validation of a prognostic nomogram model for Chinese patients with primary small cell carcinoma of the esophagus
Abstract
Background: Primary small cell carcinoma of the esophagus (PSCE) is a highly invasive malignant tumor with a poor prognosis compared with esophageal squamous cell carcinoma. Due to the limited samples size and the short follow-up time, there are few reports on elucidating the prognosis of PSCE, especially on the establishment and validation of a survival prediction nomogram model covering general information, pathological factors and specific biological proteins of PSCE patients.
Aim: To establish an effective nomogram to predict the overall survival (OS) probability for PSCE patients in China.
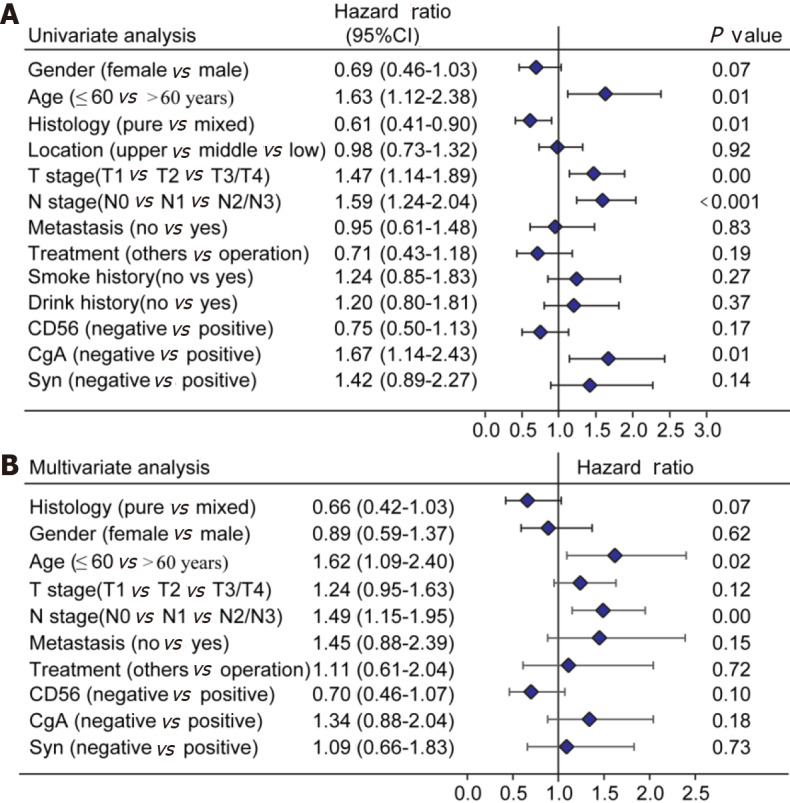
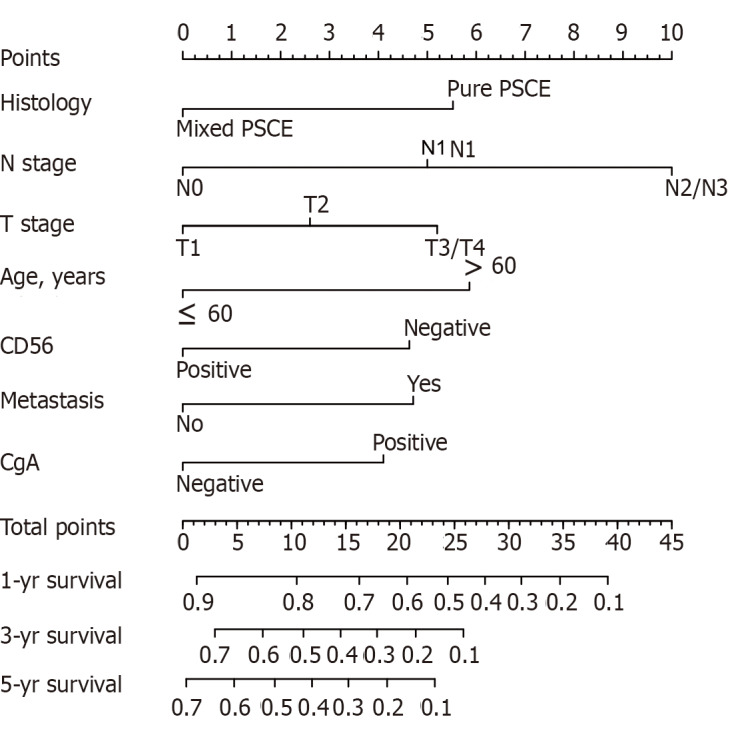
Methods: The nomogram was based on a retrospective study of 256 PSCE patients. Univariate analysis and multivariate Cox proportional hazards regression analysis were used to examine the prognostic factors associated with PSCE, and establish the model for predicting 1-, 3-, and 5-year OS based on the Akaike information criterion. Discrimination and validation were assessed by the concordance index (C-index) and calibration curve and decision curve analysis (DCA). Histology type, age, tumor invasion depth, lymph node invasion, detectable metastasis, chromogranin A, and neuronal cell adhesion molecule 56 were integrated into the model.
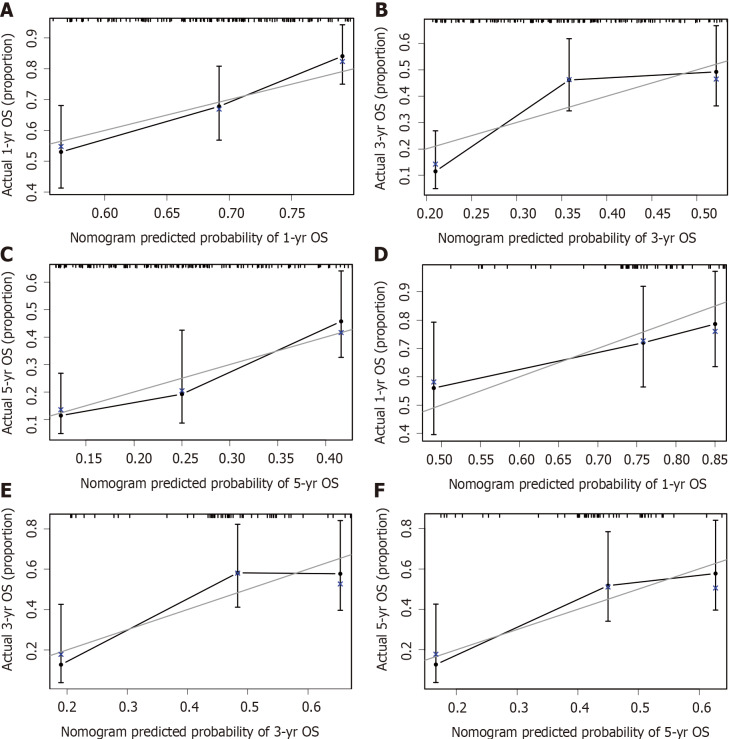
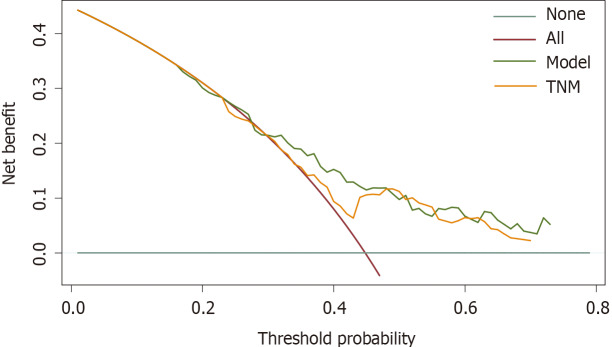
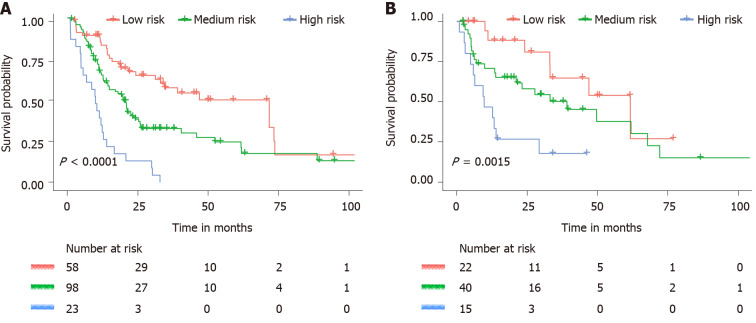
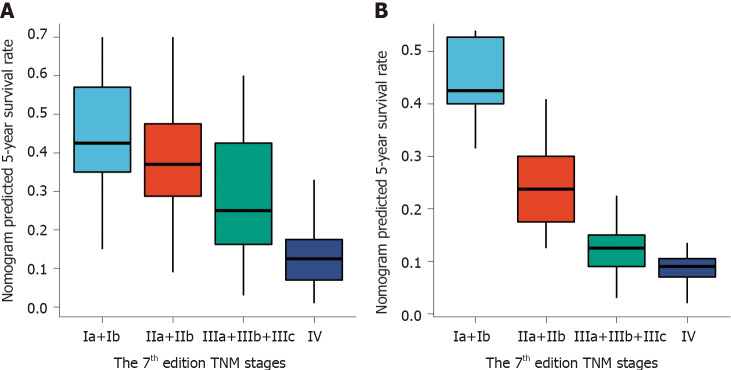
Results: The C-index was prognostically superior to the 7th tumor node metastasis (TNM) staging in the primary cohort [0.659 (95%CI: 0.607-0.712) vs 0.591 (95%CI: 0.517-0.666), P = 0.033] and in the validation cohort [0.700 (95%CI: 0.622-0.778) vs 0.605 (95%CI: 0.490-0.721), P = 0.041]. Good calibration curves were observed for the prediction probabilities of 1-, 3-, and 5-year OS in both cohorts. DCA analysis showed that our nomogram model had a higher overall net benefit compared to the 7th TNM staging .
Conclusion: Our nomogram can be used to predict the survival probability of PSCE patients, which can help clinicians to make individualized survival predictions.
Keywords: Decision curve analysis; Esophagus; Nomogram; Primary small cell carcinoma; Prognosis.
©The Author(s) 2021. Published by Baishideng Publishing Group Inc. All rights reserved.
Conflict of interest statement
Conflict-of-interest statement: We have no potential conflicts of interest to disclose.
Figures
References
-
- Vos B, Rozema T, Miller RC, Hendlisz A, Van Laethem JL, Khanfir K, Weber DC, El Nakadi I, Van Houtte P. Small cell carcinoma of the esophagus: a multicentre Rare Cancer Network study. Dis Esophagus. 2011;24:258–264. - PubMed
-
- Li AF, Li AC, Hsu CY, Li WY, Hsu HS, Chen JY. Small cell carcinomas in gastrointestinal tract: immunohistochemical and clinicopathological features. J Clin Pathol. 2010;63:620–625. - PubMed
-
- Rice TW, Rusch VW, Ishwaran H, Blackstone EH Worldwide Esophageal Cancer Collaboration. Cancer of the esophagus and esophagogastric junction: data-driven staging for the seventh edition of the American Joint Committee on Cancer/International Union Against Cancer Cancer Staging Manuals. Cancer. 2010;116:3763–3773. - PubMed
-
- Edge SB, Compton CC. The American Joint Committee on Cancer: the 7th edition of the AJCC cancer staging manual and the future of TNM. Ann Surg Oncol. 2010;17:1471–1474. - PubMed
LinkOut - more resources
Full Text Sources
Research Materials
