

Activated PI3Kδ syndrome, an immunodeficiency disorder, leads to sensorimotor deficits recapitulated in a murine model
- PMID: 34786564
- PMCID: PMC8579111
- DOI: 10.1016/j.bbih.2021.100377
Activated PI3Kδ syndrome, an immunodeficiency disorder, leads to sensorimotor deficits recapitulated in a murine model
Abstract
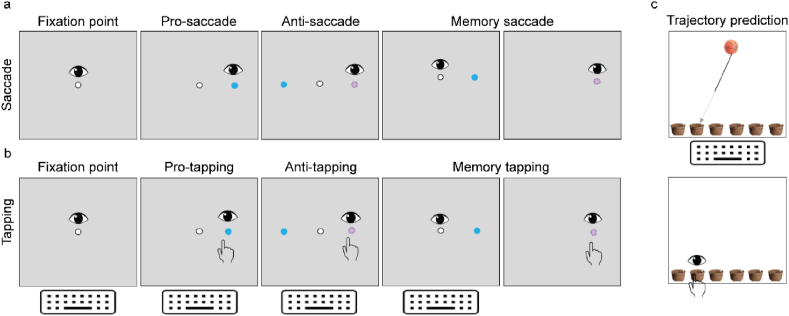
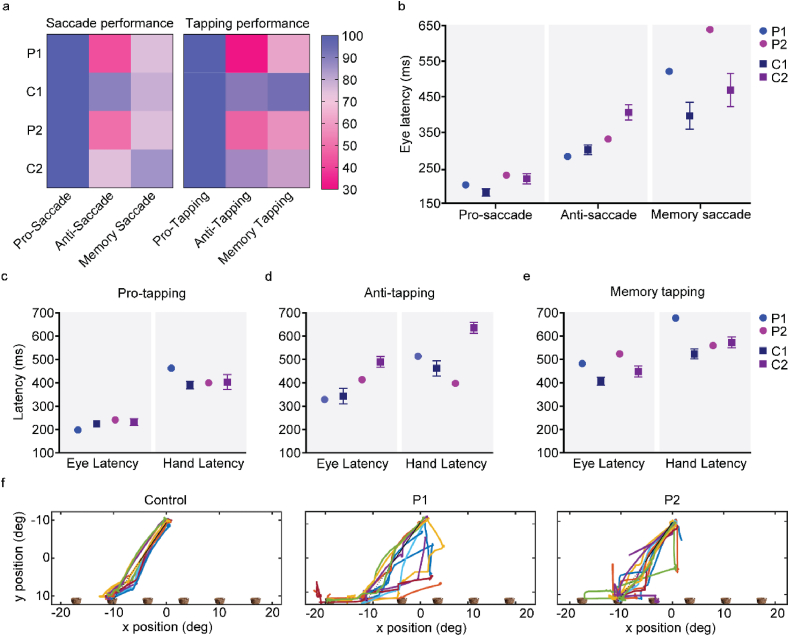
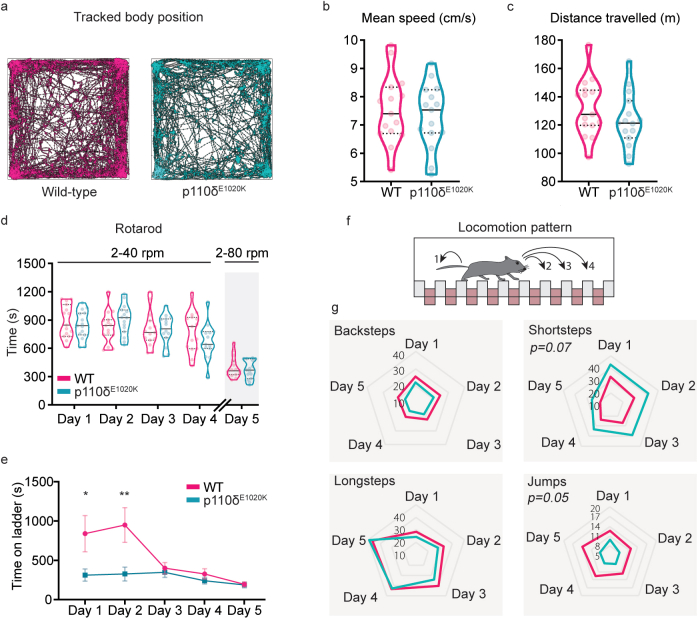
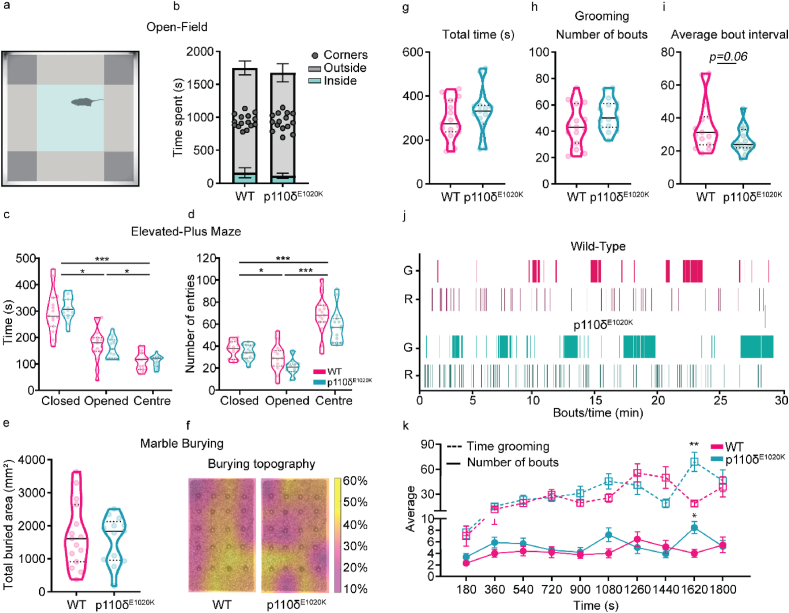
The phosphoinositide-3-kinase (PI3K) family plays a major role in cell signaling and is predominant in leukocytes. Gain-of-function (GOF) mutations in the PIK3CD gene lead to the development of activated PI3Kδ syndrome (APDS), a rare primary immunodeficiency disorder. A subset of APDS patients also displays neurodevelopmental delay symptoms, suggesting a potential role of PIK3CD in cognitive and behavioural function. However, the extent and nature of the neurodevelopmental deficits has not been previously quantified. Here, we assessed the cognitive functions of two APDS patients, and investigated the causal role of the PIK3CD GOF mutation in neurological deficits using a murine model of this disease. We used p110δE1020K knock-in mice, harbouring the most common APDS mutation in patients. We found that APDS patients present with visuomotor deficits, exacerbated by autism spectrum disorder comorbidity, whereas p110δE1020K mice exhibited impairments in motor behaviour, learning and repetitive behaviour patterning. Our data indicate that PIK3CD GOF mutations increase the risk for neurodevelopmental deficits, supporting previous findings on the interplay between the nervous and the immune system. Further, our results validate the knock-in mouse model, and offer an objective assessment tool for patients that could be incorporated in diagnosis and in the evaluation of treatments.
Keywords: APDS; ASD; Mouse; PID; PIK3CD; Primary immunodeficiency.
© 2021 The Authors.
Conflict of interest statement
We declare that one of the authors (PMH) has received grants and research support from Takeda, CSL Behring, Abbvie, Lamepro, Novartis Nederland, and honoraria or consultation fees from UCB Pharma. All the other authors have no conflict of interest to declare.
Figures
Similar articles
-
Clinical spectrum and features of activated phosphoinositide 3-kinase δ syndrome: A large patient cohort study.J Allergy Clin Immunol. 2017 Feb;139(2):597-606.e4. doi: 10.1016/j.jaci.2016.06.021. Epub 2016 Jul 16. J Allergy Clin Immunol. 2017. PMID: 27555459 Free PMC article.
-
Disorders Related to PI3Kδ Hyperactivation: Characterizing the Clinical and Immunological Features of Activated PI3-Kinase Delta Syndromes.Front Pediatr. 2021 Aug 5;9:702872. doi: 10.3389/fped.2021.702872. eCollection 2021. Front Pediatr. 2021. PMID: 34422726 Free PMC article. Review.
-
Hyperactive PI3Kδ predisposes naive T cells to activation via aerobic glycolysis programs.Cell Mol Immunol. 2021 Jul;18(7):1783-1797. doi: 10.1038/s41423-020-0379-x. Epub 2020 Feb 25. Cell Mol Immunol. 2021. PMID: 32099075 Free PMC article.
-
Conformational disruption of PI3Kδ regulation by immunodeficiency mutations in PIK3CD and PIK3R1.Proc Natl Acad Sci U S A. 2017 Feb 21;114(8):1982-1987. doi: 10.1073/pnas.1617244114. Epub 2017 Feb 6. Proc Natl Acad Sci U S A. 2017. PMID: 28167755 Free PMC article.
-
Activated PI3 Kinase Delta Syndrome: From Genetics to Therapy.Front Immunol. 2018 Feb 27;9:369. doi: 10.3389/fimmu.2018.00369. eCollection 2018. Front Immunol. 2018. PMID: 29535736 Free PMC article. Review.
Cited by
-
Bridging the gap: neurodevelopmental disorder risks in inborn errors of immunity.Curr Opin Allergy Clin Immunol. 2024 Dec 1;24(6):472-478. doi: 10.1097/ACI.0000000000001036. Epub 2024 Oct 3. Curr Opin Allergy Clin Immunol. 2024. PMID: 39374040 Free PMC article. Review.
-
Hyperactivation of the PI3K pathway in inborn errors of immunity: current understanding and therapeutic perspectives.Immunother Adv. 2024 Nov 7;4(1):ltae009. doi: 10.1093/immadv/ltae009. eCollection 2024. Immunother Adv. 2024. PMID: 39679264 Free PMC article. Review.
-
Systematic literature reviews to identify epidemiological, clinical, economic and health-related quality of life evidence in activated PI3Kδ syndrome (APDS).BMC Immunol. 2025 Jul 19;26(1):52. doi: 10.1186/s12865-025-00723-6. BMC Immunol. 2025. PMID: 40684159 Free PMC article.
-
A Novel Automated Approach for Improving Standardization of the Marble Burying Test Enables Quantification of Burying Bouts and Activity Characteristics.eNeuro. 2022 Apr 1;9(2):ENEURO.0446-21.2022. doi: 10.1523/ENEURO.0446-21.2022. Print 2022 Mar-Apr. eNeuro. 2022. PMID: 35288451 Free PMC article.
-
Hierarchical Trait-State Model for Decoding Dyadic Social Interactions.ArXiv [Preprint]. 2024 Nov 19:arXiv:2411.12145v1. ArXiv. 2024. Update in: Sci Rep. 2025 Apr 03;15(1):11399. doi: 10.1038/s41598-025-95916-9. PMID: 39606736 Free PMC article. Updated. Preprint.
References
-
- Abolhassani H., et al. Clinical, immunologic, and genetic spectrum of 696 patients with combined immunodeficiency. J. Allergy Clin. Immunol. 2018;141:1450–1458. - PubMed
-
- Amaya-Uribe L., Rojas M., Azizi G., Anaya J.-M., Gershwin M.E. Primary immunodeficiency and autoimmunity: a comprehensive review. J. Autoimmun. 2019;99:52–72. - PubMed
Grants and funding
LinkOut - more resources
Full Text Sources
Miscellaneous
