

Compositional assessment of bone by Raman spectroscopy
- PMID: 34786574
- PMCID: PMC8802336
- DOI: 10.1039/d1an01560e
Compositional assessment of bone by Raman spectroscopy
Abstract
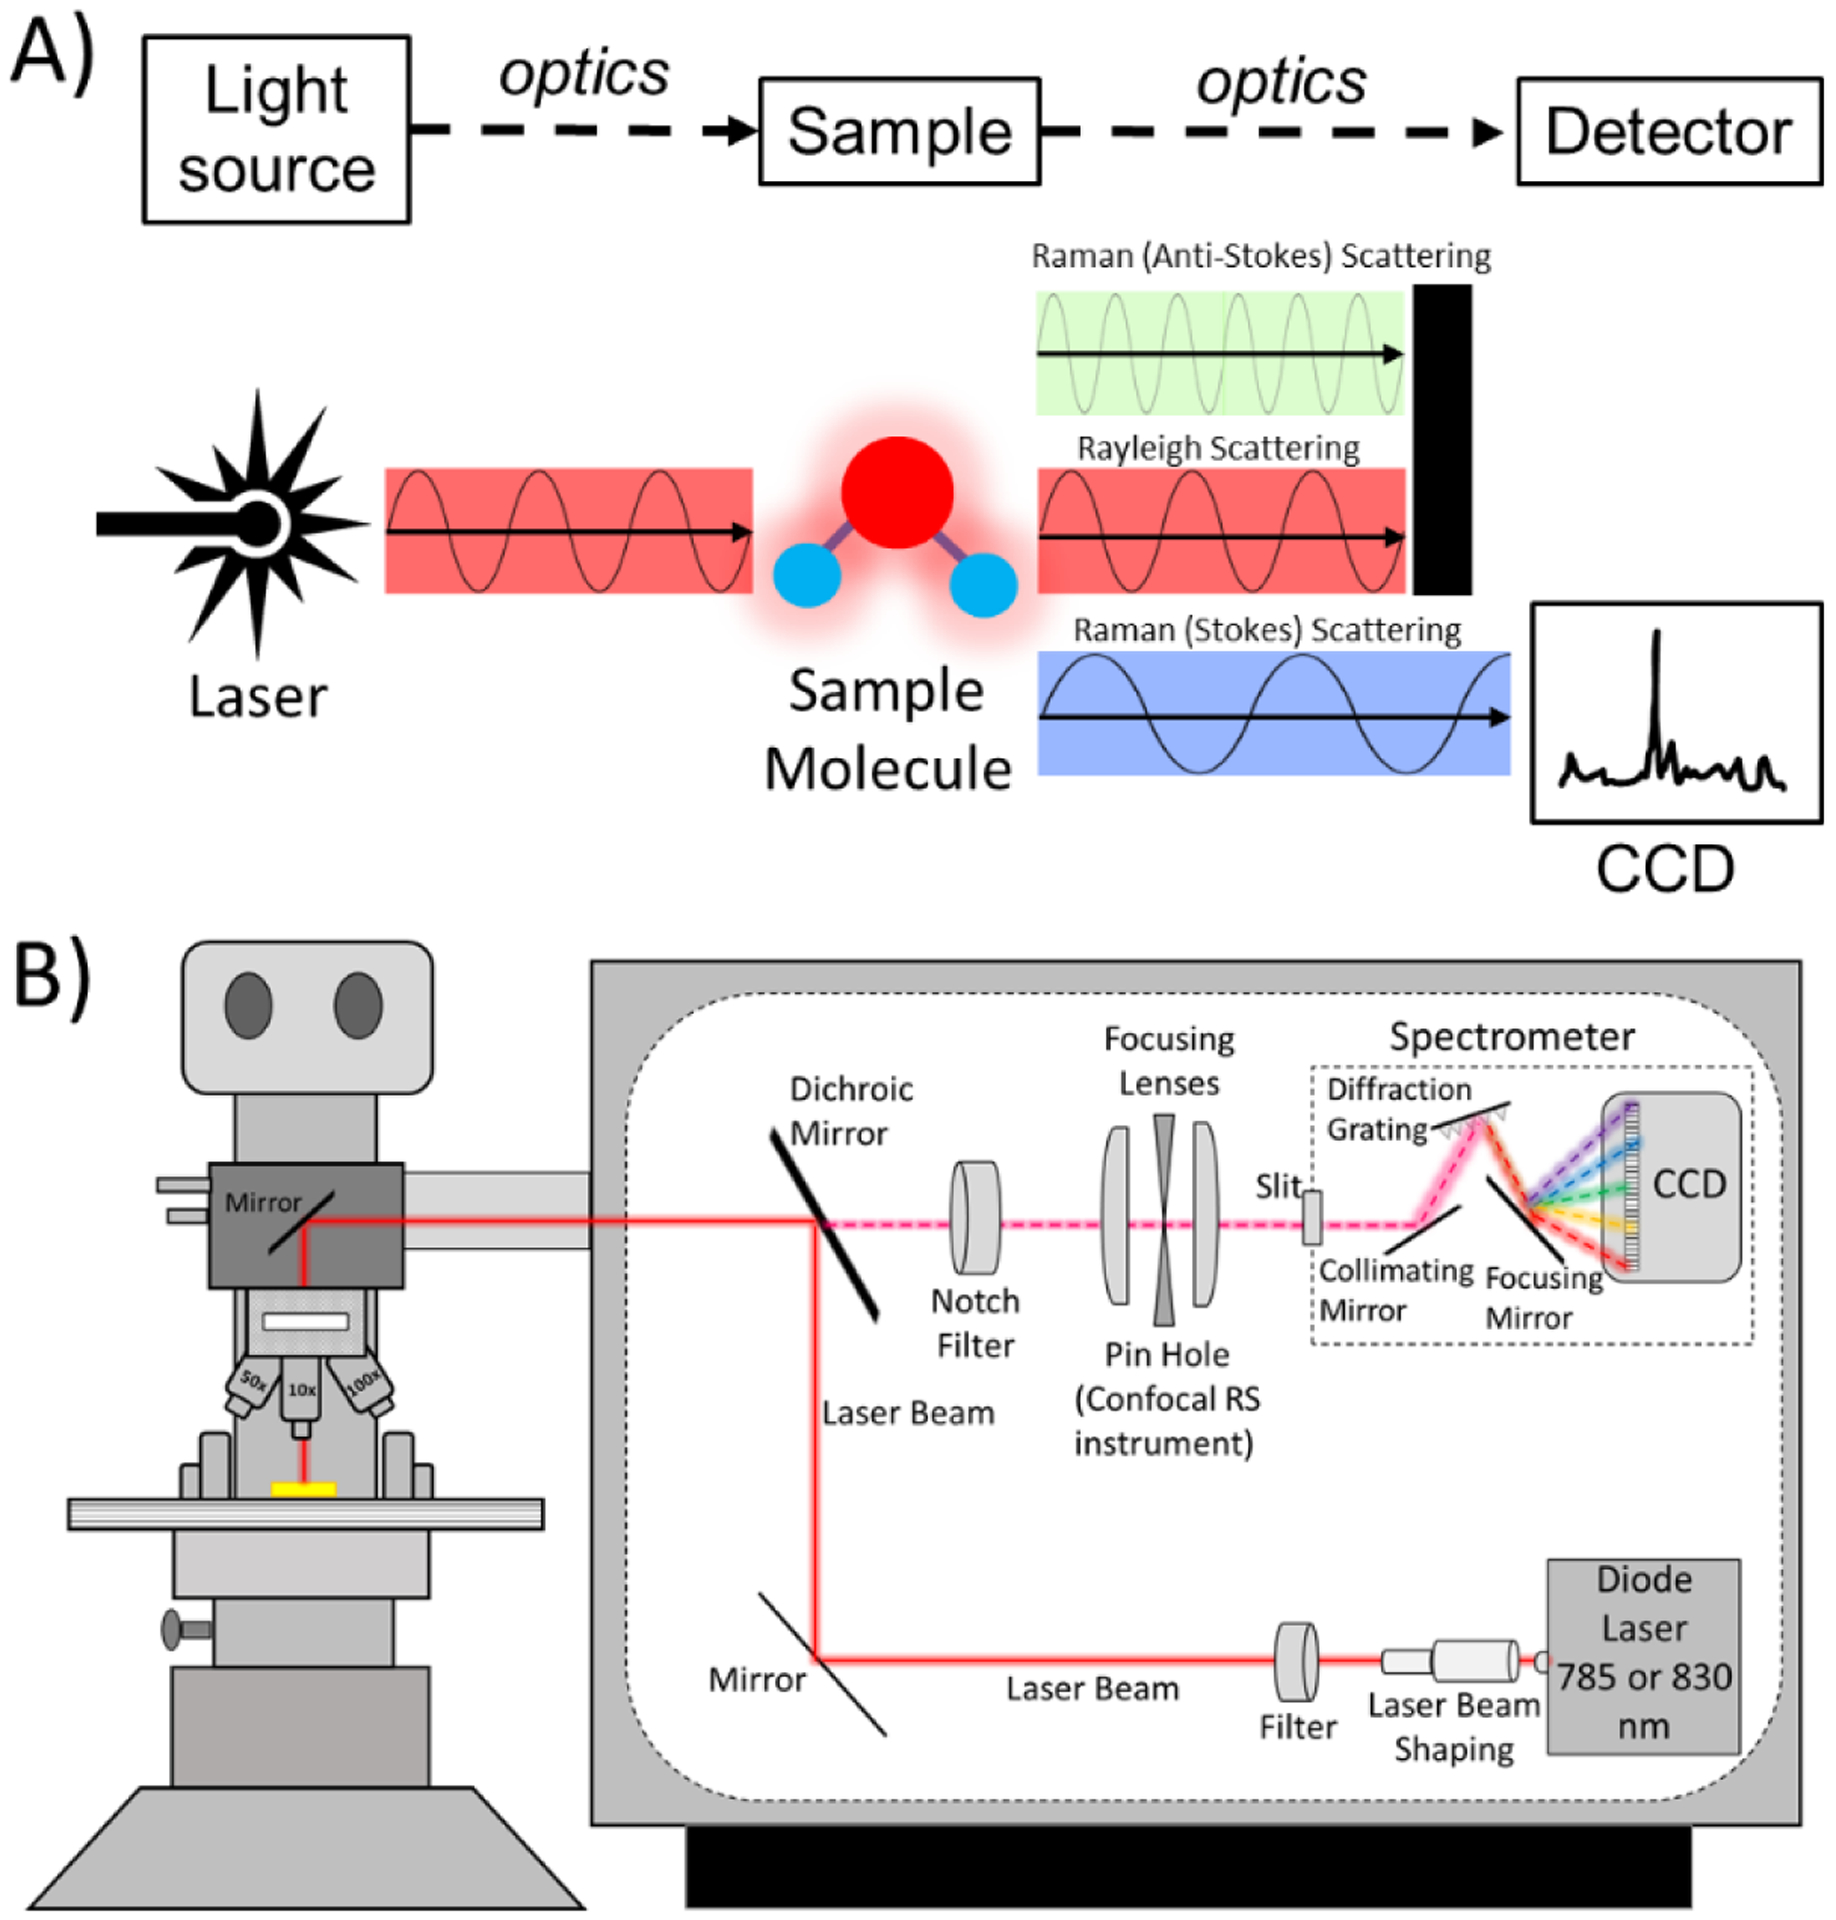
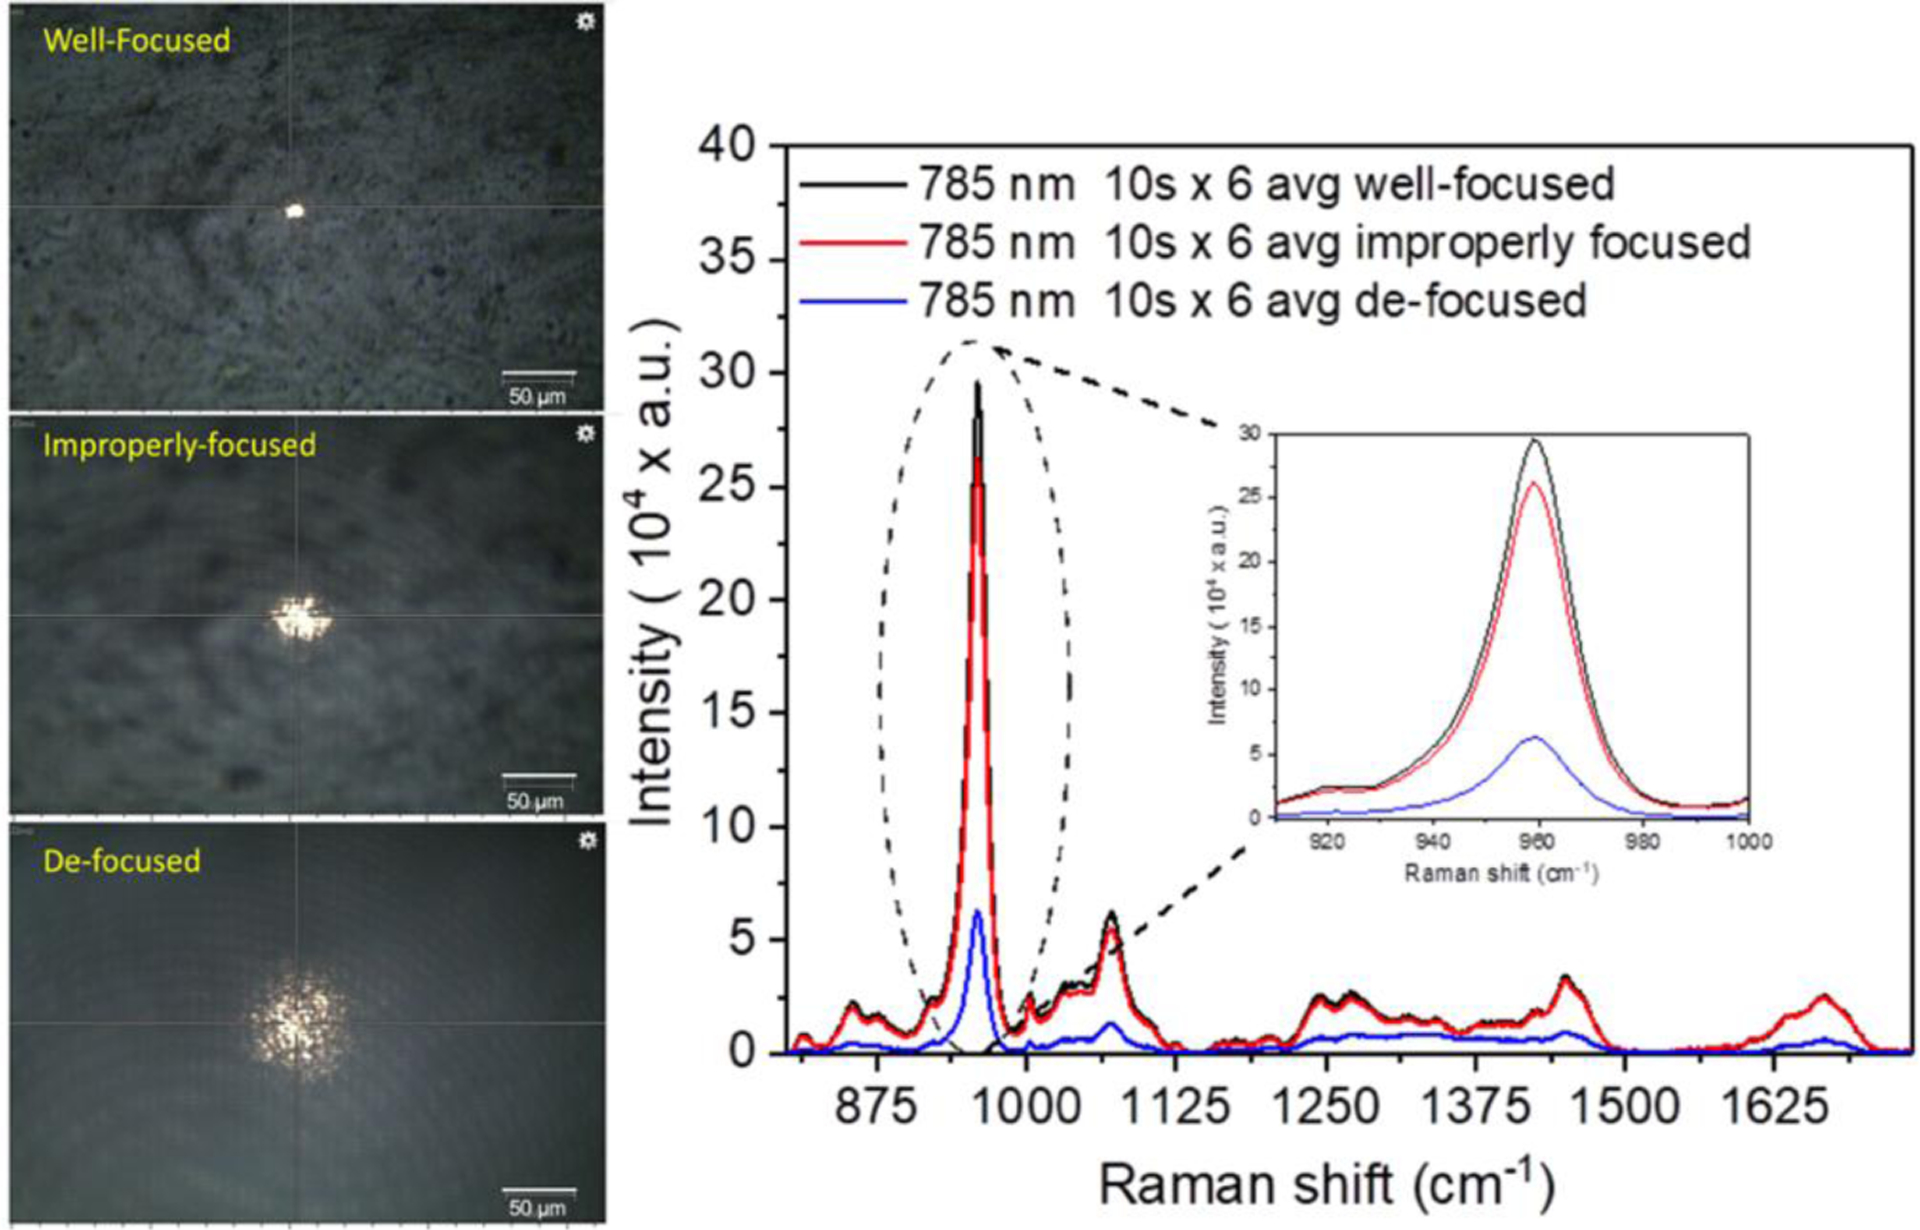
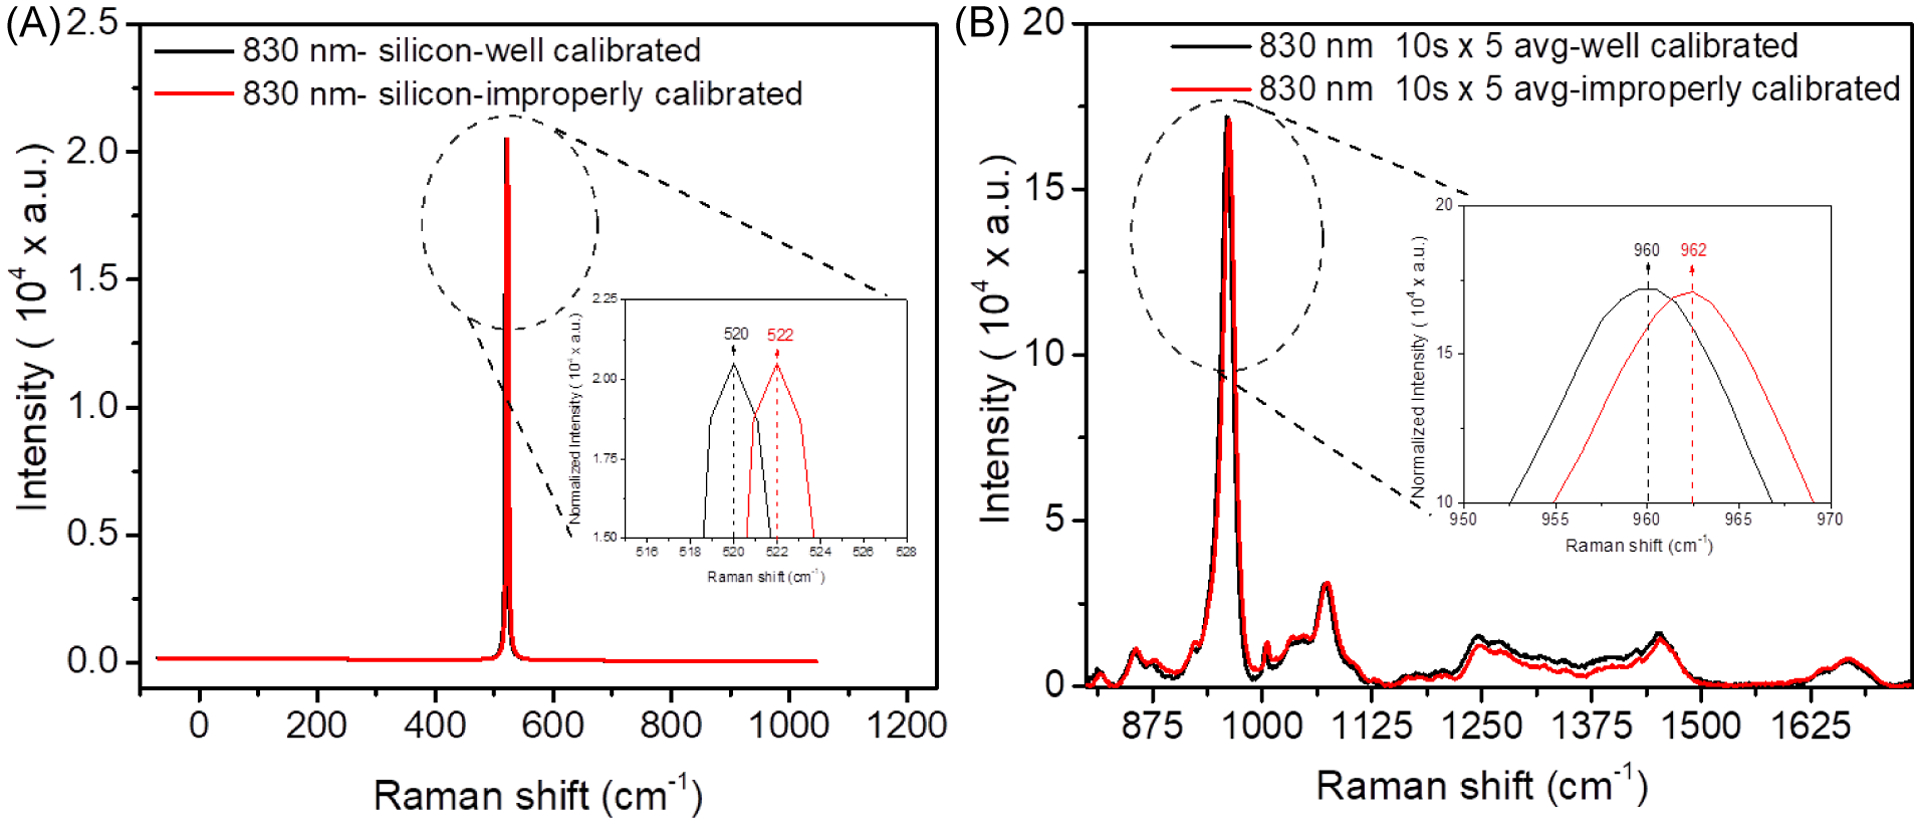
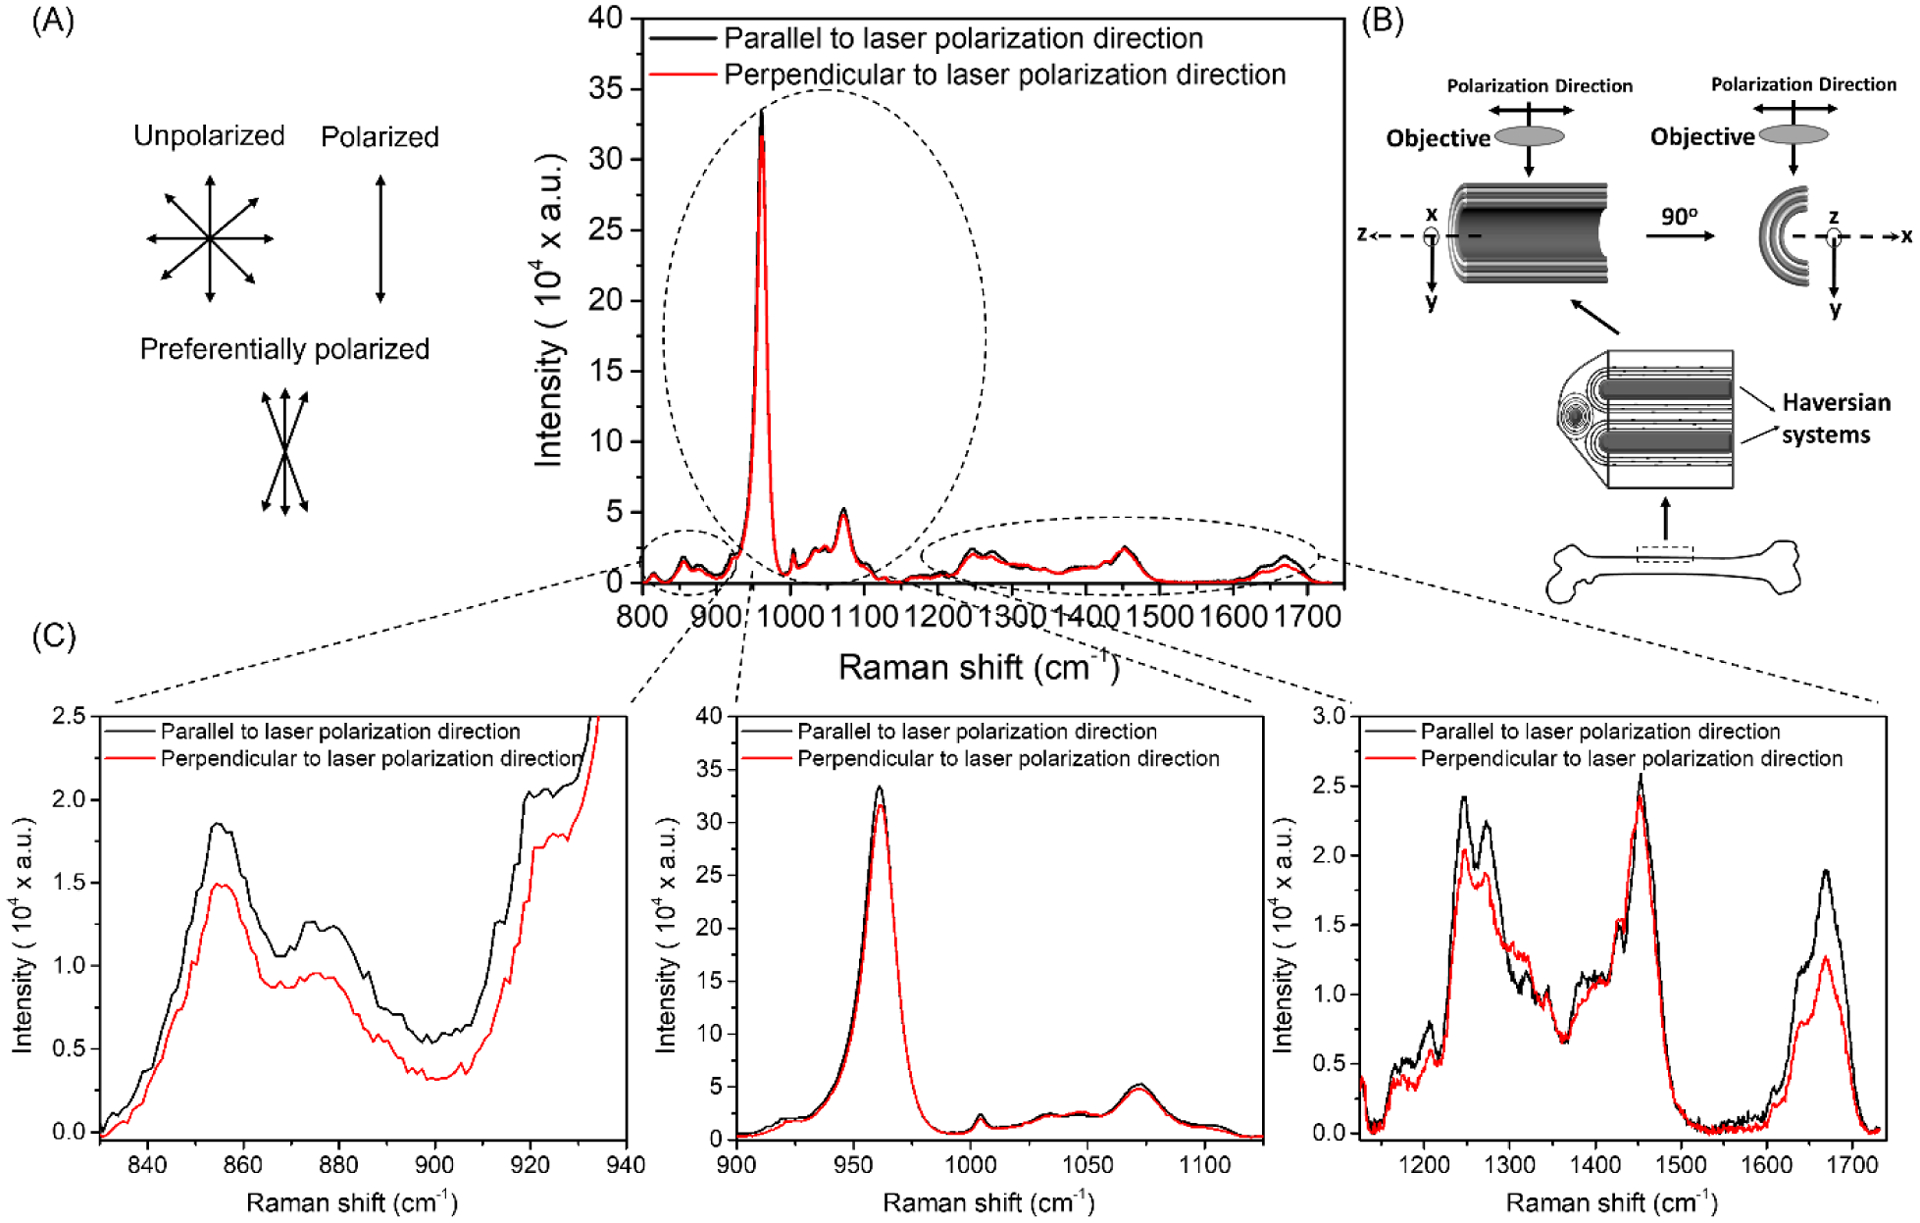
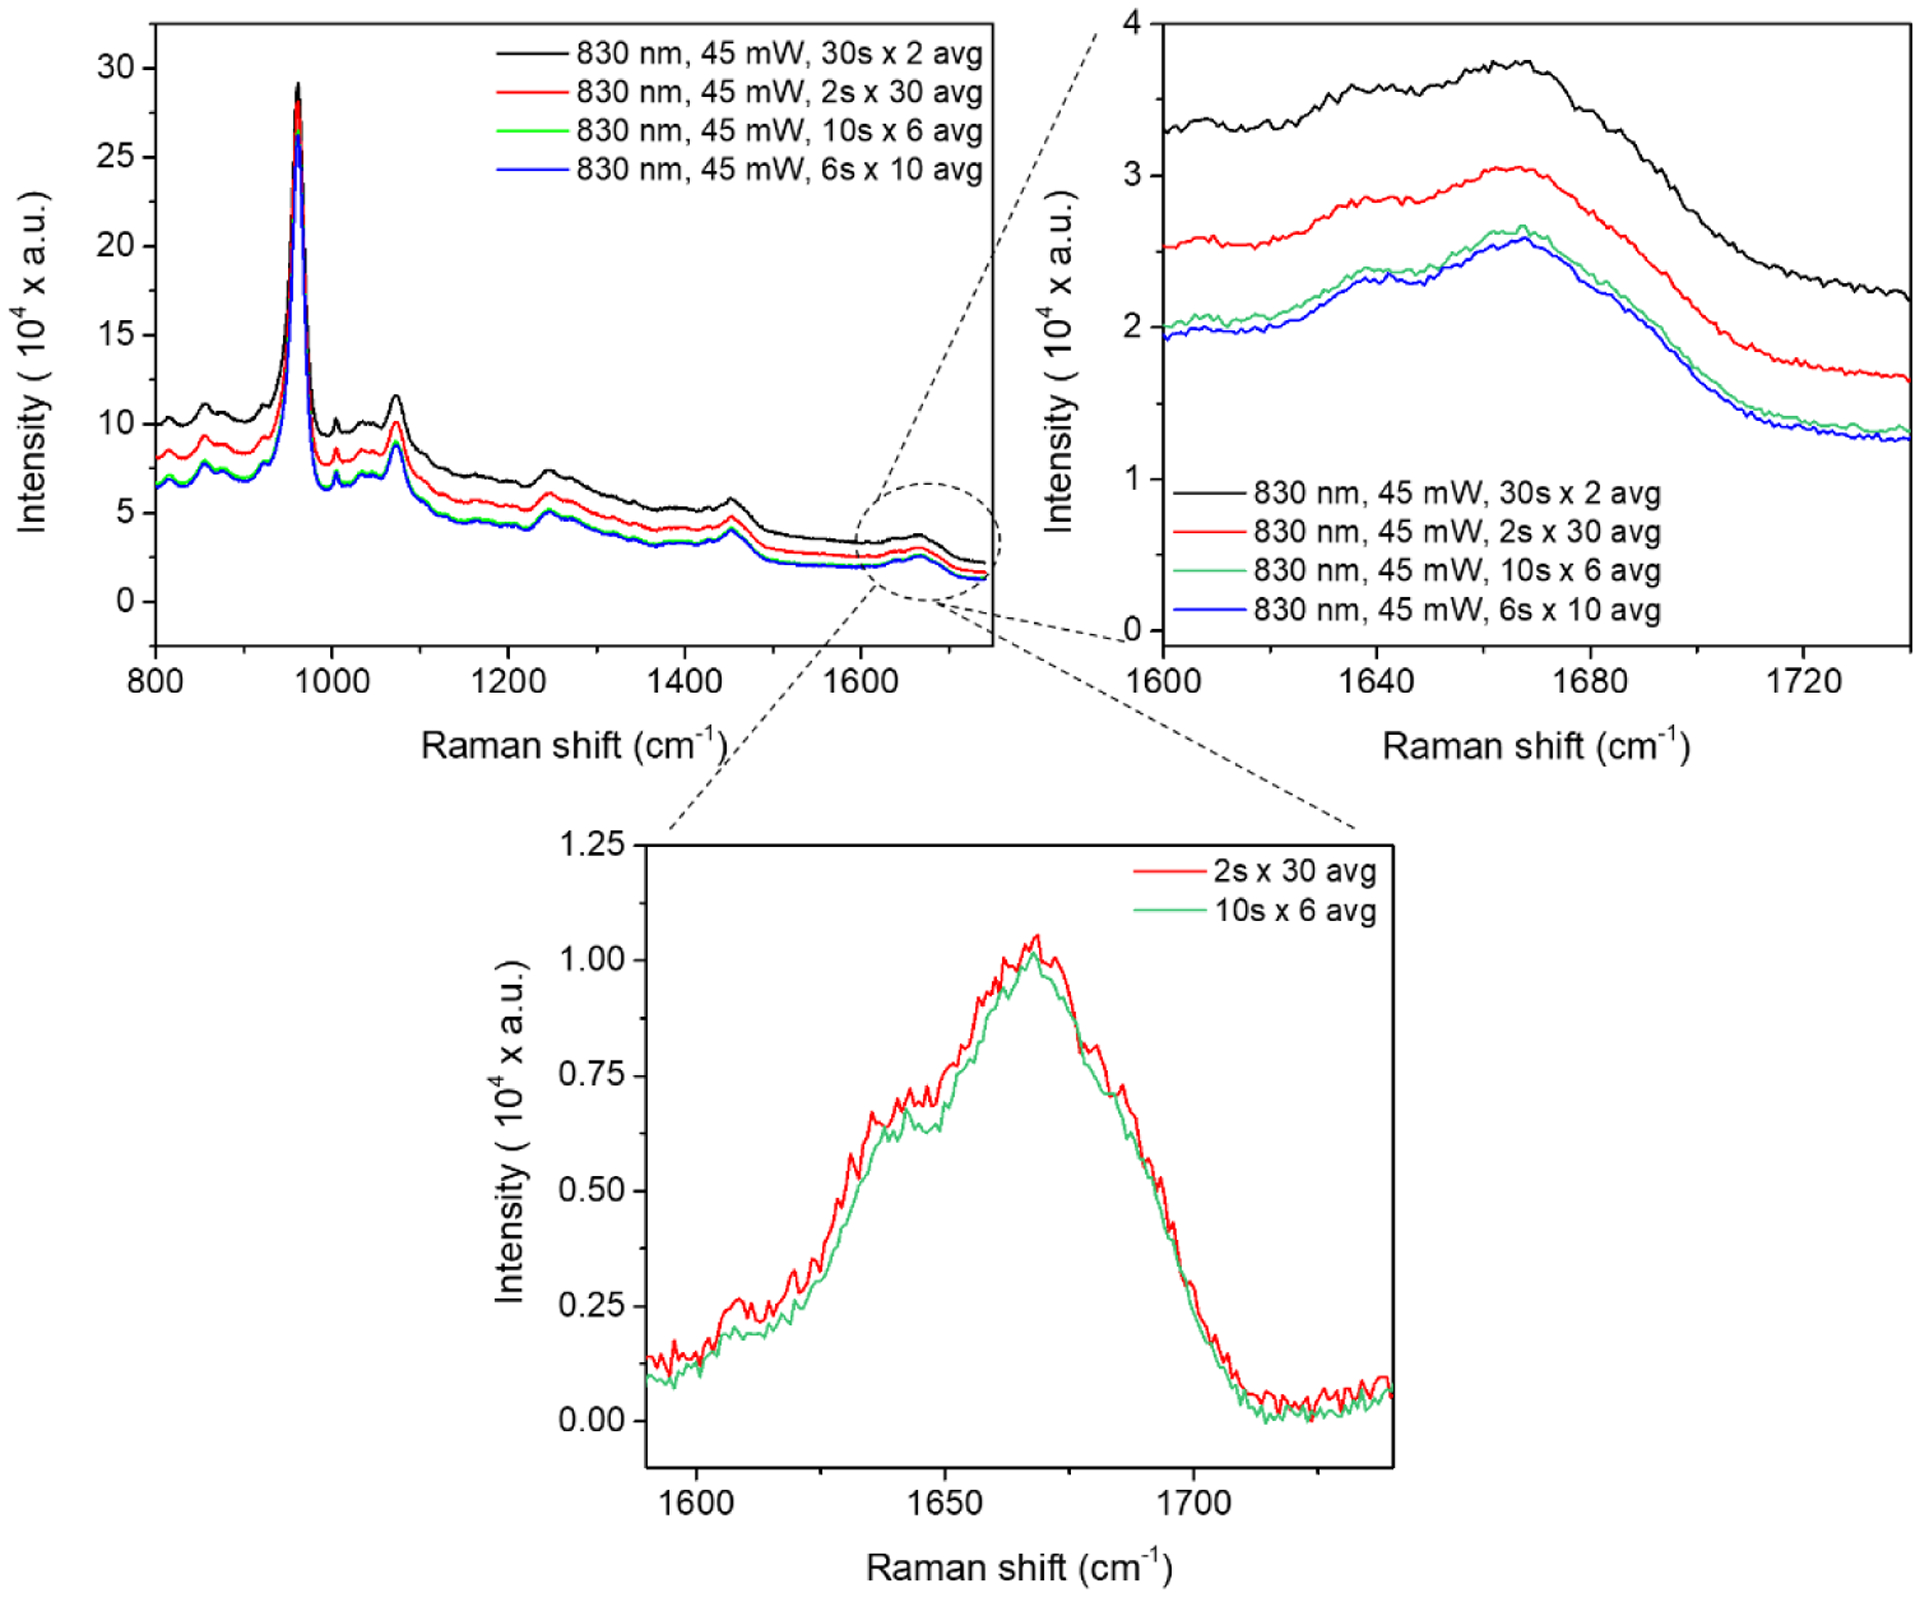
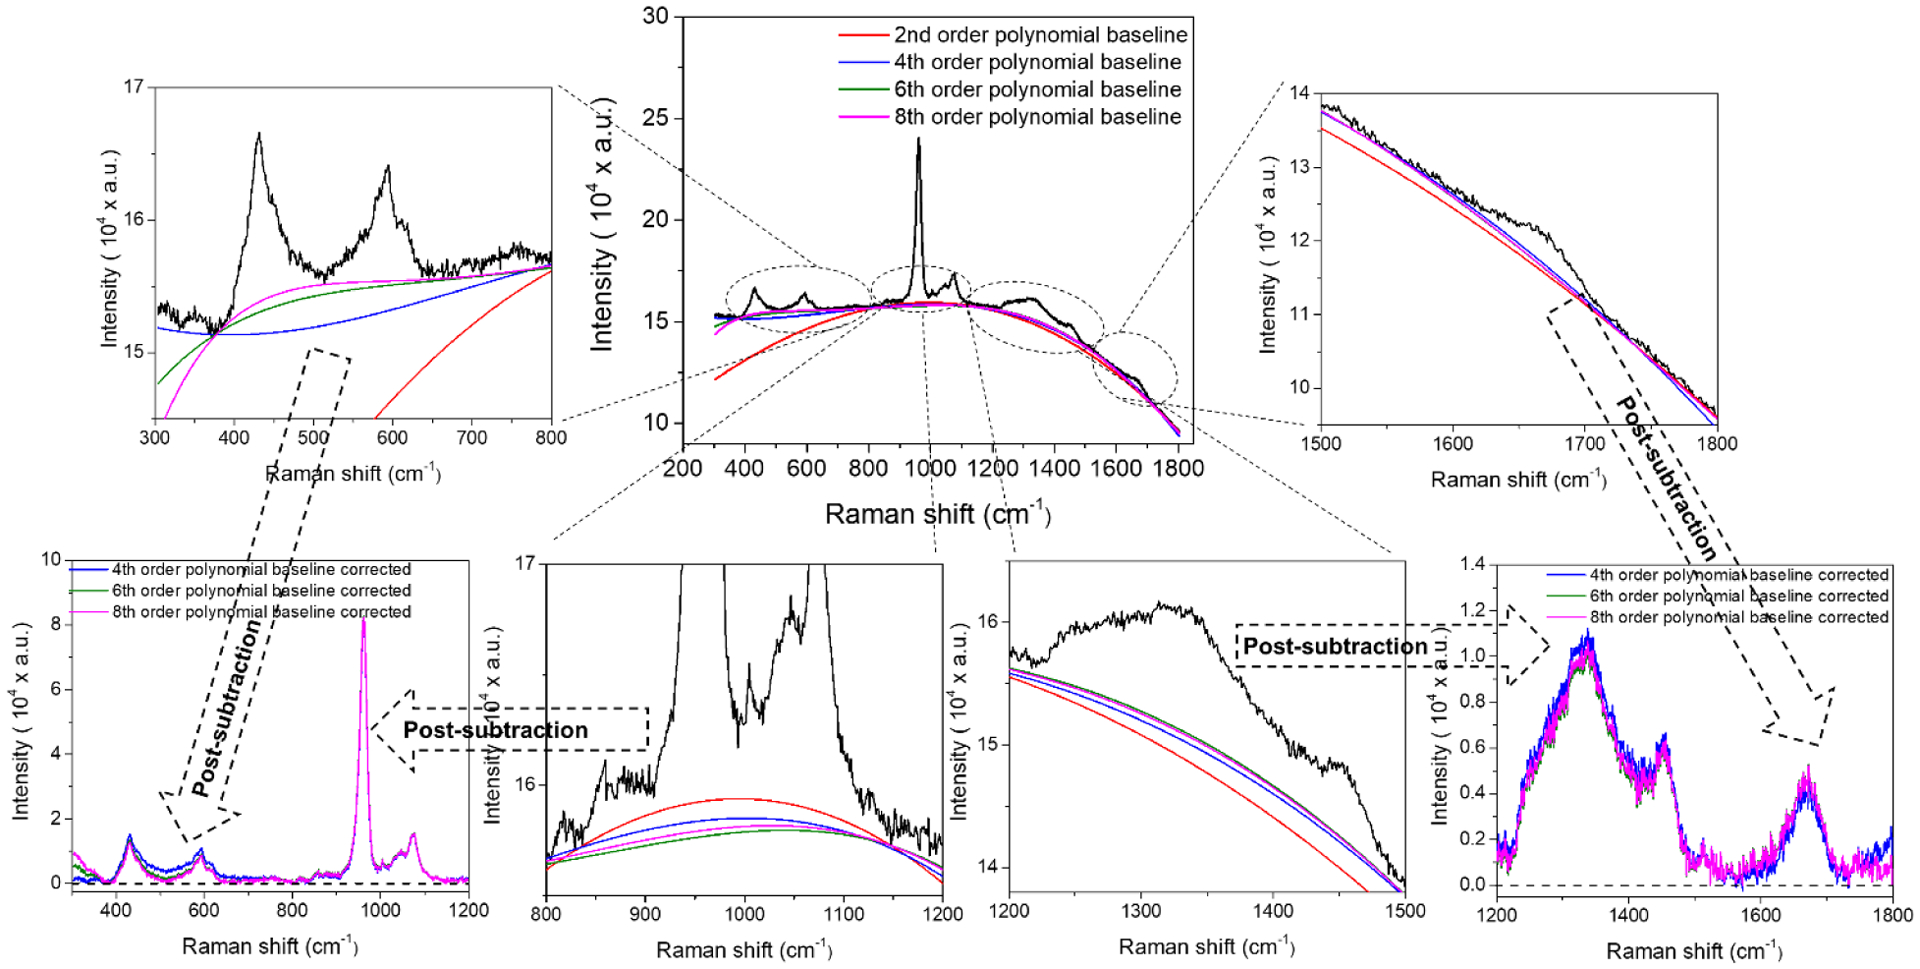
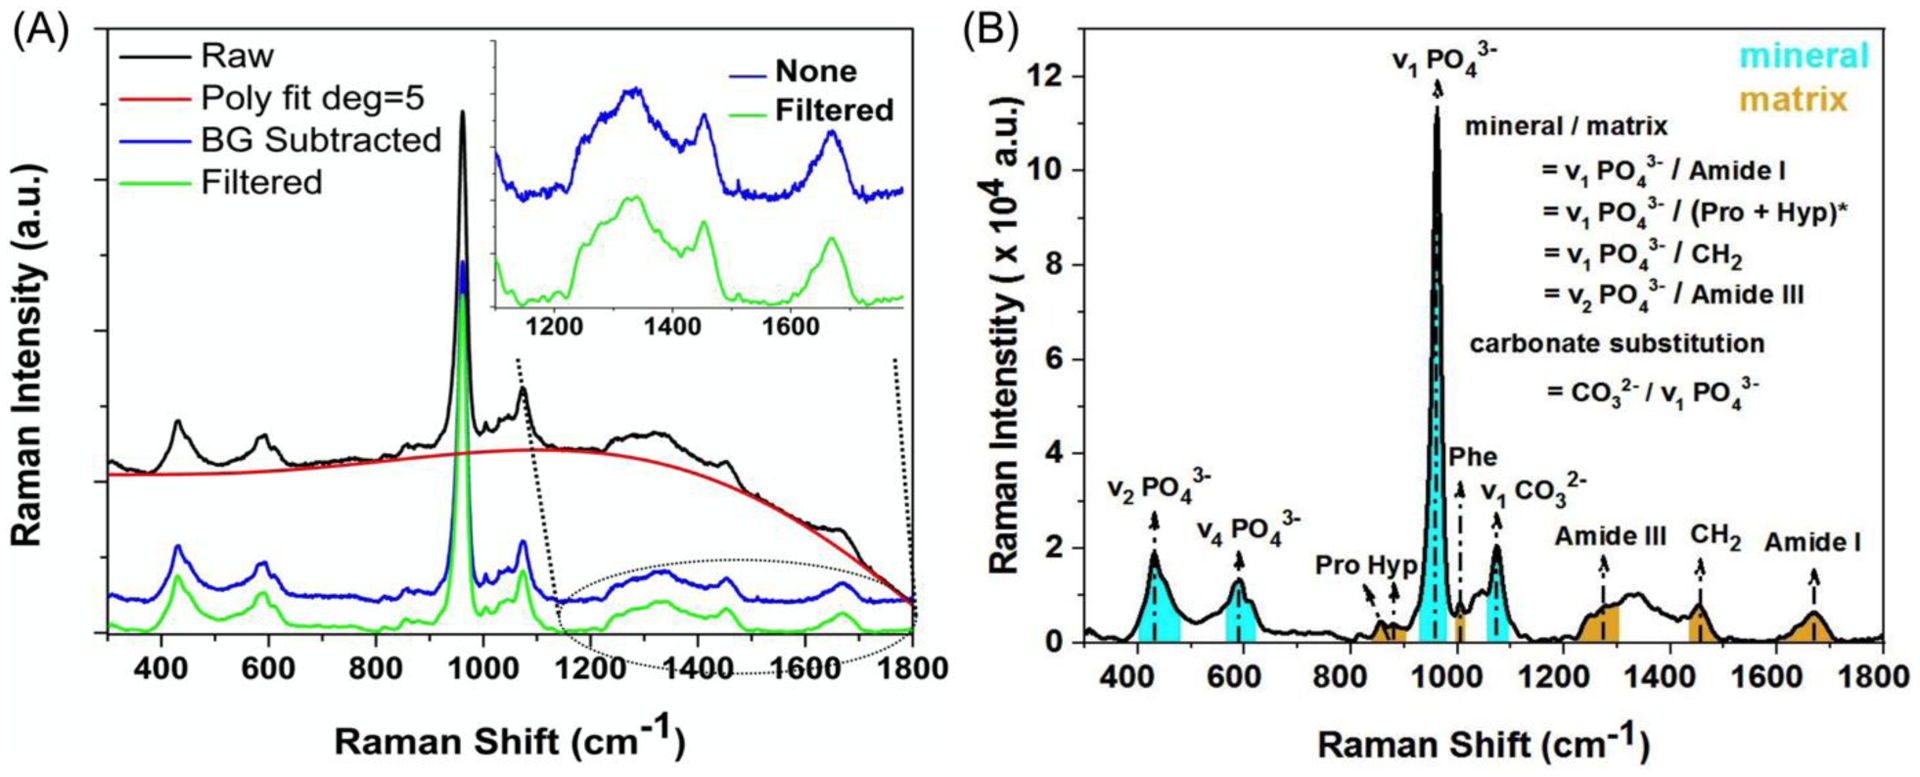
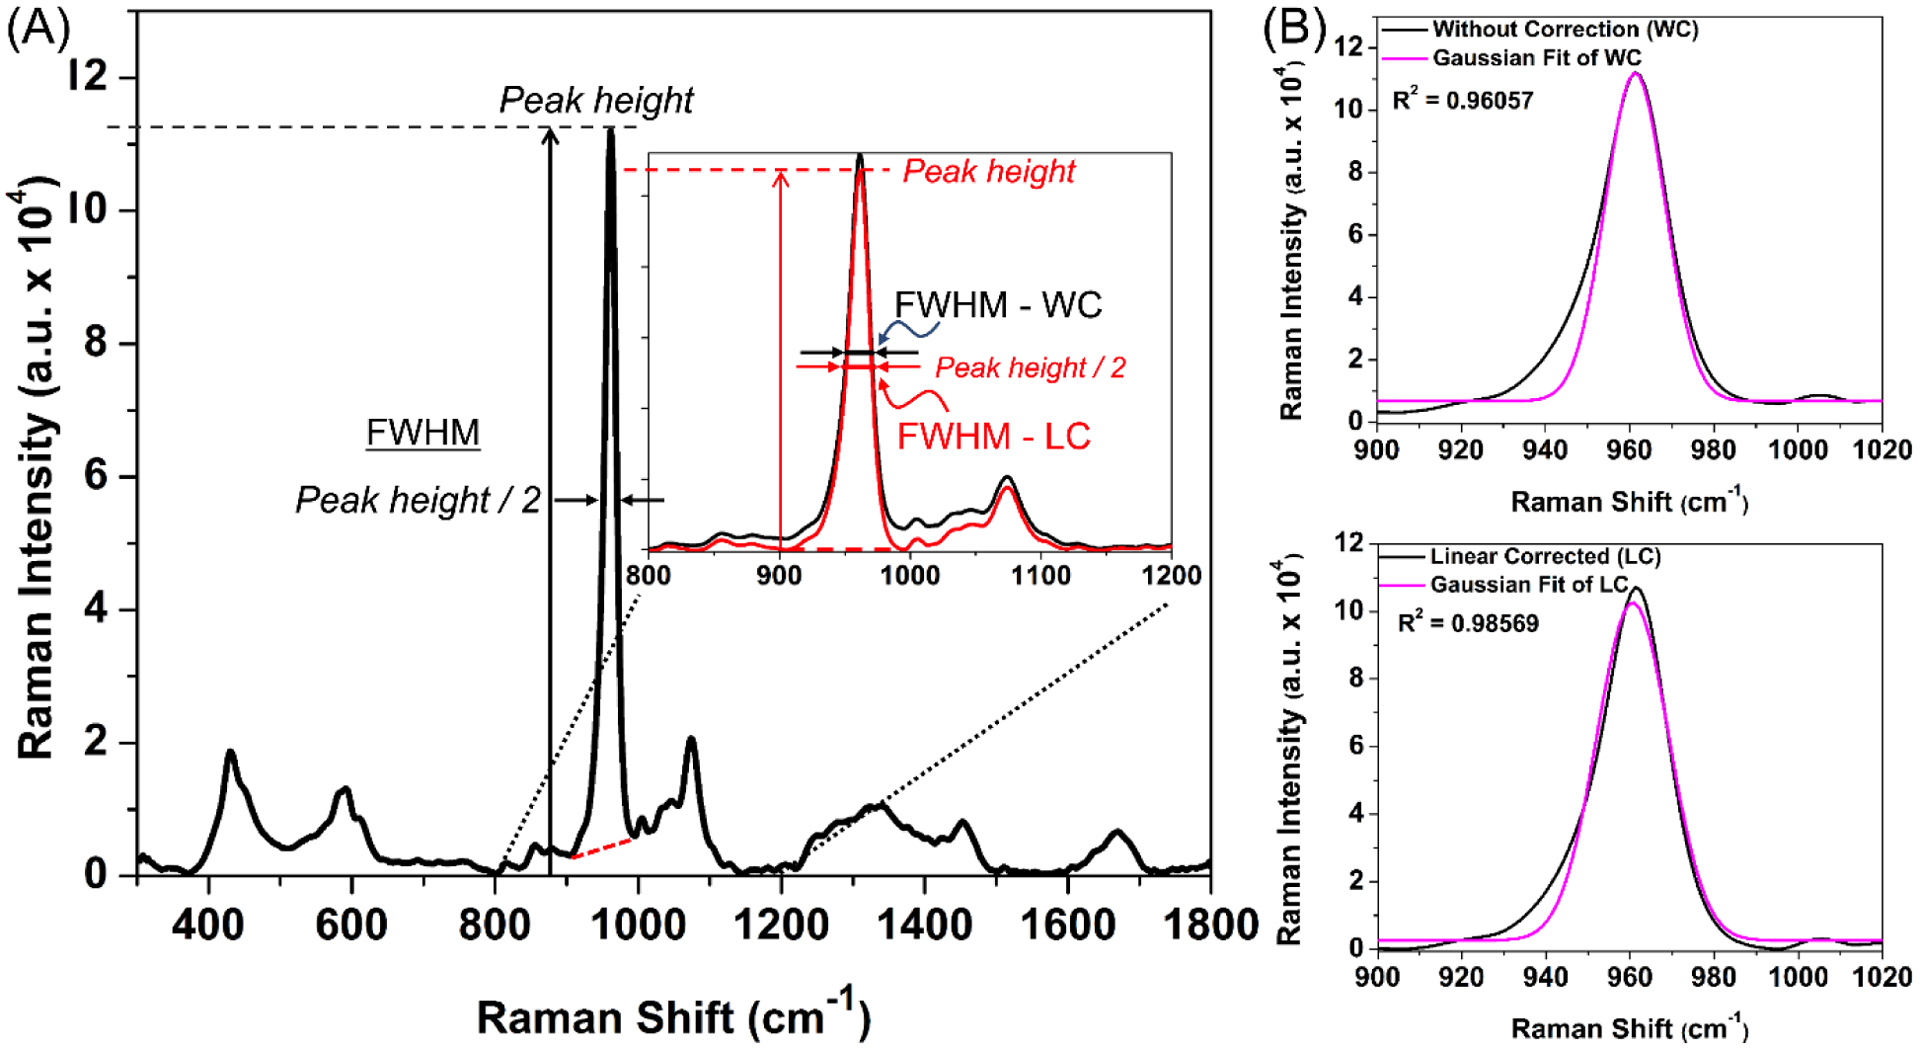
Raman spectroscopy (RS) is used to analyze the physiochemical properties of bone because it is non-destructive and requires minimal sample preparation. With over two decades of research involving measurements of mineral-to-matrix ratio, type-B carbonate substitution, crystallinity, and other compositional characteristics of the bone matrix by RS, there are multiple methods to acquire Raman signals from bone, to process those signals, and to determine peak ratios including sub-peak ratios as well as the full-width at half maximum of the most prominent Raman peak, which is nu1 phosphate (ν1PO4). Selecting which methods to use is not always clear. Herein, we describe the components of RS instruments and how they influence the quality of Raman spectra acquired from bone because signal-to-noise of the acquisition and the accompanying background fluorescence dictate the pre-processing of the Raman spectra. We also describe common methods and challenges in preparing acquired spectra for the determination of matrix properties of bone. This article also serves to provide guidance for the analysis of bone by RS with examples of how methods for pre-processing the Raman signals and for determining properties of bone composition affect RS sensitivity to potential differences between experimental groups. Attention is also given to deconvolution methods that are used to ascertain sub-peak ratios of the amide I band as a way to assess characteristics of collagen type I. We provide suggestions and recommendations on the application of RS to bone with the goal of improving reproducibility across studies and solidify RS as a valuable technique in the field of bone research.
Figures
Similar articles
-
Assessment of spatially offset Raman spectroscopy to detect differences in bone matrix quality.Spectrochim Acta A Mol Biomol Spectrosc. 2023 Dec 15;303:123240. doi: 10.1016/j.saa.2023.123240. Epub 2023 Aug 10. Spectrochim Acta A Mol Biomol Spectrosc. 2023. PMID: 37591015 Free PMC article.
-
Raman spectroscopic determination of bone matrix quantity and quality augments prediction of human cortical bone mechanical properties.J Biomech. 2021 Apr 15;119:110342. doi: 10.1016/j.jbiomech.2021.110342. Epub 2021 Feb 24. J Biomech. 2021. PMID: 33706105
-
Raman and Fourier Transform Infrared (FT-IR) Mineral to Matrix Ratios Correlate with Physical Chemical Properties of Model Compounds and Native Bone Tissue.Appl Spectrosc. 2017 Oct;71(10):2404-2410. doi: 10.1177/0003702817709286. Epub 2017 Aug 1. Appl Spectrosc. 2017. PMID: 28485618
-
Raman assessment of bone quality.Clin Orthop Relat Res. 2011 Aug;469(8):2160-9. doi: 10.1007/s11999-010-1692-y. Clin Orthop Relat Res. 2011. PMID: 21116756 Free PMC article. Review.
-
Raman and Fourier transform infrared imaging for characterization of bone material properties.Bone. 2020 Oct;139:115490. doi: 10.1016/j.bone.2020.115490. Epub 2020 Jun 20. Bone. 2020. PMID: 32569874 Review.
Cited by
-
Microbiome-induced Increases and Decreases in Bone Tissue Strength can be Initiated After Skeletal Maturity.bioRxiv [Preprint]. 2024 Jan 4:2024.01.03.574074. doi: 10.1101/2024.01.03.574074. bioRxiv. 2024. Update in: J Bone Miner Res. 2024 Oct 29;39(11):1621-1632. doi: 10.1093/jbmr/zjae157. PMID: 38260539 Free PMC article. Updated. Preprint.
-
Discrimination of ivory from extant and extinct elephant species using Raman spectroscopy: A potential non-destructive technique for combating illegal wildlife trade.PLoS One. 2024 Apr 24;19(4):e0299689. doi: 10.1371/journal.pone.0299689. eCollection 2024. PLoS One. 2024. PMID: 38656936 Free PMC article.
-
Assessment of glycosaminoglycan content in bone using Raman spectroscopy.Bone. 2023 Jun;171:116751. doi: 10.1016/j.bone.2023.116751. Epub 2023 Mar 29. Bone. 2023. PMID: 36996996 Free PMC article.
-
Short-term high-fat diet impacts bone material properties and metabolism for adult and aged C57BL/6JN mice.Commun Biol. 2025 Jun 3;8(1):850. doi: 10.1038/s42003-025-08263-w. Commun Biol. 2025. PMID: 40461602 Free PMC article.
-
Physicochemical understanding of biomineralization by molecular vibrational spectroscopy: From mechanism to nature.Exploration (Beijing). 2023 Jul 26;3(6):20230033. doi: 10.1002/EXP.20230033. eCollection 2023 Dec. Exploration (Beijing). 2023. PMID: 38264681 Free PMC article. Review.
References
-
- Walton AG, Deveney MJ and Koenig JL, Calc Tiss Res, 1970, 6, 162–167. - PubMed
-
- Dendramis AL, Poser JW and Schwinn EW, Biochim Biophys Acta, 1983, 742, 525–529. - PubMed
-
- Gevorkian BZ, Arnotskaia NE and Fedorova EN, Biofizika+, 1984, 29, 1046–52. - PubMed
-
- Ohsaki K, Yamashita S, Fujita A, Masuda Y, Ueda S, Sugiura T, Tamura K and Shibata A, Am J Otolaryng, 1988, 9, 117–126. - PubMed
-
- Carden A and Morris MD, J Biomed Opt, 2000, 5, 259–268. - PubMed
Publication types
MeSH terms
Substances
Grants and funding
LinkOut - more resources
Full Text Sources
Research Materials