. 2021 Nov 26;6(11):4234-4243.
doi: 10.1021/acssensors.1c01927. Epub 2021 Nov 17.

Three-Dimensional Tracking of Tethered Particles for Probing Nanometer-Scale Single-Molecule Dynamics Using a Plasmonic Microscope

Affiliations

Three-Dimensional Tracking of Tethered Particles for Probing Nanometer-Scale Single-Molecule Dynamics Using a Plasmonic Microscope

Guangzhong Ma et al. ACS Sens. .

Abstract

Three-dimensional (3D) tracking of surface-tethered single particles reveals the dynamics of the molecular tether. However, most 3D tracking techniques lack precision, especially in the axial direction, for measuring the dynamics of biomolecules with a spatial scale of several nanometers. Here, we present a plasmonic imaging technique that can track the motion of ∼100 tethered particles in 3D simultaneously with sub-nanometer axial precision and single-digit nanometer lateral precision at millisecond time resolution. By tracking the 3D coordinates of a tethered particle with high spatial resolution, we are able to determine the dynamics of single short DNA and study its interaction with enzymes. We further show that the particle motion pattern can be used to identify specific and nonspecific interactions in immunoassays. We anticipate that our 3D tracking technique can contribute to the understanding of molecular dynamics and interactions at the single-molecule level.

Keywords: DNA dynamics; SPR imaging; digital ELISA; enzyme dynamics; single-particle 3D tracking.


Figures

Figure 1.
Figure 1.. 3D tracking of particles using surface plasmon resonance microscopy.
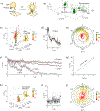
(a) Experimental setup. Particles are tethered to a gold surface by single-molecule tethers. Incident light is directed to the surface via a microscope objective to excite SPR. The plasmonic images of the particles are collected by the camera in real-time. (b) A SPR image showing 1 μm PS particles tethered by 16 nm dsDNA. The inset is transmitted image of the squared region. (c) Intensity profiles along x and y directions of the SPR pattern of a 1 μm PS particle shown in d (blue dashed lines). The x profile (top) is fitted with Gaussian distribution and y profile (bottom) is fitted with a right-skewed Gaussian distribution. (d) Localizing the particle by finding the local maxima. The left panel shows an image of a 1 μm PS particle. The center region of the pattern (blue square) is presented in 3D (right), where the z axis is image intensity. The local maximum is found (blue dot) and then used for particle localization by TrackMate. (e) Localization precision of SPR tracking. Precision in xy and z directions are determined to be ~2 nm and 0.44 nm respectively by tracking the relative position between two immobilized particles. The standard deviation (Std) of relative position fluctuation is defined as localization precision. (f) The motion of a streptavidin coated 1 μm PS particle near the surface revealed by SPR 3D tracking. The gold film surface was passivated with MT(PEG)4 to reduce non-specific absorption. The particle showed a c-shaped pattern caused by interaction with the surface followed by random patterns due to Brownian motion. The shadow on xy plane is projection of the 3D pattern. The particle motion was tracked for 8.1 s at 100 fps. (g) Simultaneous 2D tracking via transmitted light. The xy projection of SPR 3D tracking (top panel) and transmitted light tracking (bottom panel) of the same particle show similar patterns. (h) Evaluation of tracking accuracy by comparing the 2D patterns. The x (top panel) or y (bottom panel) coordinates from SPR tracking and transmitted tracking are plotted in the same graph, and both have a correlation factor R2 > 0.997. The fitted slope (red line) in x and y are 0.908 and 1.17, respectively.
Figure 2.
Figure 2.. The motion of particle tethered by different number of DNA molecules.
(a) The motion of a single DNA tethered particle showing a dome pattern in space. The xy coordinates represent the centroid of the particle, and z coordinate represents the distance from the bottom of the particle to the surface. For clarity, the pattern is rotated 90° and 180° in the right panels. (b) Projection of the 3D pattern onto xy plane. (c) Projection of the 3D pattern onto z-axis. (d) The motion of multiple DNA tethered particle shows a section of dome due to the restriction from additional tethers. The right panels show 90° and 180° rotation of the pattern. (e) Projection of the pattern onto xy plane. (f) Projection of the pattern onto z-axis. (g) The motion of many DNA tethered particle shows that the particle is confined within a small region. The right panels show 90° and 180° rotation of the pattern. (h) and (i) show the projection of the pattern onto xy plane and z-axis, respectively. The tracking frame rate for a, d, and g is 100 fps. (j) Schematic showing a particle with radius of a tethered by a DNA with length of L. The dome (red solid line and shadow), which is the largest area that the tethered particle can explore, is a section of sphere with radius of a + L. (k) Distribution of restriction factor R obtained from 121 tethered particles. The tether number decreases from many tethers to a single tether as R increases from 0 to 1.
Figure 3.
Figure 3.. Tracking the interaction between RecBCD and dsDNA.
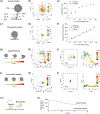
(a) dsDNA is anchored on the gold film, and RecBCD is modified on the surface of a 100 nm gold nanoparticle (AuNP), which unwinds the dsDNA in the presence of ATP. The remaining length of double strand (L) and the rotation angle of the RecBCD or AuNP (θ) are obtained by tracking the 3D coordinates of the AuNP. (b) Tracking the motion of a RecBCD coated AuNP near the surface. The trajectory of the particle shows Brownian motion and interaction with the surface. (c) Zoom-in of the interaction event shows the motion of AuNP was confined within a nanometer-scaled domain with decreasing L and rotating θ, which indicates the RecBCD was unwinding the DNA. (d) The change of L is obtained from the 3D coordinates in c, where the dots and black curve are raw data and 20 points-smoothed data, respectively. The DNA unwinding rate was determined to be 1.9 bps/s by linear fitting of the curve (red curve). (e) Polar graph showing the rotation of RecBCD upon unwinding. The dashed line marks a possible route of rotation. (f) Unwinding rate of 4 individual DNA molecules. For clarity, the beginnings of the curves are aligned at 16 nm. A total of N = 14 DNA molecules were measured, the mean rate was 6.8 bps/s with a standard deviation of 6.5 bps/s. (g) L and θ (converted to turns) obtained from 5 DNA molecules. The relation between L and θ were determined by linear fitting of the data, which was 3.7 nm/turn. (h) Control experiment without DNA. The RecBCD coated AuNP bound to the surface via non-specific interaction which showed random fluctuations. (i) L change in non-specific interaction, which was calculated using the coordinates in h. The dots and curve are raw data and 20-point smoothed data respectively. (j) Polar graph showing θ change in non-specific interaction.
Figure 4.
Figure 4.. Particle motion reveals the specific binding and non-specific binding of troponin T.
(a) Specific binding of troponin T (TnT) in a sandwich immunoassay. TnT is captured by the capture antibody (Cap Ab) immobilized on the surface. The detection antibody (Det Ab) binds to the captured TnT with the Fab domain and captures the 1 μm streptavidin (Strep) coated PS particle via the biotin moiety on the Fc domain. Note that the schematic is not drawn to scale. (b) 3D motion pattern of a representative particle tethered by the antibody-TnT-antibody complex. (c) Non-specific binding in the absence of TnT. (d) 3D pattern of a non-specifically bound particle showing restricted motion. (e) Counts of particles bound to the surface at different TnT concentrations. The 0 ng/L sample was measured in 10 times diluted PBS, and the other samples were measured in serum. (f) Dose-response curve obtained by counting particles that are specifically bound to the surface. The solid curve is linear fitting of the data, and the dashed line marks the detection limit (0.486 ng/L). The error bars in (e) and (f) represent standard deviation determined from 3 imaging regions on the same sensor surface. The particles used in (e) and (f) were 150 nm streptavidin coated gold nanoparticles. (g) The specific binding is flexible and can be modulated by a laminar flow. (h) The motion pattern of a specifically bound particle under four different flow rates or forces. (i) Projection of the pattern in h on xy plane and z axis. (j) The non-specific bond is less flexible and cannot be stretched by the flow. (k) Motion pattern of the non-specifically bound particle in flow. (l) Projection of the pattern in k on xy plane and z axis. (m) Further increasing the flow rate ruptures the tether. Tethers with specific interactions are more difficult to break than those with non-specific interactions. (n) Non-specifically bound particles are almost removed at 10 pN, whereas over 50% specifically bound particles remain on the surface at 30 pN. The particles used here were 150 nm gold nanoparticles and the surface was glass.

Similar articles

Cited by

References

    1. Wang Q; Moerner WE, Single-molecule motions enable direct visualization of biomolecular interactions in solution. Nature Methods 2014, 11 (5), 555–558. - PubMed
    1. Wang H; Tang Z; Wang Y; Ma G; Tao N, Probing Single Molecule Binding and Free Energy Profile with Plasmonic Imaging of Nanoparticles. Journal of the American Chemical Society 2019, 141 (40), 16071–16078. - PubMed
    1. Gahlmann A; Moerner WE, Exploring bacterial cell biology with single-molecule tracking and super-resolution imaging. Nature Reviews Microbiology 2014, 12 (1), 9–22. - PMC - PubMed
    1. Ando J; Nakamura A; Visootsat A; Yamamoto M; Song C; Murata K; Iino R, Single-Nanoparticle Tracking with Angstrom Localization Precision and Microsecond Time Resolution. Biophysical Journal 2018, 115 (12), 2413–2427. - PMC - PubMed
    1. Bujak Ł; Piliarik M. In Interferometric scattering (iSCAT) microscopy for high fidelity tracking at microseconds timescales, Nanoimaging and Nanospectroscopy VI, International Society for Optics and Photonics: 2018; p 1072615.

Publication types