. 2021 Nov 17:10:e71575.
doi: 10.7554/eLife.71575.

Control of protein synthesis and memory by GluN3A-NMDA receptors through inhibition of GIT1/mTORC1 assembly

Affiliations

Control of protein synthesis and memory by GluN3A-NMDA receptors through inhibition of GIT1/mTORC1 assembly

María J Conde-Dusman et al. Elife. .

Abstract

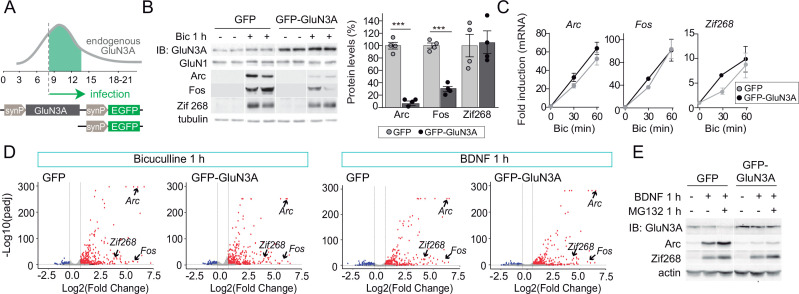
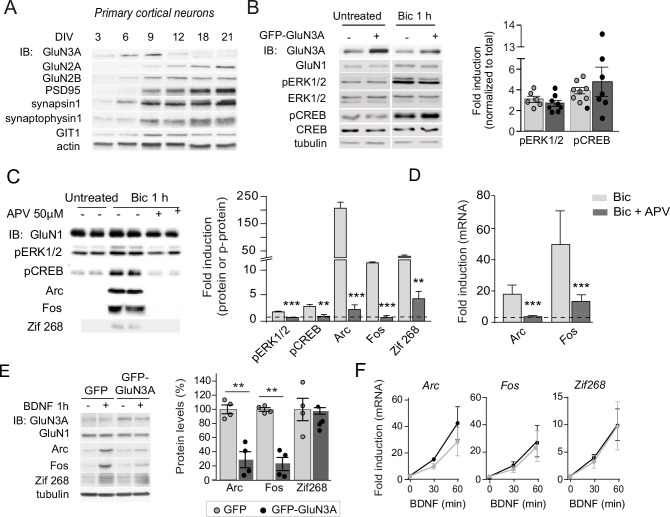
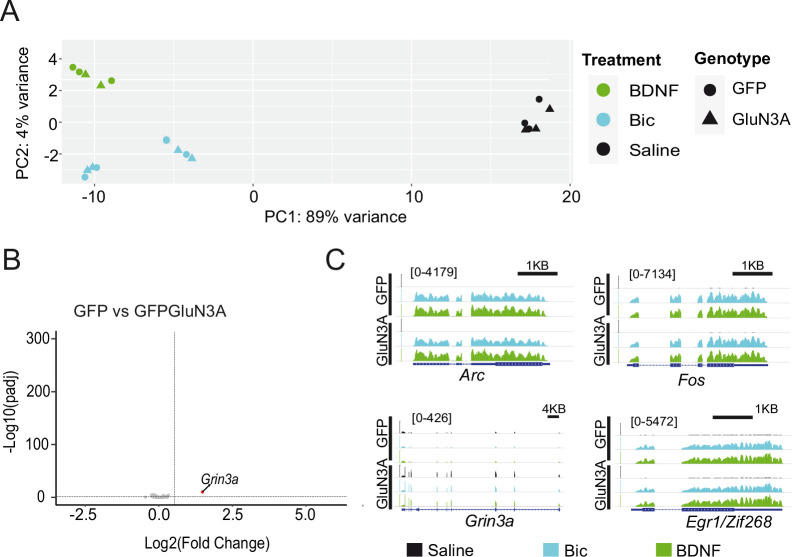
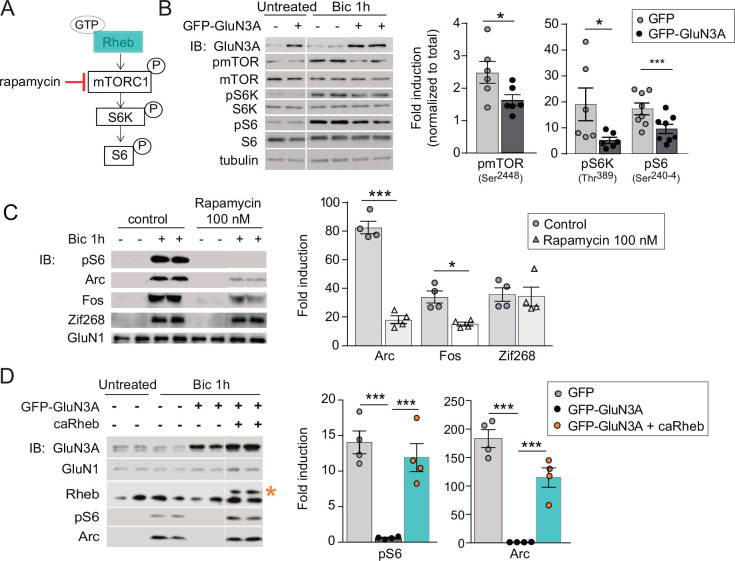
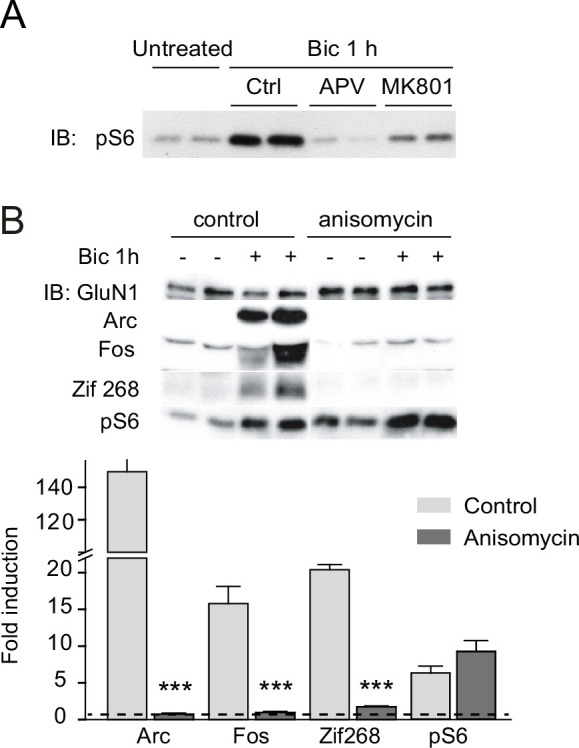
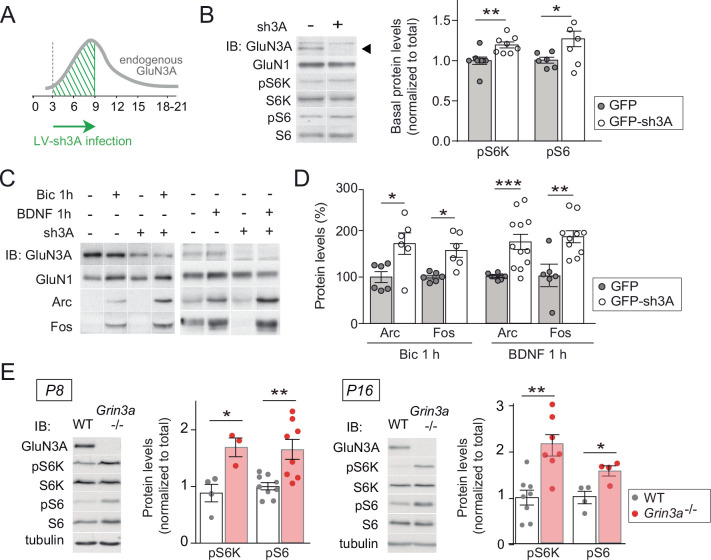
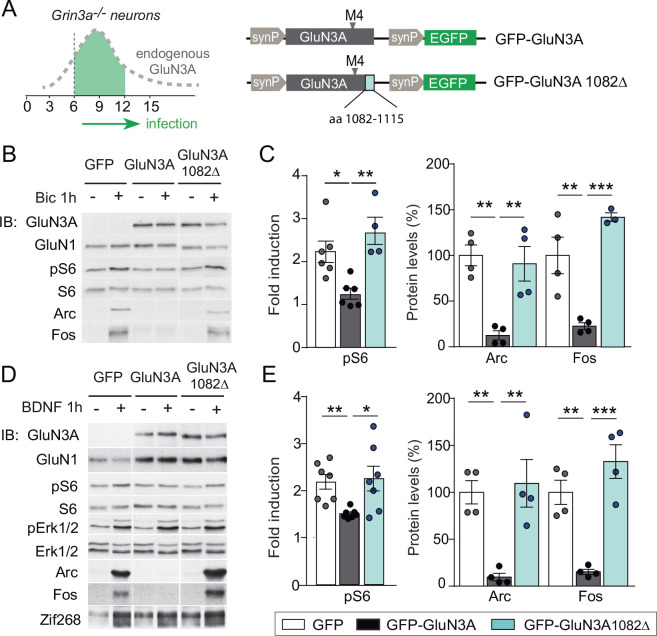
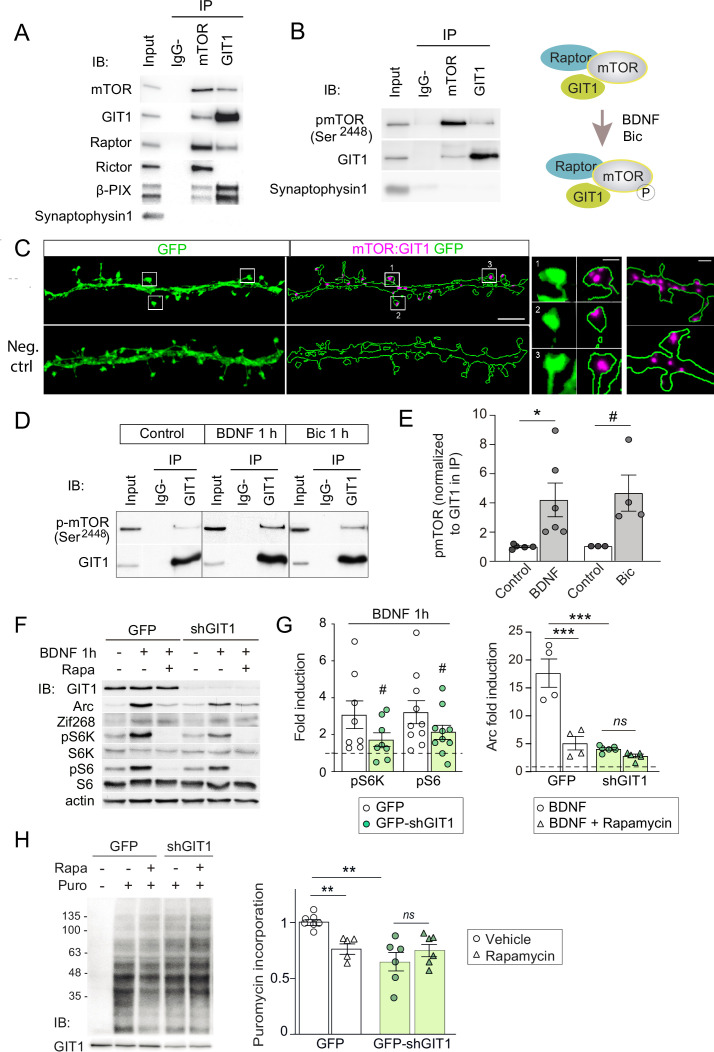
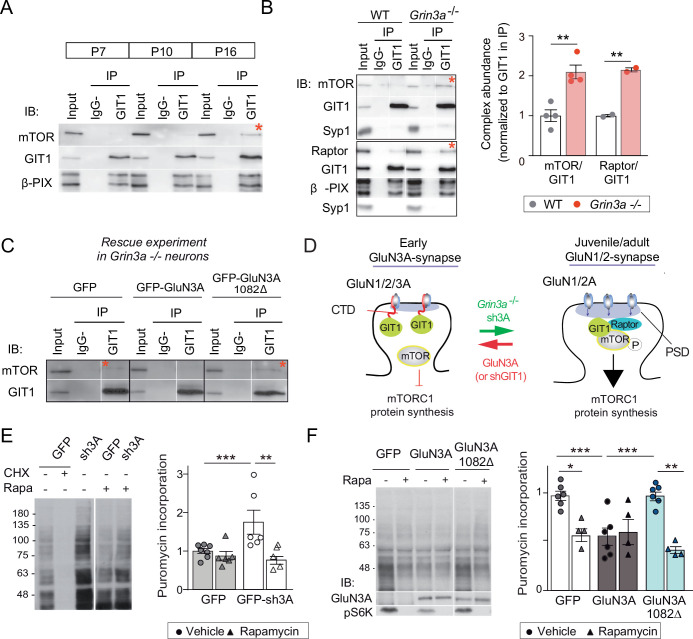
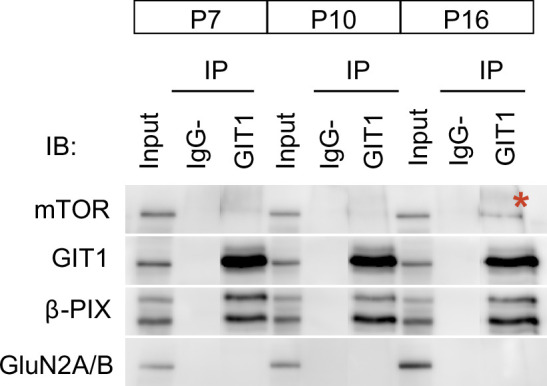
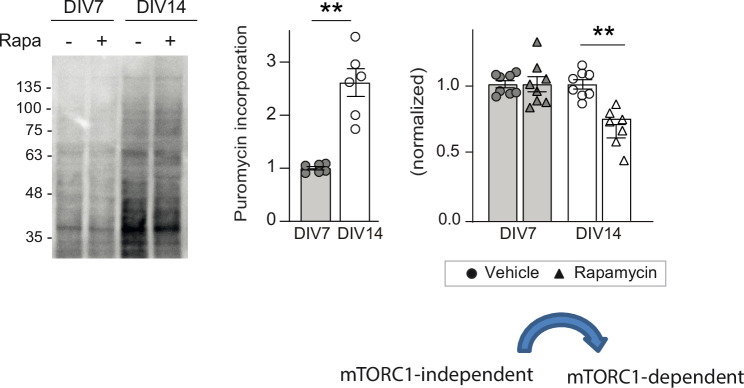
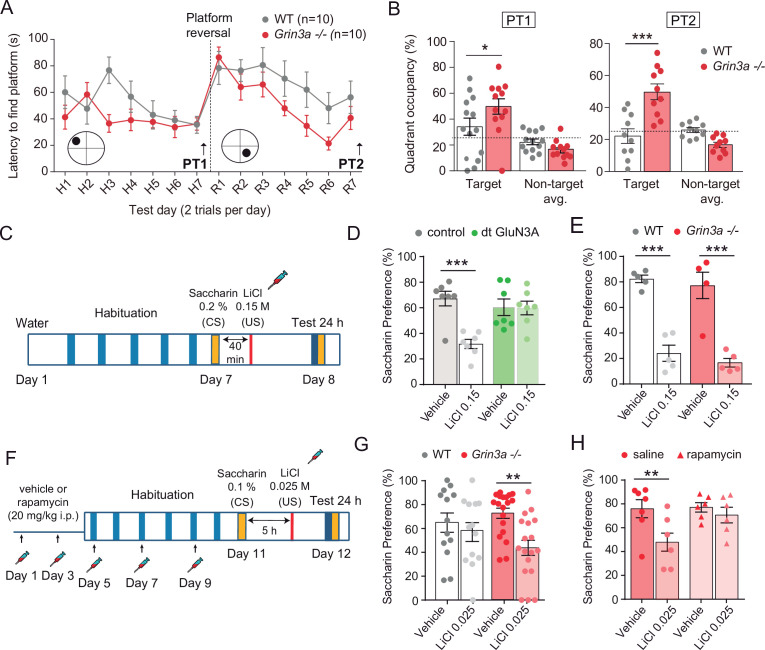
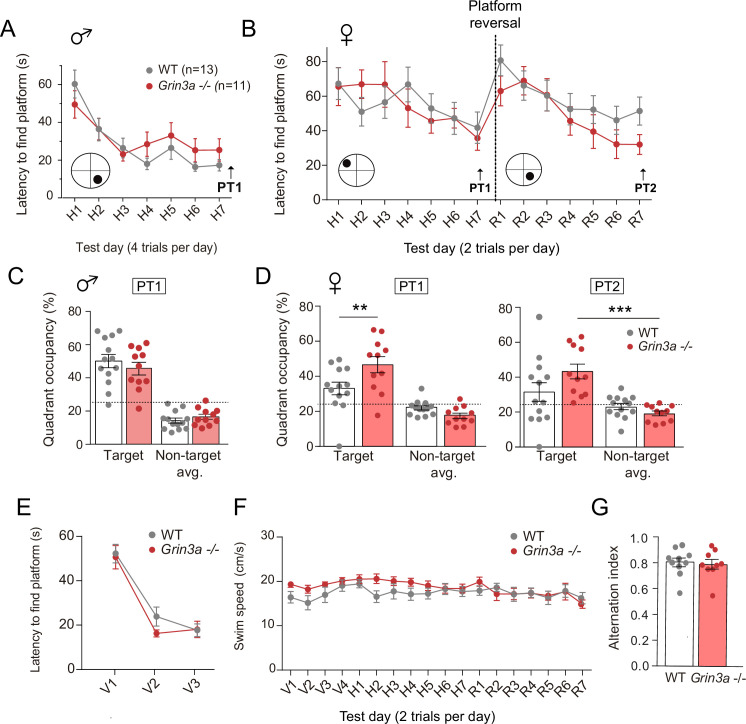
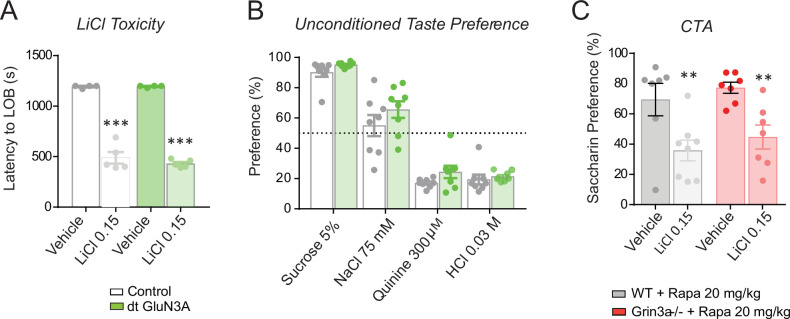
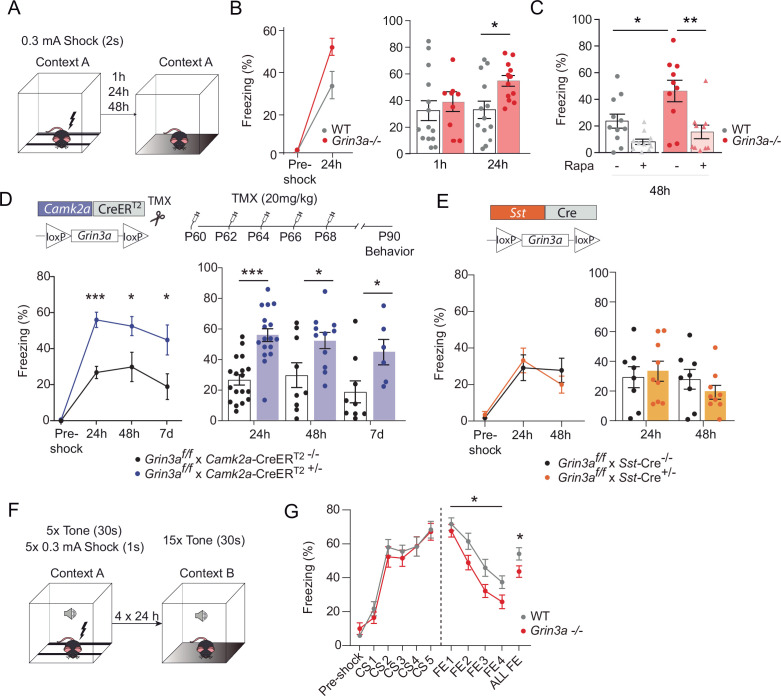
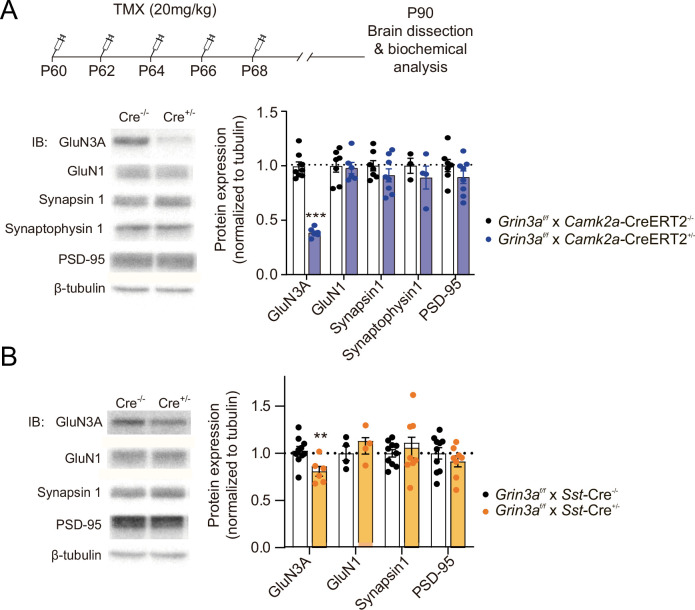
De novo protein synthesis is required for synapse modifications underlying stable memory encoding. Yet neurons are highly compartmentalized cells and how protein synthesis can be regulated at the synapse level is unknown. Here, we characterize neuronal signaling complexes formed by the postsynaptic scaffold GIT1, the mechanistic target of rapamycin (mTOR) kinase, and Raptor that couple synaptic stimuli to mTOR-dependent protein synthesis; and identify NMDA receptors containing GluN3A subunits as key negative regulators of GIT1 binding to mTOR. Disruption of GIT1/mTOR complexes by enhancing GluN3A expression or silencing GIT1 inhibits synaptic mTOR activation and restricts the mTOR-dependent translation of specific activity-regulated mRNAs. Conversely, GluN3A removal enables complex formation, potentiates mTOR-dependent protein synthesis, and facilitates the consolidation of associative and spatial memories in mice. The memory enhancement becomes evident with light or spaced training, can be achieved by selectively deleting GluN3A from excitatory neurons during adulthood, and does not compromise other aspects of cognition such as memory flexibility or extinction. Our findings provide mechanistic insight into synaptic translational control and reveal a potentially selective target for cognitive enhancement.

Keywords: BDNF; GIT1; GluN3A; NMDA receptor; cell biology; mTOR; memory; mouse; protein synthesis; rat; synapse.


Conflict of interest statement

MC, PD, ÓE, LR, CG, TG, VB, EV, RA, SN, AB, PP, JW, FG, ST, IP No competing interests declared

Figures

Figure 1.
Figure 1.. GluN3A inhibits the activity-dependent induction of a subset of immediate-early genes (IEGs).
(A) Timeline of endogenous GluN3A expression and downregulation and of lentiviral infections. Rat cortical neurons in primary culture were infected on days in vitro (DIV) 9 with lentiviruses where Green fluorescent protein (GFP) or GluN3A and GFP (GFP-GluN3A) expression is driven by the human synapsin 1 promoter (synP). (B, C) DIV14 neurons were treated with bicuculline (50 μM, 1 hr) and matching samples collected for immunoblot and mRNA analyses (n = 4 from two independent cultures; ***p < 0.001, two-tailed unpaired t-test). (B) Left, representative western blots show that GluN3A inhibits the induction of the IEGs Arc and Fos but not Zif268. Right, signal intensities of indicated proteins as percentage of stimulated GFP-infected neurons. (C) quantitative Reverse Transcription-Polymerase Chain Reaction (qRT-PCR) analysis of IEG mRNA induction. Plotted values are fold-induction relative to non-stimulated neurons. (D) Volcano plots presenting the RNAseq-based differential expression analysis in DIV14 neurons treated with bicuculline or Brain-derived neurotrophic factor (BDNF) for 1 hr (n = 2–4 from two independent cultures). (E) DIV14 neurons were treated with MG132 (30 μM). A representative western blot probed with the indicated antibodies is shown. In immunoblot analyses, tubulin or actin was used as a loading control and GluN1 as a measure of potential effects of GluN3A on overall NMDAR numbers. Histograms in this and subsequent figures are mean ± standard error of the mean (SEM).
Figure 1—figure supplement 1.
Figure 1—figure supplement 1.. Selective versus global effects of GluN3A expression and general NMDAR blockade on activity-dependent signaling.
(A) Immunoblot (IB) analysis of the time-course of expression of NMDAR subunits and a repertoire of synaptic proteins in cultured cortical neurons. (B) Immunoblot analysis of extracellular signal-regulated kinase (ERK1/2) and cAMP Response Element Binding Protein (CREB) phosphorylation in whole-cell lysates of days in vitro (DIV) 14 cortical neurons treated with bicuculline for 1 hr. Left, representative western blots probed with the indicated antibodies. Right, fold-induction by bicuculline of phosphorylated proteins normalized to their total levels (n = 6–8 from three to four independent cultures). (C) Total lysates from cortical neurons pretreated with D-2-amino-5-phosphonovaleric acid (APV) (50 μM, 30 min) before stimulation with bicuculline (50 μM, 1 hr) were immunoblotted with the indicated antibodies. Quantification showed a general blockade of activity dependent by APV (n = 4–6 samples from two to three independent cultures, **p < 0.01, ***p < 0.001 analysis of variance (ANOVA) followed by Tukey’s test). (D) APV blocked the increase in Arc and Fos mRNA induced by bicuculline (n = 6–10 samples from three independent cultures, ***p < 0.001 one-way ANOVA followed by Tukey’s test). Data are expressed as fold-induction of non-stimulated neurons. (E, F) Analogous experiments to the ones in Figure 1B and C were conducted upon stimulation with BDNF (100 ng/ml, 1 hr).
Figure 1—figure supplement 2.
Figure 1—figure supplement 2.. RNAseq analysis of activity-dependent gene expression.
(A) Principal component analysis plot representing all RNAseq samples. (B) Volcano plot from RNAseq analysisof gene expression in untreated days in vitro (DIV) 14 neurons infected with GFP or GFP-GluN3A. (C) Integrative Genome Viewer tracks for RNAseq signal at representative genes in the different conditions. The immediate-early genes (IEGs) Arc, Fos, and Egr1 are similarly induced by bicuculline (Bic) and BDNF treatments in GFP and GFP-GluN3A-infected cultures. As expected, levels of Grin3a are increased in GFP-GluN3A- compared to GFP-infected cultures.
Figure 2.
Figure 2.. GluN3A inhibits the activation of mTORC1 signaling by synaptic stimuli.
(A) Schematic of the mTORC1 signaling pathway. (B) Left, representative western blots of primary rat cortical neurons infected with GFP and GFP-GluN3A (days in vitro [DIV] 9) and treated with bicuculline at DIV14. Right, fold-induction of phosphorylated mTOR, S6 kinase (S6K), and S6 normalized to total protein (n = 6–8 from three to four independent cultures; *p < 0.05, ***p < 0.001, two-tailed paired t-test). (C) mTOR is required for activity-dependent induction of Arc and Fos but not Zif268. Left, representative western blots of DIV14 neurons stimulated with bicuculline after preincubation with rapamycin (100 nM, 1 hr before and during bicuculline treatment). Right, fold-induction of immediate-early genes (IEGs) in response to bicuculline (n = 4 from two independent cultures; *p < 0.05, ***p < 0.001, two-tailed paired t-test). (D) Reactivation of mTOR in GFP-GluN3A-infected neurons by adeno-associated virus (AAV) driven constitutively active Rheb (caRheb) rescues Arc induction. Left, representative western blots of neurons infected with lentiviral GFP-GluN3A and AAV-caRheb and treated with bicuculline. Right, fold-induction by bicuculline of pS6 and Arc in the indicated conditions (n = 4 from two independent cultures; ***p < 0.001, one-way analysis of variance [ANOVA] followed by Tukey’s test).
Figure 2—figure supplement 1.
Figure 2—figure supplement 1.. General inhibition of the activity induction of immediate-early genes (IEGs) by anisomycin.
(A) Immunoblot analysis of the phosphorylation status of the mTOR downstream effector S6 in lysates from days in vitro (DIV) 14 cortical neurons stimulated with bicuculline in the absence (Ctrl) or presence of D-2-amino-5-phosphonovaleric acid (APV) (50 μM, 30 min) or MK801 (10 μM, 1 hr). (B) General inhibition of protein synthesis blocks activity induction of Arc, Fos, and Zif268. Whole lysates from DIV14 cortical neurons either untreated or treated with bicuculline (50 μM, 1 hr) and anisomycin (0.8 μM, 1 hr) were immunoblotted with the indicated antibodies. Left, representative immunoblots and right, quantifications, show a general blockade of IEGs tested by anisomycin. Data are expressed as fold-induction of nontreated neurons (n = 3–4 independent cultures, ***p < 0.001 analysis of variance [ANOVA] followed by Tukey’s test).
Figure 3.
Figure 3.. GluN3A deletion potentiates synaptic mTORC1 signaling.
(A) Primary rat cortical neurons were infected on days in vitro (DIV) 3 with lentiviruses expressing GFP alone or along with a small hairpin RNA (shRNA) against GluN3A (GFP-sh3A) and collected at DIV7–9, when GluN3A expression is maximal. (B) Representative blots and quantification of phosphorylated S6 kinase (S6K) and S6 normalized to total protein (n = 6–8 from three to four independent cultures; *p < 0.05, **p < 0.01 two-tailed paired t-test). Arrow marks specific GluN3A band. (C, D) Representative western blots and quantification of immediate-early gene (IEG) induction by bicuculline or BDNF (n = 6–12 from three independent cultures; *p < 0.05, **p < 0.01, ***p < 0.001, two-tailed paired t-test). Data plotted as percentage of stimulated control GFP-infected neurons. (E) Immunoblots and quantification of S6K and S6 phosphorylation in lysates from wild-type (WT) and Grin3a−/− hippocampi (n = 4–8 mice; *p < 0.05, **p < 0.01, two-tailed unpaired t-test).
Figure 4.
Figure 4.. mTORC1 inhibition is mediated by GluN3A C-terminal domain interactions.
(A) Cortical neurons from Grin3a−/− mice were infected on days in vitro (DIV) 6 with lentiviruses expressing GFP, GFP-GluN3A, or GFP-GluN3A1082∆, and stimulated with bicuculline or BDNF at DIV12. (B, D) Representative western blots of lysates from bicuculline or BDNF-treated neurons probed for the indicated antibodies. (C, E) Induction of phosphorylated S6 (normalized to total levels), Arc and Fos by bicuculline or BDNF (n = 3–7 from two to four independent cultures, *p < 0.05, **p < 0.01, ***p < 0.001 analysis of variance [ANOVA] followed by Tukey’s test).
Figure 4—figure supplement 1.
Figure 4—figure supplement 1.. Electrophysiological properties of recombinant NMDA and excitatory glycine receptors containing full-length or truncated GluN3A.
(A) Left, representative steady-state glutamate-evoked ramp currents obtained with 2 mM (black) and 10 mM (red) extracellular Ca2+ for HEK293 cells expressing GluN1A/GluN2A alone, or with either GFP-GluN3A or GFP-GluN3A1082Δ. Insets show currents on expanded scale to highlight the Erev. Right, summary graph of the ΔErev obtained from multiple experiments is shown on right (n = 10–11, **p < 0.01, one-way analysis of variance [ANOVA] followed by Bonferroni post hoc test). (B) Summary graph depicting current density from HEK293 cells expressing GluN1A/GluN2A alone, or with either GFP-GluN3A or GFP-GluN3A1082Δ (*p < 0.05 compared to GluN1A/GluN2A, one-way analysis of variance (ANOVA) followed by Bonferroni post hoc test). (C) Top, responses to glycine of HEK293 cells expressing GluN1/GluN3A receptors in the absence or presence of CGP-78608 (500  nM). Bottom, quantification of fold peak current potentiation by CGP-78608 for GluN1/GluN3A and GluN1/GluN3A1082Δ receptors (n = 3–11).
Figure 5.
Figure 5.. GIT1/mechanistic target of rapamycin (mTOR)/Raptor complexes couple synaptic activation to mTORC1-dependent protein synthesis.
(A, B) Protein extracts from P16 mouse hippocampus were solubilized with 0.3 % CHAPS buffer, incubated with antibodies against mTOR or GIT1 (IP), and immunoprecipitated proteins analysed by immunoblot (IB). Input: 10 % of lysate used for immunoprecipitation. IgG−: no antibody control. A cartoon of the interactions and regulation by activity (see panel D) is shown. (C) Representative images of proximity ligation assay for rat mTOR: GIT1 (magenta) in days in vitro (DIV) 17 rat hippocampal neurons transfected with GFP (green) to visualize dendritic morphology (scale bar, 5 μm). High magnification examples of spines and dendrites (scale bars, 0.5 and 1 μm) are shown. As negative control, only mTOR primary antibody was used. (D, E) Rat cortical neurons stimulated with BDNF or bicuculline were solubilized with 0.3 % CHAPS and incubated with GIT1 antibody (IP). Representative immunoblots (D) and quantification of mTOR phosphorylation in GIT1 immunoprecipitates (E) are shown (n = 3–6 from three independent cultures; *p < 0.05, # = 0.06, two-tailed unpaired t-test). (F–H) Primary mouse cortical neurons were infected with lentiviruses expressing GFP or GFP-shGIT1 on DIV7. mTOR responses to BDNF (F, G) and puromycin incorporation (H) in the presence or absence of 100 nM rapamycin were analyzed at DIV14. Quantification of phosphorylated S6K and S6 and Arc induction (#pS6K: p = 0.13, #pS6: p = 0.05, two-tailed paired; ***p < 0.001, two-way analysis of variance [ANOVA] followed by Tukey’s test) (G) and puromycin levels normalized to Ponceau S (n = 5–7 from four independent cultures, **p < 0.01, two-way ANOVA followed by Tukey’s test) (H) are shown.
Figure 6.
Figure 6.. GluN3A/GIT1 interactions control the age-dependent onset of mTORC1-dependent protein synthesis.
(A) Hippocampi from P7, P10, and P16 wild-type mice were lysed, immunoprecipitated with GIT1 antibody and probed for the indicated antibodies. Input: 10 % of the lysate used for immunoprecipitation. IgG−: negative control without antibody. Red asterisks here and other panels indicate mechanistic target of rapamycin (mTOR)- and Raptor bound to GIT1. (B) GIT1/mTORC1 complex formation is enhanced in P10 Grin3a−/− hippocampus. Representative blots of GIT1 immunoprecipitates and quantifications are shown (n = 2–4 mice; **p < 0.01 unpaired t-test). Bound mTOR and Raptor are normalized to immunoprecipitated GIT1. Syp1: synaptophysin 1. (C) Grin3a−/− cortical neurons infected with GFP, GFP-GluN3A, or GFP-GluN3A1082Δ were solubilized and GIT1 immunoprecipitates blotted as indicated (IB). (D) GIT1/GluN3A control mTORC1 translation. Left: at early postnatal stages, immature synapses express GluN3A-NMDARs, which bind the postsynaptic scaffold GIT1 via their C-terminal tail preventing the nucleation of GIT1/mTORC1 and the mTORC1-mediated synthesis of plasticity proteins. Right: at juvenile/adult stages, GluN3A downregulation enables GIT1/mTOR/Raptor complex assembly and primes synapses for mTORC1 translation of mRNAs involved in synapse and memory consolidation. The genetic manipulations shown here to alter the age-dependent switch from mTORC1-independent to mTORC1-dependent modes of translation are indicated. Note that GluN3A expression is retained by subsets of synapses in adult brains and might play roles in selecting synapses that will be recruited to stably encode memory traces (see Discussion). (E) Mouse cortical neurons were infected with lentiviruses expressing GFP or GFP-sh3A on days in vitro (DIV) 3 and protein synthesis analyzed at DIV7–9. Representative blots and quantification of puromycin incorporation in infected neurons treated with rapamycin (100 nM), cycloheximide (CHX, 25 μM), or vehicle. (F) Grin3a−/− cortical neurons were infected with GFP, GFP-GluN3A, or GFP-GluN3A1082∆ lentiviruses, and protein synthesis analyzed at DIV12. GluN3A expression and mTOR activation were monitored with the indicated antibodies (IB). In panels D–E, n = 4–7 from three to four independent cultures (*p < 0.05, **p < 0.01, ***p < 0.001, two-way analysis of variance [ANOVA] followed by Tukey’s test).
Figure 6—figure supplement 1.
Figure 6—figure supplement 1.. Postnatal regulation of GIT1/mTORC1 complexes in mouse somatosensory cortex.
Somatosensory cortices from P7, P10, and P16 wild-type mice were lysed, immunoprecipitated with GIT1 antibody and probed for the indicated antibodies. Input: 10 % of the lysate used for immunoprecipitation. IgG− refers to a negative control without antibody. Red asterisk indicates mechanistic target of rapamycin (mTOR)-bound GIT1.
Figure 6—figure supplement 2.
Figure 6—figure supplement 2.. Age-dependent emergence of mTORC1-dependent protein synthesis in cultured rat cortical neurons.
Representative blots and quantification of puromycin incorporation in the presence or absence of 100 nM rapamycin in wild-type days in vitro (DIV) 7 and DIV14 neurons. Puromycin levels were normalized to Ponceau S staining (n = 6–8 samples from three to four independent cultures; **p < 0.01, followed by Tukey’s test).
Figure 7.
Figure 7.. GluN3A deletion facilitates spatial and associative learning.
(A) Escape latencies of male wild-type (WT) and Grin3a−/− mice on a weak version of the Morris water maze (two trials per day) during 7-day training and after platform reversal on day 8. (B) Probe trials performed 24 hr after day 7 (PT1), or 24 hr after reversal training (PT2) (n = 10–13 mice per genotype; two-way analysis of variance [ANOVA] with Bonferroni post hoc test, *p < 0.05, ***p < 0.0001). (C) Conditioned taste aversion (CTA) paradigm. (D) Saccharin preference of control and double transgenic (dt) GluN3A mice, and (E) WT and Grin3a−/− mice after vehicle or LiCl injection (n = 5–7 mice per group; ***p < 0.001, two-way ANOVA followed by Bonferroni post hoc test). (F–H) Weak CTA paradigm and rapamycin treatment regime. Decreased saccharin preference of Grin3a−/− mice on the weak CTA (G) was reversed by rapamycin (H) (**p < 0.01, two-way ANOVA followed by Bonferroni post hoc test).
Figure 7—figure supplement 1.
Figure 7—figure supplement 1.. Behavior of male and female Grin3a−/− mice in the Morris water maze.
(A) Escape latencies of male wild-type (WT) and Grin3a−/− mice over the time-course of training on a standard hidden platform version of the Morris water maze (7 days, four trials per day). (B) Escape latencies of female Grin3a−/− and WT mice over the course of training (two trials per day). (C) On probe trials for memory acquisition performed 24 hr after day 7 (PT1), both groups showed similar preference for the target quadrant (n = 11–13 mice per group). Dashed lines indicate chance levels (25%). (D) Left, on the probe test performed 24 hr after day 7 (PT1), female Grin3a−/− mice showed enhanced preference for the target quadrant relative to WT (n = 11–13 mice per group; two-way analysis of variance [ANOVA] with Bonferroni post hoc test; p = 0.0062). Right, on probe tests 24 hr after completion of reversal training (PT2), female Grin3a−/− showed significant preference for the target quadrant (n = 11–13 mice per genotype; two-way ANOVA with Bonferroni post hoc test, **p<0.01, ***p < 0.0001). (E) WT and Grin3a−/− mice showed no differences in times to reach a visible platform. (F) Swimming speed over the training period. Data plotted correspond to the experiment shown in Figure 7C. (G) Alternation index of wild-type (WT) and Grin3a−/− mice in the Y-maze (n = 9–10 mice per genotype).
Figure 7—figure supplement 2.
Figure 7—figure supplement 2.. Controls for conditioned taste aversion (CTA) experiments.
(A) Double transgenic GluN3A (dtGluN3A) and wild-type (WT) mice showed similar ‘lying on belly’ latencies after a 0.15 M LiCl injection (n = 4–5 mice per group; unpaired two-tailed t-test, ***p < 0.001). (B) dt-GluN3A and control mice showed similar taste preferences (n = 8 mice per group). (C) The rapamycin treatment regime used does not impair the formation of ‘standard’ CTA memory in WT nor Grin3a−/− mice (n = 6–8 mice per group; two-way analysis of variance [ANOVA] with Bonferroni post hoc test, **p < 0.01).
Figure 8.
Figure 8.. GluN3A deletion from excitatory neurons in adult mice is sufficient for memory enhancement.
(A) Contextual fear conditioning test. (B) Enhanced contextual fear conditioning in Grin3a−/− mice 24 hr but not 1 hr after training (n = 9–13 mice per group; left: repeated measures two-way analysis of variance [ANOVA] with Bonferroni post hoc test, p = 0.004; right: two-tailed unpaired t-test, *p < 0.05). (C) Enhanced contextual fear conditioning in Grin3a−/− mice at 48 hr is reversed by rapamycin (2 × 20 mg/kg i.p., 24 hr apart, prior to training) (n = 10–11 mice per group; *p < 0.05; **p < 0.01, two-way ANOVA with Bonferroni post hoc test). (D, E) Conditional deletion of GluN3A from adult excitatory neurons, but not somatostatin (Sst) interneurons, enhances long-term contextual fear memory. The regime for tamoxifen (TMX) injection is indicated (*p < 0.05: ***p < 0.001 two-tailed unpaired t-test). (F, G) Cued-fear extinction in Grin3a−/− and wild-type littermates over a four-day fear extinction paradigm (n = 14–13 mice per group; *p = 0.0461 between-subjects effect, repeated measures ANOVA). Freezing levels were not different between phenotypes in FE1 (t(25) = 0.760, p = 0.455).
Figure 8—figure supplement 1.
Figure 8—figure supplement 1.. Expression of GluN3A and other synaptic proteins in conditional Grin3a knockout mice.
(A) Top, tamoxifen (TMX) administration regime to Grin3af/f × CamK2a-CreERT2 mice. Hippocampal lysates of P90 mice were analyzed by sodium dodecyl sulfate polyacrylamide gel electrophoresis (SDS–PAGE) and immunoblotted for the indicated proteins (n = 4–8 mice per group; unpaired two-tailed t-test, ***p < 0.0001). (B) Immunoblot analysis of hippocampal lysates of P90 Grin3af/f × Som-Cre mice (n = 4–10 mice per group; unpaired two-tailed t-test, **p < 0.01). Note that conditional deletion of Grin3a decreases GluN3A expression without affecting other synaptic proteins.

References

    1. Abel T, Martin KC, Bartsch D, Kandel ER. Memory suppressor genes: inhibitory constraints on the storage of long-term memory. Science. 1998;279:338–341. doi: 10.1126/science.279.5349.338. - DOI - PubMed
    1. Adaikkan C, Rosenblum K. A molecular mechanism underlying gustatory memory trace for an association in the insular cortex. eLife. 2015;4:e07582. doi: 10.7554/eLife.07582. - DOI - PMC - PubMed
    1. Andero R, Ressler KJ. Fear extinction and BDNF: translating animal models of PTSD to the clinic. Genes, Brain, and Behavior. 2012;11:503–512. doi: 10.1111/j.1601-183X.2012.00801.x. - DOI - PMC - PubMed
    1. Banko JL, Merhav M, Stern E, Sonenberg N, Rosenblum K, Klann E. Behavioral alterations in mice lacking the translation repressor 4E-BP2. Neurobiology of Learning and Memory. 2007;87:248–256. doi: 10.1016/j.nlm.2006.08.012. - DOI - PubMed
    1. Benjamin D, Hall MN. mTORC1: turning off is just as important as turning on. Cell. 2014;156:627–628. doi: 10.1016/j.cell.2014.01.057. - DOI - PubMed

Publication types

Substances

Associated data