. 2021 Nov;102(11):001691.
doi: 10.1099/jgv.0.001691.

MicroRNAs affect GPCR and Ion channel genes needed for influenza replication

Affiliations

MicroRNAs affect GPCR and Ion channel genes needed for influenza replication

Nichole Orr-Burks et al. J Gen Virol. 2021 Nov.

Abstract

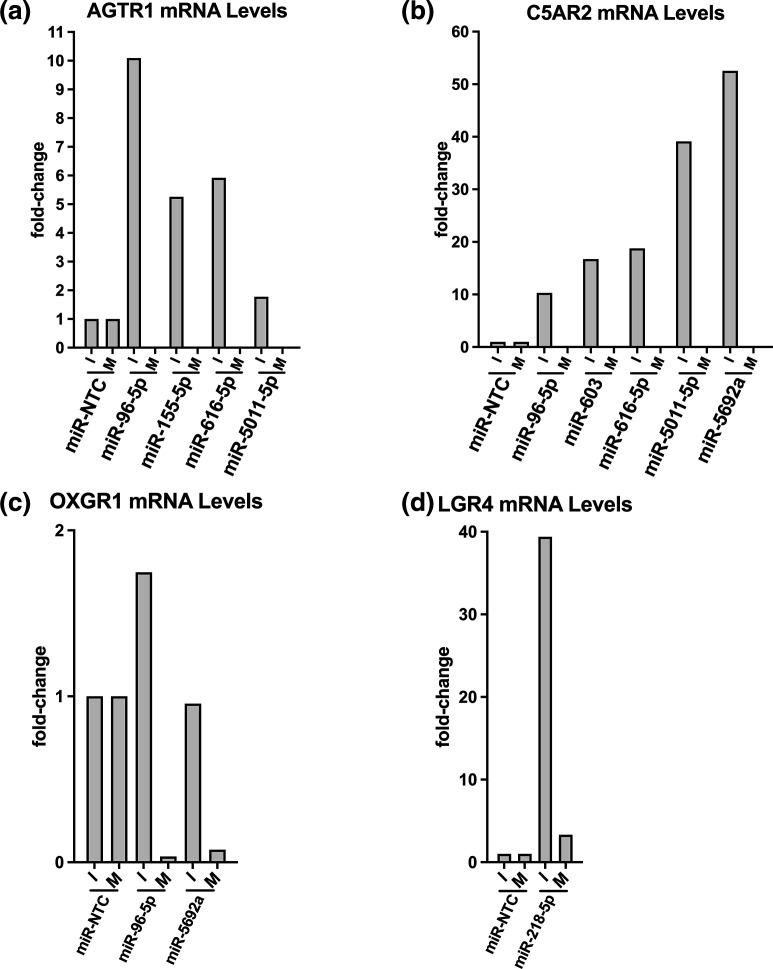
Influenza virus causes seasonal epidemics and sporadic pandemics resulting in morbidity, mortality, and economic losses worldwide. Understanding how to regulate influenza virus replication is important for developing vaccine and therapeutic strategies. Identifying microRNAs (miRs) that affect host genes used by influenza virus for replication can support an antiviral strategy. In this study, G-protein coupled receptor (GPCR) and ion channel (IC) host genes in human alveolar epithelial (A549) cells used by influenza virus for replication (Orr-Burks et al., 2021) were examined as miR target genes following A/CA/04/09- or B/Yamagata/16/1988 replication. Thirty-three miRs were predicted to target GPCR or IC genes and their miR mimics were evaluated for their ability to decrease influenza virus replication. Paired miR inhibitors were used as an ancillary measure to confirm or not the antiviral effects of a miR mimic. Fifteen miRs lowered influenza virus replication and four miRs were found to reduce replication irrespective of virus strain and type differences. These findings provide evidence for novel miR disease intervention strategies for influenza viruses.

Keywords: GPCR; influenza; ion channel; microRNA.


Figures

Fig. 1.
Fig. 1.
miRs affecting A/WSN/33 replication in A549 cells. A549 cells were transfected (25 nM) with either miR mimic, its paired miR inhibitor, miR-NTC control, siMAP2K, or siTOX in triplicate and incubated for 48 h. Post-transfection, A549 cells were infected with A/WSN/33 (MOI=0.01), supernatants were collected 48 h pi, and MDCK plaque assays were performed to determine p.f.u. ml−1. TCID50 ml−1 titres were determined by sample titration on MDCK cells followed by HA assay. Plaque assay (a) and TCID, and TCID50 assay (b) data is presented as fold-change in influenza virus, data is presented as fold-change in influenza virus titre (p.f.u. ml−1) or TCID50 ml−1 titre compared to miR-NTC and shown as mean fold-change ±SEM of two independent experiments performed in triplicate. Ordinary one-way ANOVA with Dunnett’s Multiple Comparisons Post-Test (P<0.05) compared to NTC control. A fold-change >1 equates to an increase in p.f.u. ml−1 or TCID50 ml−1 titre compared to control. A fold-change <1 equates to a decrease in p.f.u. ml−1 or TCID50 ml−1 titre compared to control. A fold-change=1 equates to no change in p.f.u. ml−1 or TCID50 ml−1 titre compared to control.
Fig. 2.
Fig. 2.
miRs affecting A/CA/04/09 replication in A549 cells. A549 cells were transfected (25 nM) with either miR mimic, its paired miR inhibitor, miR-NTC control, siMAP2K, or siTOX in triplicate and incubated for 48 h. Post-transfection, A549 cells were infected with A/CA/04/09 (MOI=0.1), and supernatants were collected 48 h pi, and MDCK plaque assays were performed to determine p.f.u. ml−1. TCID50 ml−1 titres were determined by sample titration on MDCK cells followed by HA assay. Plaque assay (a) and TCID, and TCID50 assay (b) data is presented as fold-change in influenza virus, data is presented as fold-change in influenza virus titre (p.f.u. ml−1) or TCID50 ml−1 titre compared to miR-NTC and shown as mean fold-change ±SEM of two independent experiments performed in triplicate. Ordinary one-way ANOVA with Dunnett’s Multiple Comparisons Post-Test (P<0.05) compared to NTC control. A fold-change >1 equates to an increase in p.f.u. ml−1 or TCID50 ml−1 titre compared to control. A fold-change <1 equates to a decrease in p.f.u. ml−1 or TCID50 ml−1 titre compared to control. A fold-change=1 equates to no change in p.f.u. ml−1 or TCID50 ml−1 titre compared to control.
Fig. 3.
Fig. 3.
miRs affecting B/Yamagata/16/1988 replication in A549 cells. A549 cells were transfected (25 nM) with either miR mimic, its paired miR inhibitor, miR-NTC control, siMAP2K, or siTOX in triplicate and incubated for 48 h. Post-transfection, A549 cells were infected with B/Yamagata/16/1988 (MOI=0.1), supernatants were collected 48 h pi, and MDCK plaque assays were performed to determine p.f.u. ml−1. TCID50 ml−1 titres were determined by sample titration on MDCK cells followed by HA assay. Plaque assay (a) and TCID, and TCID50 assay (b) data is presented as fold-change in influenza virus, data is presented as fold-change in influenza virus titre (p.f.u. ml−1) or TCID50 ml−1 titre compared to miR-NTC and shown as mean fold-change ±SEM of two independent experiments performed in triplicate. Ordinary one-way ANOVA with Dunnett’s Multiple Comparisons Post-Test (P<0.05) compared to NTC control. A fold-change >1 equates to an increase in p.f.u. ml−1 or TCID50 ml−1 titre compared to control. A fold-change <1 equates to a decrease in p.f.u. ml−1 or TCID50 ml−1 titre compared to control. A fold-change=1 equates to no change in p.f.u. ml−1 or TCID50 ml−1 titre compared to control.
Fig. 4.
Fig. 4.
Venn diagram of miR screening results. miR screening data clustered by the ability to reduce plaque titre with some clusters overlapping by strains and subtypes.
Fig. 5.
Fig. 5.
qPCR of target gene mRNA following miR inhibitor or mimic (I/M) transfection. A549 cells were transfected (25 nM) with either miR mimic or its paired miR inhibitor, miR non-targeting inhibitor control (miR-NTC (I), miR non-targeting mimic control miR-NTC (), miR non-targeting mimic control miR-NTC (M), or siTOX transfection control for), or siTOX transfection control for 48 h. Cells were homogenized, and RNA isolated. Samples (n=3) were pooled and qPCR was performed to measure mRNA of predicted target genes AGTR1 (a), C5AR2 (), C5AR2 (b), OXGR1 (), OXGR1 (c), and LGR4 (), and LGR4 (d). Data were normalized to 18S rRNA and presented as fold-change of target mRNA in miR vs miR-NTC (I/M).

Similar articles

Cited by

References

    1. Jagger BW, Wise HM, Kash JC, Walters K-. A, Wills NM. An overlapping protein-coding region in influenza A virus segment 3 modulates the host response. Science. 2012;337:199–204. doi: 10.1126/science.1222213. - DOI - PMC - PubMed
    1. Shi M, Jagger BW, Wise HM, Digard P, Holmes EC, et al. Evolutionary conservation of the PA-X open reading frame in segment 3 of influenza A virus. J Virol. 2012;86:12411–12413. doi: 10.1128/JVI.01677-12. - DOI - PMC - PubMed
    1. Wise HM, Barbezange C, Jagger BW, Dalton RM, Gog JR, et al. Overlapping signals for translational regulation and packaging of influenza A virus segment 2. Nucleic Acids Res. 2011;39:7775–7790. doi: 10.1093/nar/gkr487. - DOI - PMC - PubMed
    1. Wise HM, Foeglein A, Sun J, Dalton RM, Patel S, et al. A complicated message: Identification of a novel PB1-related protein translated from influenza A virus segment 2 mRNA. J Virol. 2009;83:8021–8031. doi: 10.1128/JVI.00826-09. - DOI - PMC - PubMed
    1. Yamayoshi S, Watanabe M, Goto H, Kawaoka Y. Identification of a novel viral protein expressed from the PB2 segment of influenza A virus. J Virol. 2016;90:444–456. doi: 10.1128/JVI.02175-15. - DOI - PMC - PubMed

Publication types

MeSH terms