

Centralized Ambulance Destination Determination: A Retrospective Data Analysis to Determine Impact on EMS System Distribution, Surge Events, and Diversion Status
- PMID: 34787556
- PMCID: PMC8597692
- DOI: 10.5811/westjem.2021.8.53198
Centralized Ambulance Destination Determination: A Retrospective Data Analysis to Determine Impact on EMS System Distribution, Surge Events, and Diversion Status
Abstract
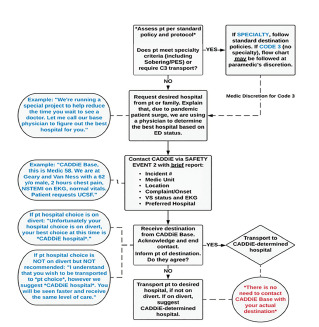
Introduction: Emergency medical services (EMS) systems can become impacted by sudden surges that can occur throughout the day, as well as by natural disasters and the current pandemic. Because of this, emergency department crowding and ambulance "bunching," or surges in ambulance-transported patients at receiving hospitals, can have a detrimental effect on patient care and financial implications for an EMS system. The Centralized Ambulance Destination Determination (CAD-D) project was initially created as a pilot project to look at the impact of an active, online base hospital physician and paramedic supervisor to direct patient destination and distribution, as a way to improve ambulance distribution, decrease surges at hospitals, and decrease diversion status.
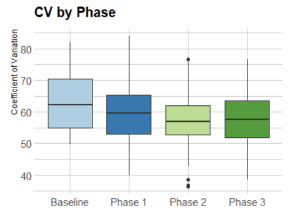
Methods: The project was initiated March 17, 2020, with a six-week baseline period; it had three additional study phases where the CAD-D was recommended (Phase 1), mandatory (Phase 2), and modified (Phase 3), respectively. We used coefficients of variation (CV) statistical analysis to measure the relative variability between datasets (eg, CAD-D phases), with a lower variation showing better and more even distribution across the different hospitals. We used analysis of co-variability for the CV to determine whether level loading was improved systemwide across the three phases against the baseline period. The primary outcomes of this study were the following: to determine the impact of ambulance distribution across a geographical area by using the CV; to determine whether there was a decrease in surge rates at the busiest hospital in this area; and the effects on diversion.
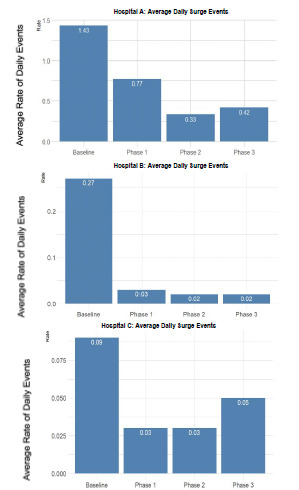
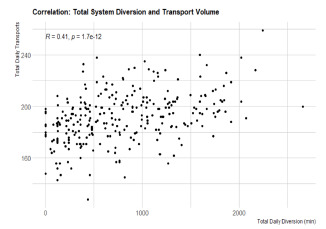
Results: We calculated the CV of all ratios and used them as a measure of EMS patient distribution among hospitals. Mean CV was lower in Phase 2 as compared to baseline (1.56 vs 0.80 P < 0.05), and to baseline and Phase 3 (1.56 vs. 0.93, P <0.05). A lower CV indicates better distribution across more hospitals, instead of the EMS transports bunching at a few hospitals. Furthermore, the proportion of surge events was shown to be lower between baseline and Phase 1 (1.43 vs 0.77, P <0.05), baseline and Phase 2 (1.43 vs. 0.33, P < 0.05), and baseline and Phase 3 (1.43 vs 0.42, P < 0.05). Diversion was shown to increase over the system as a whole, despite decreased diversion rates at the busiest hospital in the system.
Conclusion: In this retrospective study, we found that ambulance distribution increased across the system with the implementation of CAD-D, leading to better level loading. The surge rates decreased at some of the most impacted hospitals, while the rates of hospitals going on diversion paradoxically increased overall. Specifically, the results of this study showed that there was an improvement when comparing the CAD-D implementation vs the baseline period for both the ambulance distribution across the system (level loading/CV), and for surge events at three of the busiest hospitals in the system.
Conflict of interest statement
Figures
Similar articles
-
The Medical Duty Officer: An Attempt to Mitigate the Ambulance At-Hospital Interval.West J Emerg Med. 2016 Sep;17(5):662-8. doi: 10.5811/westjem.2016.7.30266. Epub 2016 Aug 23. West J Emerg Med. 2016. PMID: 27625737 Free PMC article.
-
Trial to end ambulance diversion in Boston: report from the conference of the Boston teaching hospitals consortium.Prehosp Disaster Med. 2011 Apr;26(2):122-6. doi: 10.1017/S1049023X11000070. Prehosp Disaster Med. 2011. PMID: 21888732
-
Association of Ambulance Diversion Policy on EMS Transport and Ambulance Patient Offload Times: A Comparison of Three Strategies.Prehosp Emerg Care. 2024;28(8):1053-1057. doi: 10.1080/10903127.2024.2359505. Epub 2024 Jun 4. Prehosp Emerg Care. 2024. PMID: 38776421
-
Ambulance diversion and emergency department offload delay: resource document for the National Association of EMS Physicians position statement.Prehosp Emerg Care. 2011 Oct-Dec;15(4):555-61. doi: 10.3109/10903127.2011.608871. Prehosp Emerg Care. 2011. PMID: 21870947 Review.
-
Concepts, antecedents and consequences of ambulance ramping in the emergency department: A scoping review.Australas Emerg Nurs J. 2017 Nov;20(4):153-160. doi: 10.1016/j.aenj.2017.07.002. Epub 2017 Oct 18. Australas Emerg Nurs J. 2017. PMID: 29054574
Cited by
-
Ambulance diversion and its use as an ED overcrowding mitigation strategy: Does it work? A scoping review.Int J Emerg Med. 2025 Jul 8;18(1):125. doi: 10.1186/s12245-025-00933-0. Int J Emerg Med. 2025. PMID: 40629271 Free PMC article. Review.
-
The San Francisco Health Systems Collaborative: Public Health and Health Care Delivery Systems' Response to the Covid-19 Pandemic.NEJM Catal Innov Care Deliv. 2024 Aug;5(8):10.1056/CAT.23.0330. doi: 10.1056/CAT.23.0330. Epub 2024 Jul 17. NEJM Catal Innov Care Deliv. 2024. PMID: 39350897 Free PMC article.
References
-
- Backer HD, D’Arcy NT, Davis AJ, et al. statewide method of measuring ambulance patient offload times. Prehosp Emerg Care. 2019;23(3):319–26. - PubMed
-
- Reeder TJ, Garrison HG. When the safety net is unsafe: real time assessment of the overcrowded emergency department. Acad Emerg Med. 2001;8(11):1070–4. - PubMed
-
- Felice J, Coughlin RF, Burns K, et al. Effects of real-time EMS direction on optimizing EMS turnaround and load-balancing between neighboring hospital campuses. Preshosp Emerg Care. 2019;23(6):788–94. - PubMed
-
- Redelmeier DA, Blair PJ, Collins WE. No place to unload: a preliminary analysis of the prevalence, risk factors, and consequences of ambulance diversion. Ann Emerg Med. 1994;23(1):43–7. - PubMed
MeSH terms
LinkOut - more resources
Full Text Sources
Medical
Miscellaneous