. 2021 Nov 17:10:e70873.
doi: 10.7554/eLife.70873.

Human B cell lineages associated with germinal centers following influenza vaccination are measurably evolving

Affiliations

Human B cell lineages associated with germinal centers following influenza vaccination are measurably evolving

Kenneth B Hoehn et al. Elife. .

Abstract

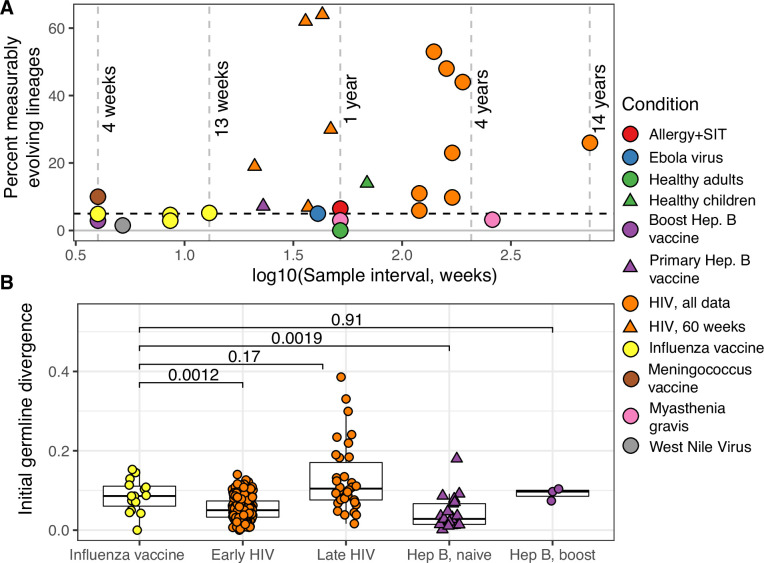
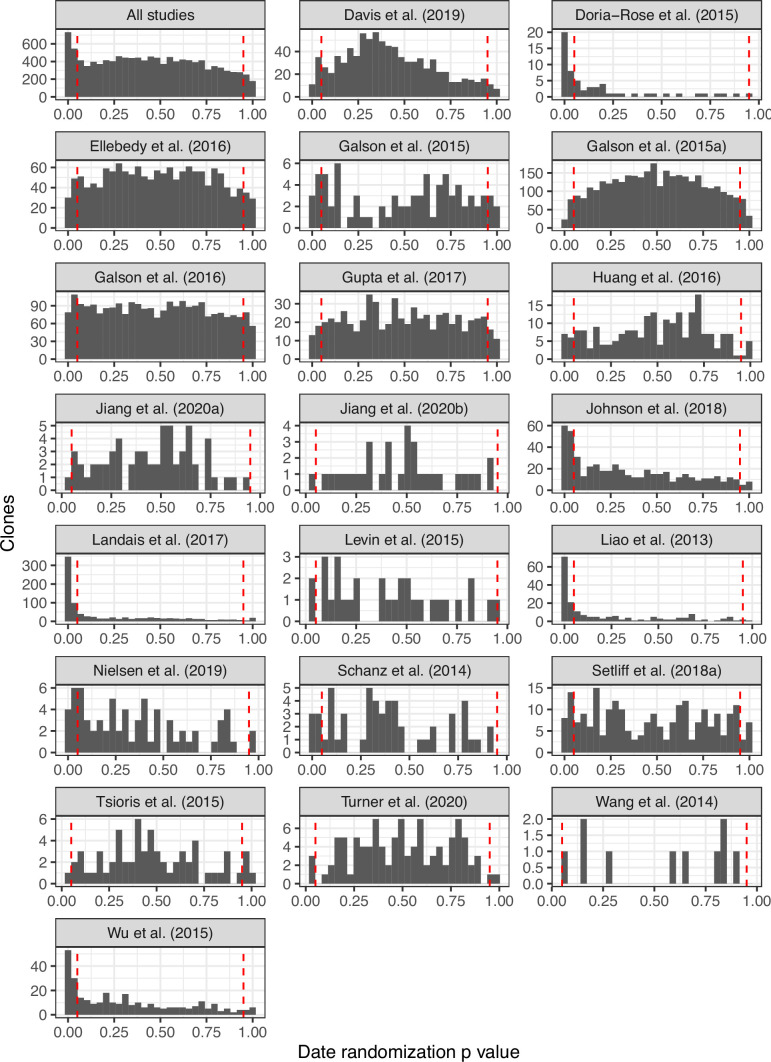
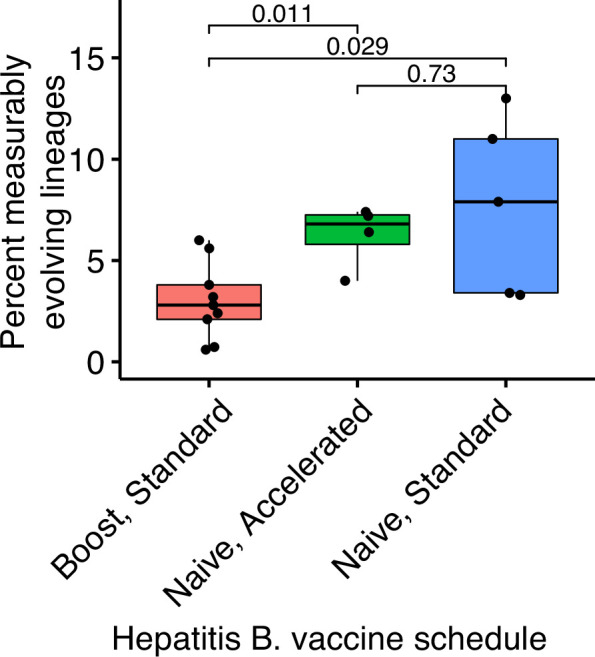
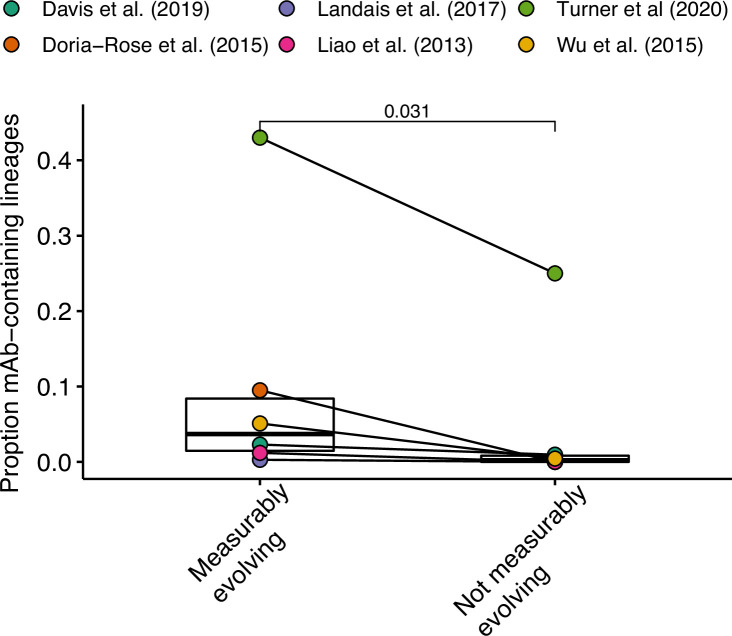
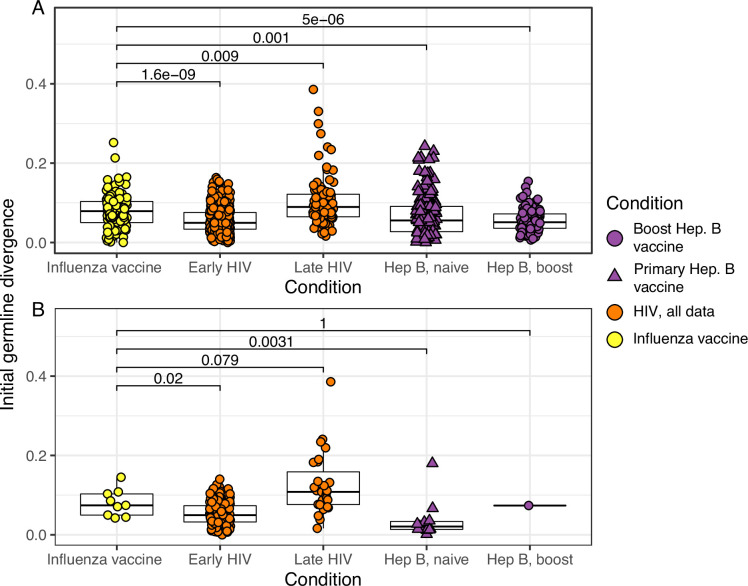
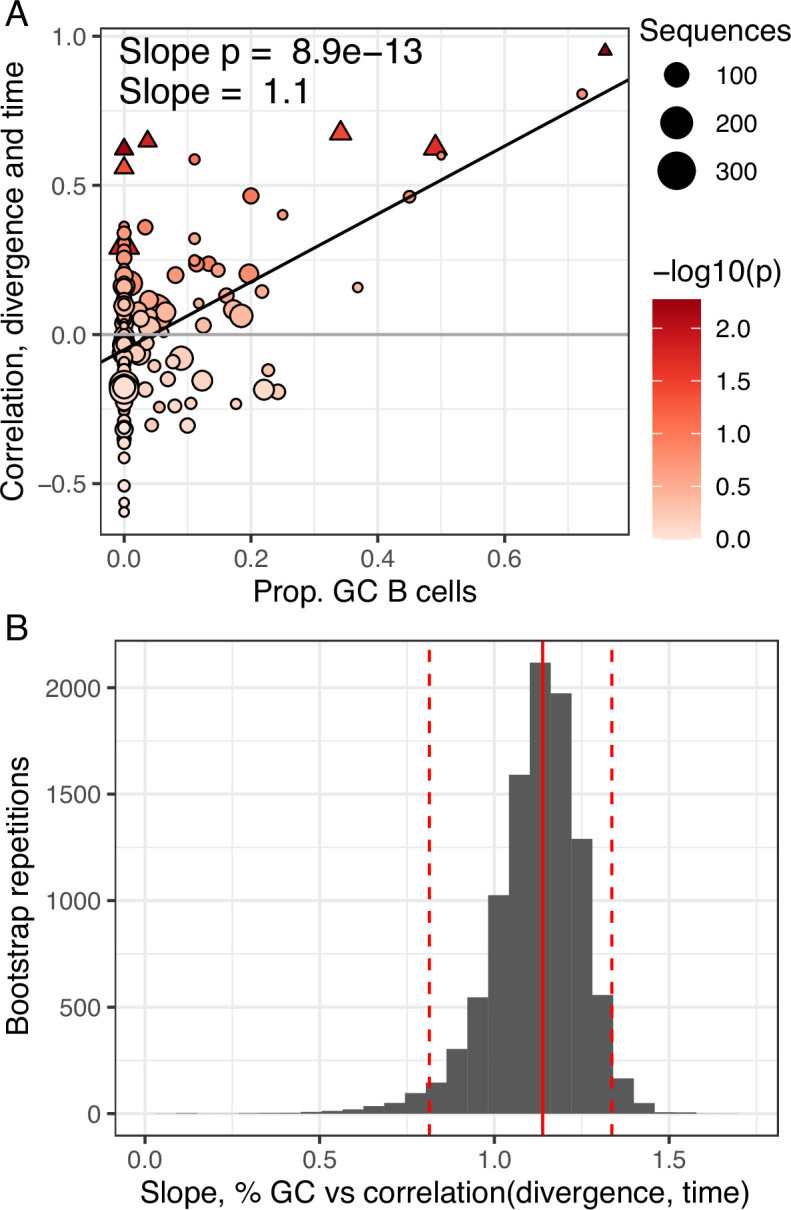
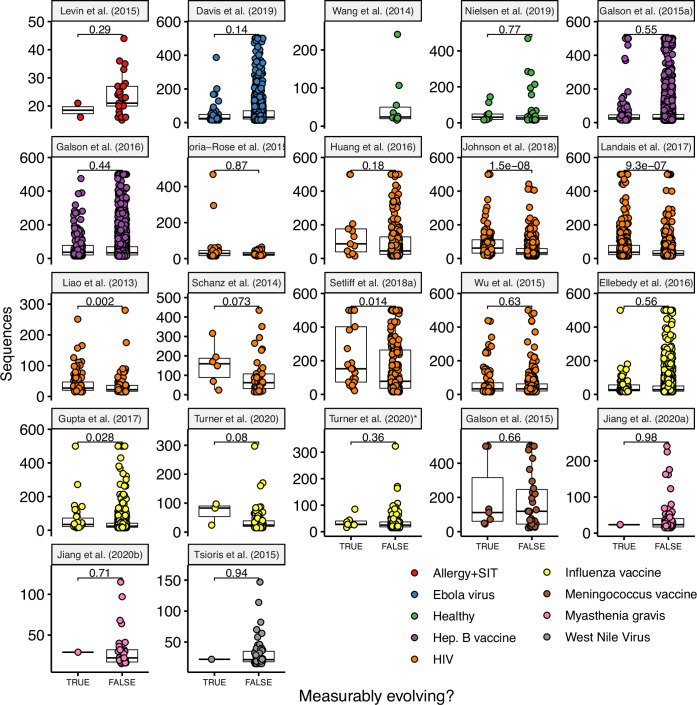
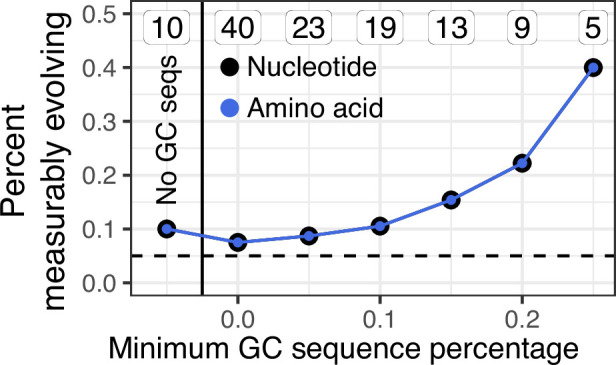
The poor efficacy of seasonal influenza virus vaccines is often attributed to pre-existing immunity interfering with the persistence and maturation of vaccine-induced B cell responses. We previously showed that a subset of vaccine-induced B cell lineages are recruited into germinal centers (GCs) following vaccination, suggesting that affinity maturation of these lineages against vaccine antigens can occur. However, it remains to be determined whether seasonal influenza vaccination stimulates additional evolution of vaccine-specific lineages, and previous work has found no significant increase in somatic hypermutation among influenza-binding lineages sampled from the blood following seasonal vaccination in humans. Here, we investigate this issue using a phylogenetic test of measurable immunoglobulin sequence evolution. We first validate this test through simulations and survey measurable evolution across multiple conditions. We find significant heterogeneity in measurable B cell evolution across conditions, with enrichment in primary response conditions such as HIV infection and early childhood development. We then show that measurable evolution following influenza vaccination is highly compartmentalized: while lineages in the blood are rarely measurably evolving following influenza vaccination, lineages containing GC B cells are frequently measurably evolving. Many of these lineages appear to derive from memory B cells. We conclude from these findings that seasonal influenza virus vaccination can stimulate additional evolution of responding B cell lineages, and imply that the poor efficacy of seasonal influenza vaccination is not due to a complete inhibition of vaccine-specific B cell evolution.

Keywords: B cell; B cell receptor; computational biology; human; immunology; inflammation; measurable evolution; phylogenetics; somatic hypermutation; systems biology; temporal evolution.

Plain language summary

When the immune system encounters a disease-causing pathogen, it releases antibodies that can bind to specific regions of the bacterium or virus and help to clear the infection. These proteins are generated by B cells which, upon detecting the pathogen, can begin to mutate and alter the structure of the antibody they produce: the better the antibody is at binding to the pathogen, the more likely the B cell is to survive. This process of evolution produces B cells that make more effective antibodies. After the infection, some of these cells become ‘memory B cells’ which can be stimulated in to action when the pathogen invades again. Many vaccines also depend on this process to trigger the production of memory B cells that can fight off a specific disease-causing agent. However, it is unclear to what extent memory B cells that already exist are able to continue to evolve and modify their antibodies. This is particularly important for the flu vaccine, as the virus that causes influenza rapidly mutates. To provide high levels of protection, the memory B cells formed following the vaccine may therefore need to evolve to make different antibodies that recognize mutated forms of the virus. It is thought that the low effectiveness of the flu vaccine is partially because the response it triggers does not stimulate additional evolution of memory B cells. To test this theory, Hoehn et al. developed a computational method that can detect the evolution of B cells over time. The tool was applied to samples collected from the blood and lymph nodes (organ where immune cells reside) of people who recently received the flu vaccine. The results were then compared to B cells taken from people after different infections, vaccinations, and other conditions. Hoehn et al. found the degree to which B cells evolve varies significantly between conditions. For example, B cells produced during chronic HIV infections frequently evolved over time, while such evolution was rarely observed during the autoimmune disease myasthenia gravis. The analysis also showed that memory B cells produced by the flu vaccine were able to evolve if recruited to the lymph nodes, but this was rarely detected in B cells in the blood. These findings suggest the low efficacy of the flu vaccine is not due to a complete lack of B cell evolution, but likely due to other factors. For instance, it is possible the evolutionary process it stimulates is not as robust as in other conditions, or is less likely to produce long-lived B cells that release antibodies. More research is needed to explore these ideas and could lead to the development of more effective flu vaccines.


Conflict of interest statement

KH receives consulting fees from Prellis Biologics, JT is the recipient of a licensing agreement with Abbvie and has received consulting fees from Gerson Lehman Group, FM, RJ, OP No competing interests declared, AE The Ellebedy laboratory received funding under sponsored research agreements from Emergent BioSolutions and AbbVie, SK receives consulting fees from Northrop Grumman and Peraton

Figures

Figure 1.
Figure 1.. Detecting measurable evolution in B cell lineages.
(A) Example B cell lineage tree from Liao et al., 2013 showing increasing divergence with sample time. Branch lengths show somatic hypermutation (SHM)/site according to scale bar in (D). (B) Rate of SHM accumulation over time estimated using a regression of divergence vs time in tree (A). (C) Significance of the relationship between divergence and time estimated using a date randomization test comparing the Pearson’s correlation (r) between divergence and time in tree (A). (D–F) Same plots as (A–C) but on a tree that is not measurably evolving. (G) Simulation-based power analysis shows the permutation test has high power over an interval of at least 10–30 GC cycles (generations). Lineages were sampled once at generation 10, and a second time after the specified number of additional generations have elapsed. Percentage of lineages with p < 0.05 are listed above, rounded to three significant digits. The dotted line corresponds to p = 0.05. (H) Simulation-based analysis reproducing the sampling of Laserson et al., 2014 shows the test has high power even at slow (24 hr) GC cycle times.
Figure 1—figure supplement 1.
Figure 1—figure supplement 1.. Clustered date randomization and resolution of polytomies.
Example tree showing little evidence of ongoing somatic hypermutation (SHM). This tree contains two large polytomies consisting of multiple short branches radiating out from a central node. These features can possibly result from sequencing error or PCR error in bulk B cell receptor (BCR) data, where errors create spurious, unique sequences one mutation away from a single real sequence. Permuting these tips uniformly among each other leads to these spurious tips being treated as independent data points, and can lead to high false positive rates if not corrected. While visual inspection of this tree shows little evidence of increase in SHM over time, it has a date randomization test p < 0.05 unless its polytomies are resolved. In the panels above, each tip is a sequence labeled with its cluster assignment. (A) Tips are permuted individually, meaning each tip is a separate cluster. This leads to 6.6 × 10⁵ distinct permutations of time labels along the tree, and a p < 0.05. (B) Tips belonging to single-timepoint monophyletic clades are grouped into clusters, equivalent to Murray et al., 2016. Timepoints are permuted among these clusters, which reduces the number of possible permutations. This also reduces the significance of the relationship between divergence and time. However, because the polytomies are randomly resolved into bifurcations with zero-length branches, each polytomy has multiple clusters with the same timepoint. For instance, clusters 1, 15, 10, 12, and 2 could be grouped in the same cluster but are kept distinct. (C) Bifurcations using zero-length branches within the polytomies are rearranged to give the fewest possible number of monophyletic single-timepoint clusters. Resolving polytomies effectively treats same-timepoint sequences within polytomies as the same data point, appropriately showing this tree does not have sufficient evidence of measurable evolution.
Figure 1—figure supplement 2.
Figure 1—figure supplement 2.. Comparison of date randomization strategies.
The date randomization test can be performed using either uniform permutations, in which the timepoint of each tip is permuted separately, or clustered permutations, in which timepoints are permuted among single-timepoint monophyletic clusters. It can also be performed using clusters after polytomies have been resolved into the smallest possible number of single-timepoint clades. Using a two-tailed test, we determine whether a lineage is positively measurably evolving (correlation between divergence and time > 0, p < 0.025) or negatively measurably evolving (correlation < 0, p < 0.025). Measurable negative evolution indicates decreasing divergence over time, which is biologically implausible and likely represents false positives. This could be due to population structure at different timepoints. See Murray et al., 2016. In the panels above, we repeated the analyses in Table 1 using two-tailed tests with each permutation strategy. The x axis shows the percent of positively measurably evolving lineages for each study, while the y axis shows the percent of negatively measurably evolving lineages, which are interpreted as false positives. The dashed line shows 2.5%, the maximum expected percent of negatively evolving lineages. Only clustered permutations with resolved polytomies – used in all other analyses in this manuscript – fully controlled this error metric.
Figure 1—figure supplement 3.
Figure 1—figure supplement 3.. Simulation-based power analysis.
For upper panels (affinity maturation) each lineage was simulated for 10 GC cycles before 50 cells were sampled, if available. Affinity maturation continued for the specified number of additional GC cycles (x axis) before a second sampling of 50 cells. This process was repeated for 100 repetitions for the specified number of GC cycles, and given the specified strength of selection. Selection = 0 corresponds to neutral evolution, while selection = 1 corresponds to strong selection for matching to a single target sequence. Default parameters from bcr-phylo (Davidsen and Matsen, 2018; Ralph and Matsen, 2020) were used otherwise. The y axis shows the −log10(p value) for the date randomization test, with dots above the horizontal dashed line representing measurably evolving lineages (p < 0.05). The percentage of measurably evolving lineages for each set of simulations is shown above the dashed line, rounded to three significant digits. Only simulated lineages with a minimum possible p < 0.05 were tested in simulations. Because all lineages were undergoing affinity maturation in the upper panels, this corresponds to the true positive rate. Lower panels (randomized times) show results from the same simulated data but with sampling times randomized among sequences. Because these simulations are effectively not evolving over time, the numbers above show the false positive rate in the lower panels.
Figure 1—figure supplement 4.
Figure 1—figure supplement 4.. Simulation-based power analysis recreating experimental sampling design.
Simulations were performed to replicate the sampling strategy of Laserson et al., 2014, in which an individual was sampled at six timepoints between 1 and 28 days following influenza vaccination. We excluded prevaccination samples as well as the sample taken 1 hr after vaccination because it was too early for any GC cycles to occur in simulations. For each simulation, we selected a lineage C from subject hu420143. To calculate the number of GC cycles to simulate, we divided the sample times (hours postvaccination) of lineage C by the specified GC cycle time (x axis). We then simulated affinity maturation as in Figure 1—figure supplement 3 , and sampled the same number of cells as were present in C at the corresponding time. We repeated this process for each lineage in subject hu420143 with at least 15 sequences sampled over 3 weeks and a minimum possible p value <0.05. The percentage of measurably evolving lineages for each set of simulations is shown above the dashed line, rounded to three significant digits. Only simulated lineages with a minimum possible p < 0.05 were tested in simulations. Because all lineages in the upper panels (affinity maturation) were undergoing affinity maturation, this corresponds to the true positive rate. Lower panels (randomized times) show results from the same simulated data but with sampling times randomized among sequences. Because these simulations are effectively not evolving over time, the numbers above show the false positive rate in the lower panels.
Figure 1—figure supplement 5.
Figure 1—figure supplement 5.. Mean divergence of lineages from simulations in Figure 1—figure supplement 3 under neutral evolution (selection = 0) or strong selection (selection = 1).
Figure 2.
Figure 2.. Measurable evolution in B cell lineages across time and conditions.
(A) Percentage of lineages that are measurably evolving within each study (Table 1, Figure 1C). The dotted line indicates 5%, the percent expected under the null hypothesis that there is no measurable evolution occurring in a given dataset. Orange triangles indicate HIV datasets truncated to only include data within the first 60-week sampling interval. Note that three HIV studies were not truncated because they contained <2 sample timepoints within the first 60 weeks of sampling (Huang et al., 2016; Schanz et al., 2014; Wu et al., 2015). (B) Mean initial germline divergence (sum of branch lengths) from germline to sequences from each adjusted measurably evolving lineage’s first timepoint. Note that ‘Early/Late’ HIV in (B) separates studies by time since initial infection, while ‘HIV, first 60 weeks’ in (A) includes only samples taken over the first 60 weeks of sampling. Each point is a measurably evolving lineage with a Benjamini–Hochberg adjusted p value <0.1. Wilcoxon tests were used to compare divergence levels among datasets.
Figure 2—figure supplement 1.
Figure 2—figure supplement 1.. Date randomization p value histograms from blood-derived lineages across all studies.
Figure 2—figure supplement 2.
Figure 2—figure supplement 2.. Comparison of measurably evolving lineages among hepatitis B vaccine schedules.
Hepatitis B booster vaccine data were obtained from Galson et al., 2015b and consisted of nine previously vaccinated subjects sampled four times between 0 and 28 days after a single vaccination. Hepatitis naive data were obtained from Galson et al., 2016. These subjects were all vaccine naive, were given three vaccinations, and sampled at seven timepoints. Five subjects received ‘standard’ vaccinations at days 0, 28, and 168, and were sampled at days 0, 7, 28, 35, 168, 175, and 208. Four subjects received ‘accelerated’ vaccinations at days 0, 28, and 56, and were sampled at days 0, 7, 28, 35, 56, 63, and 96. p values were calculated using a Wilcoxon test.
Figure 2—figure supplement 3.
Figure 2—figure supplement 3.. Enrichment of antigen-binding monoclonal antibody (mAb) sequences across studies.
Data from Turner et al., 2020 include both blood and lymph node sequences. P value was calculated using a Wilcoxon test.
Figure 2—figure supplement 4.
Figure 2—figure supplement 4.. Initial germline divergence with alternate p value thresholds.
(A) Mean initial germline divergence (sum of branch lengths) from germline to sequences from each adjusted measurably evolving lineage’s first timepoint. Each point is a measurably evolving lineage with a p value < 0.05. (B) Similar to A, but only lineages with an false discovery rate (FDR)-adjusted p value <0.05 were included. This cutoff is more strict than that in Figure 2B. Wilcoxon tests were used to compare divergence levels among datasets. Only datasets from Figure 2B were included.
Figure 3.
Figure 3.. Germinal center (GC) association is positively related to measurable evolution following influenza vaccination.
(A) Percent of lineages that are measurably evolving given a minimum percentage of GC sequences. The minimum (inclusive) percent of GC sequences within a clone is shown on the x axis. The origin shows the percentage of measurably evolving lineages across all lineages. The left-most point shows lineages without any GC sequences. The total number of lineages in each category are listed above each point. The dashed line shows 5%, the expected false positive rate under the null hypothesis. Results are shown for clustered date randomization tests using divergence values calculated either as the sum of nucleotide-based phylogenetic branch lengths (nucleotide), and the amino acid Hamming distance of each sequence to the germline (amino acid). (B, C) Lineage trees showing measurably evolving lineages with the highest proportion of GC sequences. Tips are labeled by cell type if available. ABC, activated B cell; GC, germinal center; PB, plasmablast; RMB, resting memory B; and unlabeled tips are from bulk PBMC sequencing. mAb = influenza-binding monoclonal antibody sequence (2018/2019 quadrivalent inactivated influenza virus vaccine). Branch lengths represent somatic hypermutation (SHM)/site, as shown by the shared scale bar.
Figure 3—figure supplement 1.
Figure 3—figure supplement 1.. Germinal center (GC) engagement is positively related to measurable evolution following influenza vaccination.
(A) Proportion of GC sequences within a lineage is positively related to the correlation between divergence and time. Lineages with p < 0.05 are shown as triangles. Points are colored by correlation between divergence and time. (B) Bootstrap analysis of the linear regression slope between the proportion of GC B cells and the correlation between divergence and sample time. Distribution shows bootstrap replicates, solid red line shows observed slope estimate, dashed red lines show 2.5% and 97.5% quantiles.
Figure 3—figure supplement 2.
Figure 3—figure supplement 2.. Number of sequences per lineage in measurably evolving vs nonmeasurably evolving lineages.
See Table 1 for details on each study. P values are computed using a Wilcoxon test. Turner et al., 2020* included all samples (blood and lymph node) while Turner et al., 2020 included only blood samples.
Figure 3—figure supplement 3.
Figure 3—figure supplement 3.. Percent of lineages that are measurably evolving given a minimum percentage of germinal center (GC) sequences.
In contrast to Figure 3A, only lineages containing influenza-binding monoclonal antibody sequences (mAbs) were included in this analysis.
Author response image 1.

Similar articles

Cited by

References

    1. Allen CDC, Okada T, Tang HL, Cyster JG. Imaging of germinal center selection events during affinity maturation. Science. 2007;315:528–531. doi: 10.1126/science.1136736. - DOI - PubMed
    1. Arevalo P, McLean HQ, Belongia EA, Cobey S. Earliest infections predict the age distribution of seasonal influenza A cases. eLife. 2020;Vol. 9:e50060. doi: 10.7554/eLife.50060. - DOI - PMC - PubMed
    1. Benjamini Y, Hochberg Y. Controlling the False Discovery Rate: A Practical and Powerful Approach to Multiple Testing. Journal of the Royal Statistical Society. 1995;57:289–300. doi: 10.1111/j.2517-6161.1995.tb02031.x. - DOI
    1. Cizmeci D, Lofano G, Rossignol E, Dugast AS, Kim D, Cavet G, Nguyen N, Tan YC, Seaman MS, Alter G, Julg B. Distinct clonal evolution of B-cells in HIV controllers with neutralizing antibody breadth. eLife. 2021;10:e62648. doi: 10.7554/eLife.62648. - DOI - PMC - PubMed
    1. Davidsen K, Matsen FA. Benchmarking Tree and Ancestral Sequence Inference for B Cell Receptor Sequences. Frontiers in Immunology. 2018;9:2451. doi: 10.3389/fimmu.2018.02451. - DOI - PMC - PubMed

Publication types

Substances