. 2022 Jan 3;221(1):e202106170.
doi: 10.1083/jcb.202106170. Epub 2021 Nov 17.

Volumetric morphometry reveals spindle width as the best predictor of mammalian spindle scaling

Affiliations

Volumetric morphometry reveals spindle width as the best predictor of mammalian spindle scaling

Tobias Kletter et al. J Cell Biol. .

Abstract

The function of cellular structures at the mesoscale is dependent on their geometry and proportionality to cell size. The mitotic spindle is a good example why length and shape of intracellular organelles matter. Spindle length determines the distance over which chromosomes will segregate, and spindle shape ensures bipolarity. While we still lack a systematic and quantitative understanding of subcellular morphology, new imaging techniques and volumetric data analysis promise novel insights into scaling relations across different species. Here, we introduce Spindle3D, an open-source plug-in that allows for the quantitative, consistent, and automated analysis of 3D fluorescent data of spindles and chromatin. We systematically analyze different mammalian cell types, including somatic cells, stem cells, and one- and two-cell embryos, to derive volumetric relations of spindle, chromatin, and the cell. Taken together, our data indicate that mitotic spindle width is a robust indicator of spindle volume, which correlates linearly with chromatin and cell volume both within single cell types and across mammalian species.


Figures

Figure 1.
Figure 1.
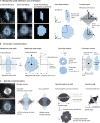
3D analysis of fluorescent spindle and chromatin data allows for the accurate extraction of morphometric parameters. (A) Top: Projected micrograph of a mitotic mouse embryonic stem cell expressing tubulin-GFP (white); DNA is stained with Hoechst (blue). Bottom: Same image resliced to display the equatorial section of the spindle. Scale bar, 5 µm. (B) Schematic of a mitotic spindle and its relevant morphometric parameters extracted by Spindle3D. Along the spindle axis, Spindle3D measures spindle length and metaphase plate width, and in the lateral direction, it measures spindle width and metaphase plate length. Chromatin dilation quantifies the central signal strength of the metaphase plate. (C) Morphometry on projected spindles distorts measurements if spindle axes are tilted. (D) The relationship between the spindle angle and the percent discrepancy between the 2D (projected) and 3D spindle length quantification (n = 19). Circles represent individual spindles, and color is coded according to 3D spindle length. Line shows linear regression.
Figure S1.
Figure S1.
Spindle3D morphometric analysis workflow. (A) In confocal micrographs, mitotic cells (chromatin is shown in blue, and tubulin is shown in grayscale) are detected by crude, histogram-based segmentation and connected component analysis. The shortest axis of the metaphase plate object is determined and initiates an imaging axis-independent coordinate system. Scale bar, 5 µm. (B) In the newly aligned image, radial and axial intensity profiles serve as robust guides to quantify the extents of the usually irregularly shaped chromatin plate. Moreover, radial profiles inform on the magnitude of dilation of the metaphase plate. Based on the extents of the plate, a 3D region of interest is used to limit the pixels considered for histogram-based segmentation of the chromosomes, excluding potentially interfering signals from nuclei in close proximity. (C) Analogously, only a fraction of the tubulin channel pixels (the ones immediately bordering the chromatin mask and thus either represent spindle microtubules or nonspindle tubulin inside the cell) are considered for Otsu thresholding the spindle. Spindle poles are the brightest pixels found within defined radii around the intersections of the initial spindle axis (found in A) and the spindle volume mask. This mask is projected along the now corrected spindle axis. The resulting area is radially scanned in 10° steps to ultimately measure 18 lateral spindle extents, their mean representing the average spindle width. Finally, the tilt of the corrected spindle axis is used to determine the spindle angle. Scale bar, 5 µm. ROI, region of interest.
Figure 2.
Figure 2.
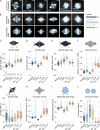
Spindle3D robustly derives morphometric parameters across a variety of cell types. (A) Representative live fluorescent 3D spindle datasets (maximum-projected) from different cells expressing labeled tubulin or microtubule-associated proteins or treated with SiR-tubulin (white). Chromatin (blue) is visualized with Hoechst, SiR-DNA, or H2B-mScarlet. Scale bars, 5 µm. (B) Automated axial registration and segmentation of two-color (tubulin grayscale, chromatin blue) input images as shown in A. Spindle3D exports axially aligned output images containing segmentation masks and spindle pole localization for quality control. (C–J) Quantification of spindle length (C), spindle width (D), spindle aspect ratio (E), spindle volume (F), spindle angle (G), chromatin volume (H), metaphase plate length (I), and chromatin dilation (J) for all cell types. Circles are individual data points and represent a single spindle measurement (HEK293, n = 76; HeLa Kyoto, n = 235; mESCs, n = 69; Ptk2, n = 23; bovine one cell, n = 25; bovine two cell, n = 32). Boxes describe the interquartile range, horizontal lines in the box denote the median, and whiskers show minimum and maximum.
Figure S2.
Figure S2.
Relationship between genome sizes and spindle and chromatin dimensions. (A and B) Scatterplot displaying the relationship between genome size and metaphase plate length (A) and number of mitotic chromosomes and metaphase plate length (B). (C and D) Scatterplot displaying the relationship between genome size and chromatin volume (C) and number of mitotic chromosomes and chromatin volume (D). (E and F) Scatterplot displaying the relationship between genome size and spindle volume (E) and number of mitotic chromosomes and spindle volume (F). Circles represent single cells (HEK293, n = 76; HeLa Kyoto, n = 235; mESCs, n = 69; Ptk2, n = 23; bovine one cell, n = 25; bovine two cell, n = 32). HEK293 cells were described as hypotriploid (3n−; Bylund et al., 2004) with an average chromosome number of 64. Considering the median human diploid genome size of 5.72 gigabytes (GB; NCBI) and the diploid human chromosome number of 46, we estimated the genome size to be ∼8.00 GB. HeLa cells were described as hypertriploid (3n+; Macville et al., 1999) with an average chromosome number of 76; we estimated the average HeLa genome to be ∼9.72 GB. The diploid genome of M. musculus corresponds to 40 chromosomes. The median diploid genome size is reported to be 5.38 Gb (NCBI). Analogously, the diploid genome of B. taurus corresponds to 60 chromosomes, the median diploid genome size is 5.44 GB (NCBI). The genome of the marsupial species P. tridactylis is not yet sequenced; the female diploid chromosome number is 12 (Rens et al., 1999).
Figure 3.
Figure 3.
Sample preparation alters spindle and chromatin morphology. (A) Fluorescently tagged tubulin allows for direct comparison of spindle morphology in live and fixed specimens. Left column shows representative mitotic cells (HeLa Kyoto and mESCs lines both stably expressing tubulin-GFP) when imaged live. Cells depicted in the central column were chemically fixed before imaging. Cells in the right column were fixed and embedded in mounting media. Tubulin-GFP signal is in white, and DNA is shown in blue. Dotted lines indicate cell boundaries. Scale bar, 5 µm. (B) Left column shows projections along the imaging axis (top), x axis (middle), and y axis (bottom) of a chemically fixed mESC imaged in 1× PBS. Analogously, the right column shows an mESC that was fixed and mounted. Colors as in A. The dotted lines indicate the plane of the cover glass. Scale bar, 5 µm. (C–E) Fixation and sample preparation introduce artifacts to morphometric parameters such as spindle volume (C) and thus distort geometrical relationships among spindle measures such as spindle aspect ratio (D) and the ratio of spindle volume to chromatin volume (E). Circles represent individual spindles (HeLa Kyoto live, n = 63; HeLa Kyoto fixed, n = 43; HeLa Kyoto fixed + mounted, n = 36; mESCs live, n = 69; mESCs fixed, n = 55; mESCs fixed + mounted, n = 39). Boxes denote interquartile range, and horizontal lines show medians. Whiskers show minimum and maximum. P values from ANOVA with Tukey’s test as post-hoc analysis. *, P < 0.05; **, P = 0.001; n.s., not significant (P > 0.05).
Figure S3.
Figure S3.
Performance accuracy of manual versus automated spindle measurements. (A) Micrograph (single z-slice) of a tubulin-GFP (grayscale) expressing mouse embryonic stem cell (mESC) fixed at mitosis. Antibody stainings were used to detect γ-tubulin (magenta). DNA is stained with Hoechst (blue). The arrow and region of interest (ROI; yellow) highlight the outer edge of the γ-tubulin signal, the position considered as ground-truth spindle pole. Scale bar, 5 µm. (B) Maximum projection along the spindle axis of a tubulin-GFP–expressing mitotic mESC with labeled centrosomes (γ-tubulin, magenta). Four manually drawn spindle width measurements (yellow) were averaged to yield the reference spindle width. Scale bar, 5 µm. (C) Box plots show distributions of spindle length measurements (n = 40) derived by manually placing spindle poles within the tubulin-only 3D image (“manual”), manually placing spindle poles within the γ-tubulin–only 3D image (“ground truth”), or subjecting the chromatin/tubulin stack to analysis by Spindle3D. (D) Box plots show distributions of spindle width measurements (n = 40) derived manually or via Spindle3D. Boxes reflect the interquartile range, and whiskers show the minimum and maximum. The medians are shown as horizontal white lines inside the boxes. Circles reflect measurements on individual spindles and are linked across the methods by lines. Hypothesis testing was performed using the Wilcoxon signed-rank test. n.s., P > 0.05. (E) Rationale for determining the minimum and maximum spindle width after segmentation in Spindle3D. (F and G) Scatterplots showing the relationship between the minimum spindle width and spindle volume (F) and between the maximum spindle width and spindle volume (G). Circles represent individual cells (HEK293, n = 76; HeLa Kyoto, n = 235; mESCs, n = 69; Ptk2, n = 23; bovine one cell, n = 25; bovine two cell, n = 32). rs, Spearman correlation coefficient. ***, P < 0.001; ****, P < 0.0001.
Figure 4.
Figure 4.
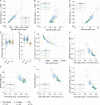
In mammalian cells, spindle width, rather than spindle length, reflects spindle volume. (A and B) Relationship between spindle length and spindle volume (A) and spindle width and spindle volume (B) in live spindles of five different cell types. (C) Volumetric relationship between chromatin and spindle. (D and E) Relationship between chromatin volume and spindle length (D) and chromatin volume and spindle width (E). (F and G) Relationship between metaphase plate length and spindle width (F) and metaphase plate length and spindle length (G). Circles represent individual spindles (HEK293, n = 76; HeLa Kyoto, n = 235; mESCs, n = 69; Ptk2, n = 23; bovine one cell, n = 25; bovine two cell, n = 32). rs, Spearman correlation coefficient; black coefficients show correlation for pooled data (n = 460), and colored coefficients show cell-type resolved correlations. *, P < 0.05; **, P < 0.005; ***, P < 0.001; ****, P < 0.0001; n.s., P > 0.05.
Figure 5.
Figure 5.
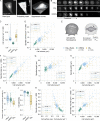
Spindle volume and chromatin volume scale linearly with cell volume. (A) Rationale for quantifying cell volume via cytoplasmic tubulin fluorescence by pixel classification in the segmentation software Ilastik (Berg et al., 2019). Voxels of input micrographs (left) were converted to probabilities for mitotic cytoplasm (center). Probability masks were thresholded at 0.5 (dotted line) to produce the final volume mask (blue, right). Scale bar, 5 µm. (B) Z-series showing the cell boundaries (blue) as determined by pixel classification in three cell lines expressing fluorescent tubulin. Scale bars, 5 µm. (C) Distributions of cell volumes in three cell lines. (D) Bivariate relationships between cell volume and spindle volume. (E) Quantifying spindle mass as the polymer and free tubulin mass within the spindle volume (Vs), normalized by a cell-specific fluorescence correction factor (Flcorr) proportional to the total fluorescent tubulin concentration ([Tub]Total). [Tub]S, tubulin concentration within spindle volume (Materials and methods). (F–H) Bivariate relationships between cell volume and spindle mass (F), cell volume and spindle length (G), and cell volume and spindle width (H). (I) Distributions of cell sphericity in three cell lines. (J) Distributions showing the fraction of cell volume occupied by the spindle. (K) Relationship between the cell surface area: volume ratio and spindle mass. (L) Volumetric relationship between cell and chromatin. Circles reflect individual cells (HeLa Kyoto, n = 104. mESCs, n = 63. Ptk2: n = 20). rs, Spearman correlation coefficient; black coefficients show correlation for pooled data, and colored coefficients show cell-type resolved correlations. **, P < 0.005; ***, P < 0.001; ****, P < 0.0001; n.s., P > 0.05. Boxes denote interquartile range, horizontal lines represent medians, and whiskers show minimum and maximum.
Figure S4.
Figure S4.
Cell volume and diameter measurements. (A) Z montage showing a mitotic HeLa Kyoto cell expressing tubulin-GFP (grayscale) and mCherry-CaaX (magenta); DNA (blue) was stained by SiR-DNA. Scale bar, 5 µm. (B) Isolated slice of A highlighting the cell membrane landmark channel (top) with the manually traced cell boundary (dashed line) and the tubulin-GFP channel (bottom) used in pixel classification–based segmentation. Scale bar, 5 µm. (C) Distributions showing cell volumes (n = 15) as determined in the landmark channels versus through pixel classification in the fluorescent tubulin channel. Boxes reflect the interquartile range, and whiskers show the minimum and maximum. The medians are shown as horizontal white lines inside the boxes. Circles reflect measurements on individual spindles and are linked across the methods by lines. Hypothesis testing was performed using the Wilcoxon signed-rank test. n.s., P > 0.05. (D) Z projections of a B. taurus embryo (expressing mClover3-MAP4-MTBD for the visualization of microtubules [grayscale]) at metaphase of the one-cell stage (left) or two-cell stage (right). Cell boundaries are highlighted with dashed yellow lines. The diameter of the one-cell embryo is indicated with a white dashed line. Scale bar, 5 µm.
Figure S5.
Figure S5.
CA/CV ratios do not explain the unique spindle scaling phenotype of Ptk2 cells. (A–C) Scatterplots displaying the relationship between spindle volume and spindle mass (A), between spindle length and spindle mass (B), and between spindle width and spindle mass (C). (D and E) Distributions of tubulin density in the spindle (polymer and free; D) and the fraction of total tubulin partitioned to the spindle (E). (F) Scatterplot showing the relationship between cell volume and CA/CV ratios in three cell types. (G) Spindle volume plotted against CA/CV. (H–J) Relationship between CA/CV ratio and spindle length (H), CA/CV ratio and spindle width (I), and CA/CV ratio and chromatin volume (J). Boxes reflect the interquartile range, and whiskers show the minimum and maximum. The medians are shown as horizontal white lines inside the boxes. Circles represent individual cells (HeLa Kyoto, n = 104; mESCs, n = 63; Ptk2, n = 20). rs: Spearman correlation coefficient. *, P < 0.05; ***, P < 0.001; ****, P < 0.0001; ns, P > 0.05.

References

    1. Baran, V., Brzakova A., Rehak P., Kovarikova V., and Solc P.. 2016. PLK1 regulates spindle formation kinetics and APC/C activation in mouse zygote. Zygote. 24:338–345. 10.1017/S0967199415000246 - DOI - PubMed
    1. Berg, S., Kutra D., Kroeger T., Straehle C.N., Kausler B.X., Haubold C., Schiegg M., Ales J., Beier T., Rudy M., et al. . 2019. ilastik: interactive machine learning for (bio)image analysis. Nat. Methods. 16:1226–1232. 10.1038/s41592-019-0582-9 - DOI - PubMed
    1. Bird, A.W., and Hyman A.A.. 2008. Building a spindle of the correct length in human cells requires the interaction between TPX2 and Aurora A. J. Cell Biol. 182:289–300. 10.1083/jcb.200802005 - DOI - PMC - PubMed
    1. Brown, K.S., Blower M.D., Maresca T.J., Grammer T.C., Harland R.M., and Heald R.. 2007. Xenopus tropicalis egg extracts provide insight into scaling of the mitotic spindle. J. Cell Biol. 176:765–770. 10.1083/jcb.200610043 - DOI - PMC - PubMed
    1. Brownlee, C., and Heald R.. 2019. Importin α Partitioning to the Plasma Membrane Regulates Intracellular Scaling. Cell. 176:805–815.e8. 10.1016/j.cell.2018.12.001 - DOI - PMC - PubMed

Publication types