. 2021 Nov 17;13(620):eabh0272.
doi: 10.1126/scitranslmed.abh0272. Epub 2021 Nov 17.

Deleting DNMT3A in CAR T cells prevents exhaustion and enhances antitumor activity

Affiliations

Deleting DNMT3A in CAR T cells prevents exhaustion and enhances antitumor activity

Brooke Prinzing et al. Sci Transl Med. .

Abstract

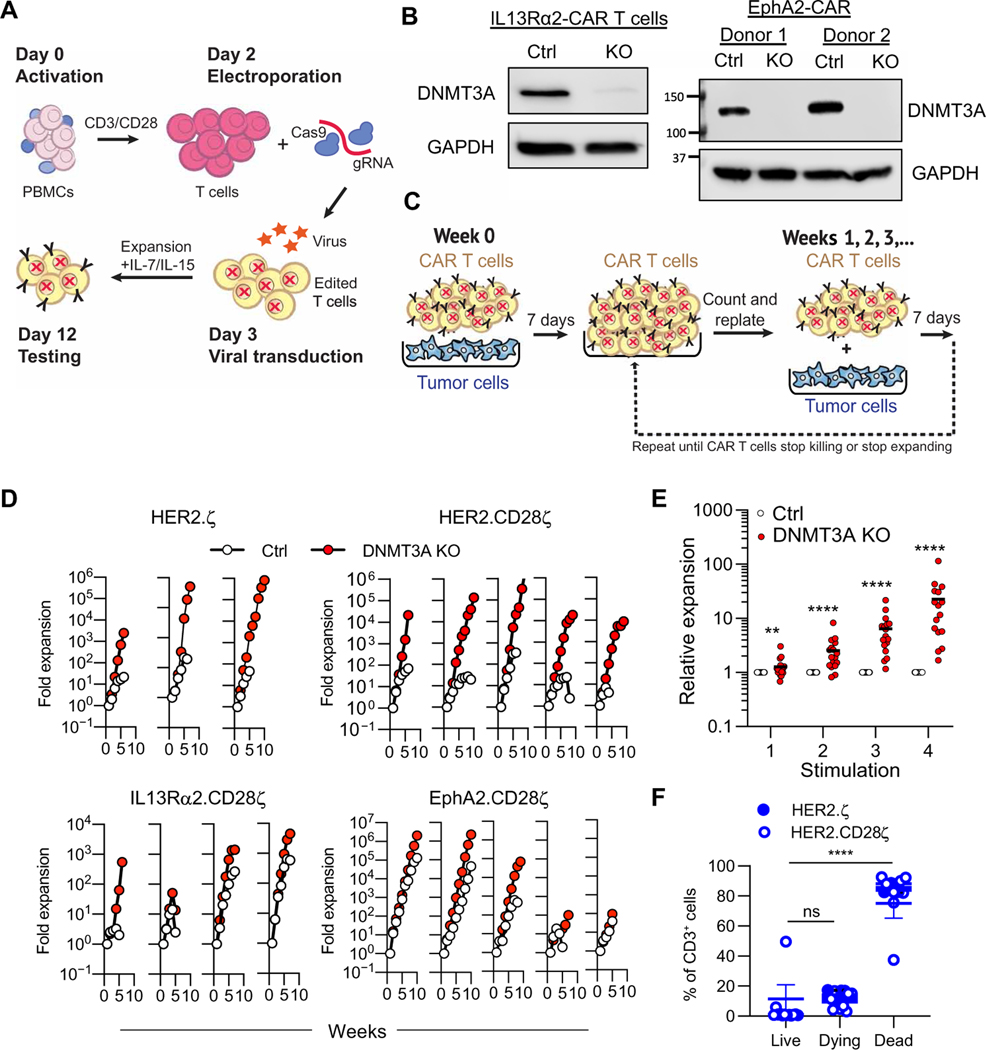
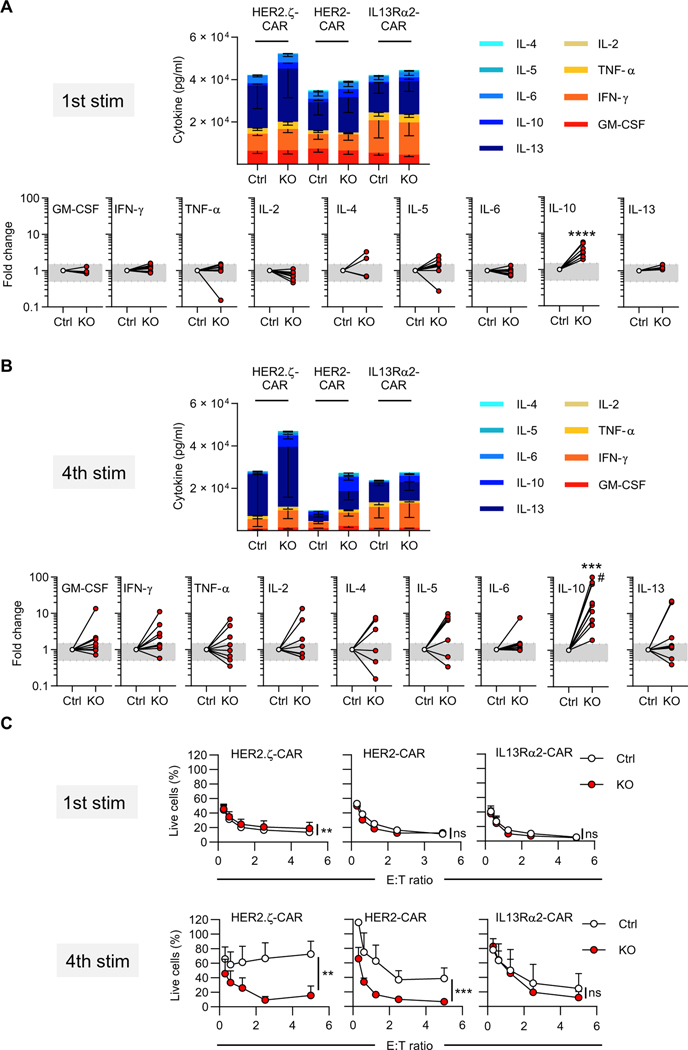
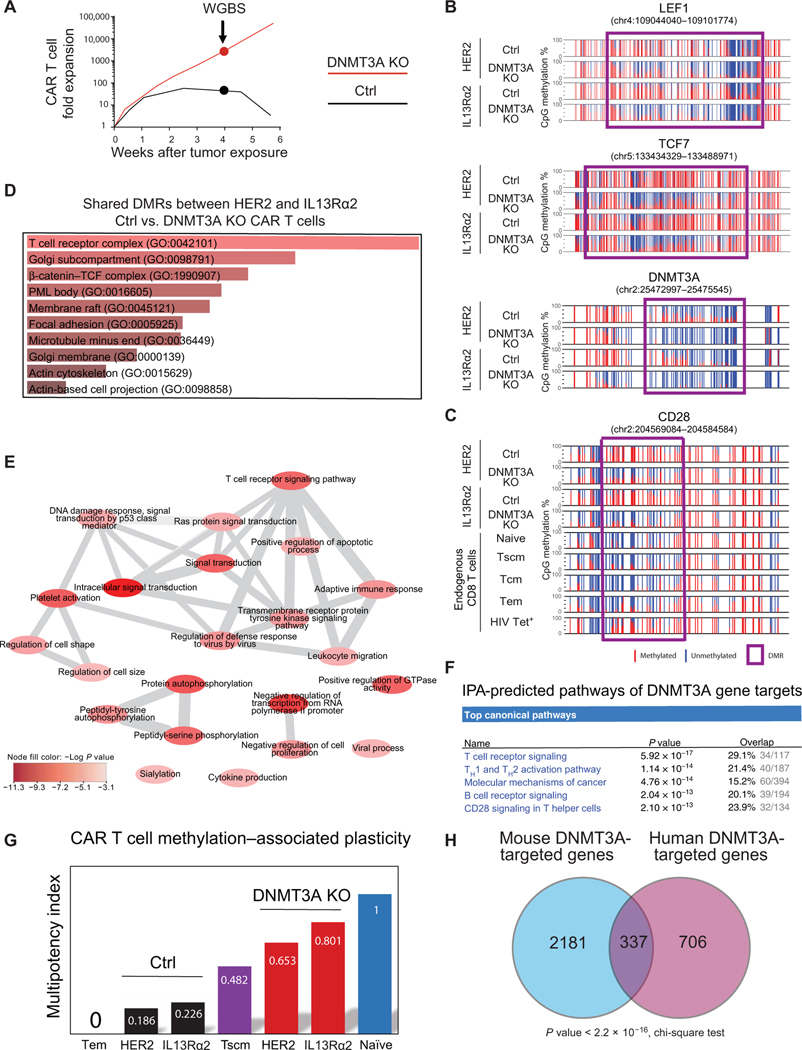
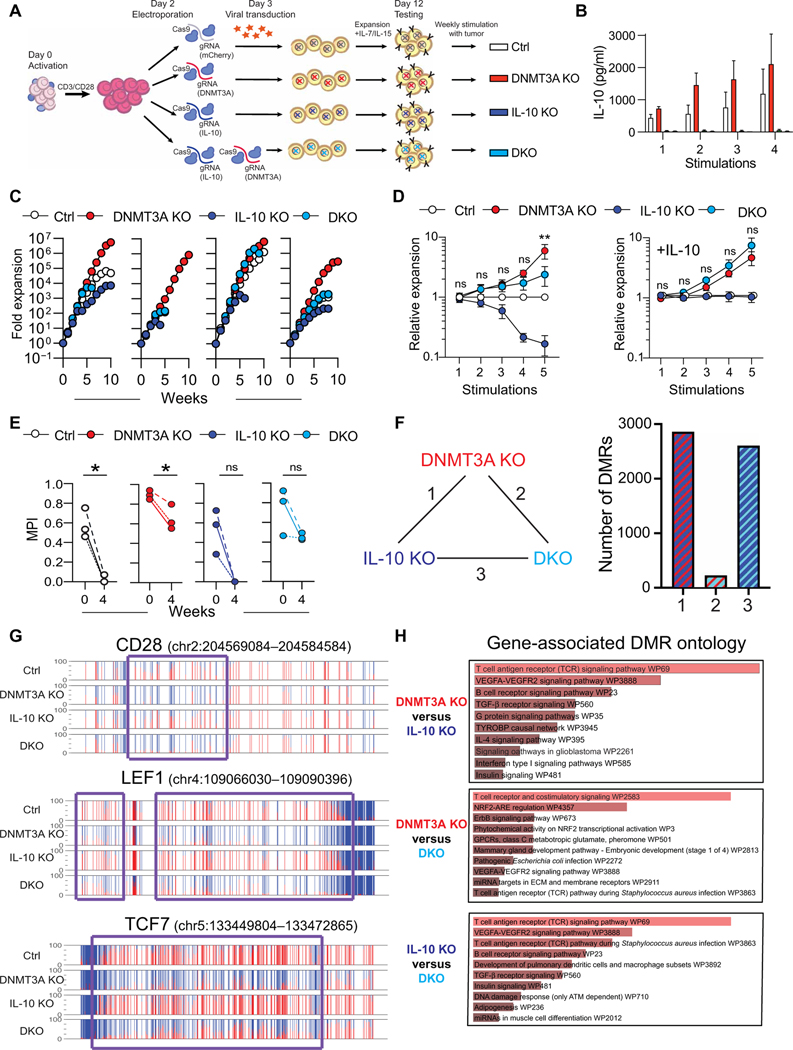
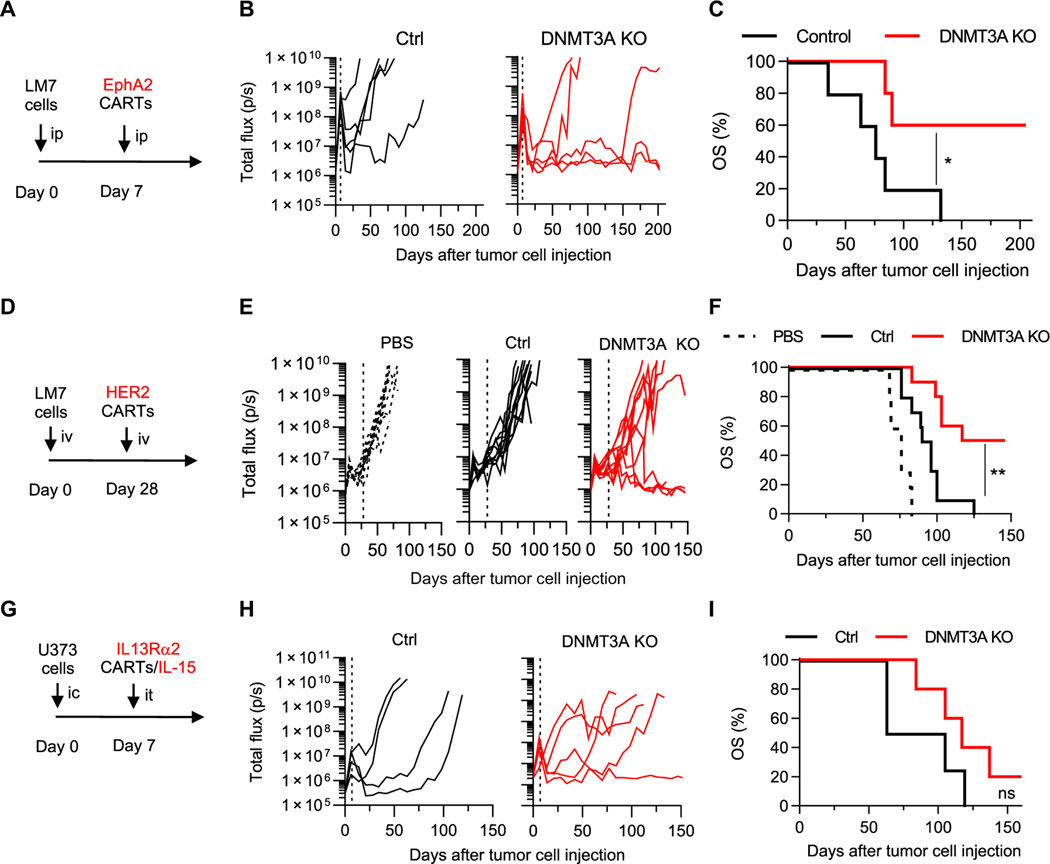
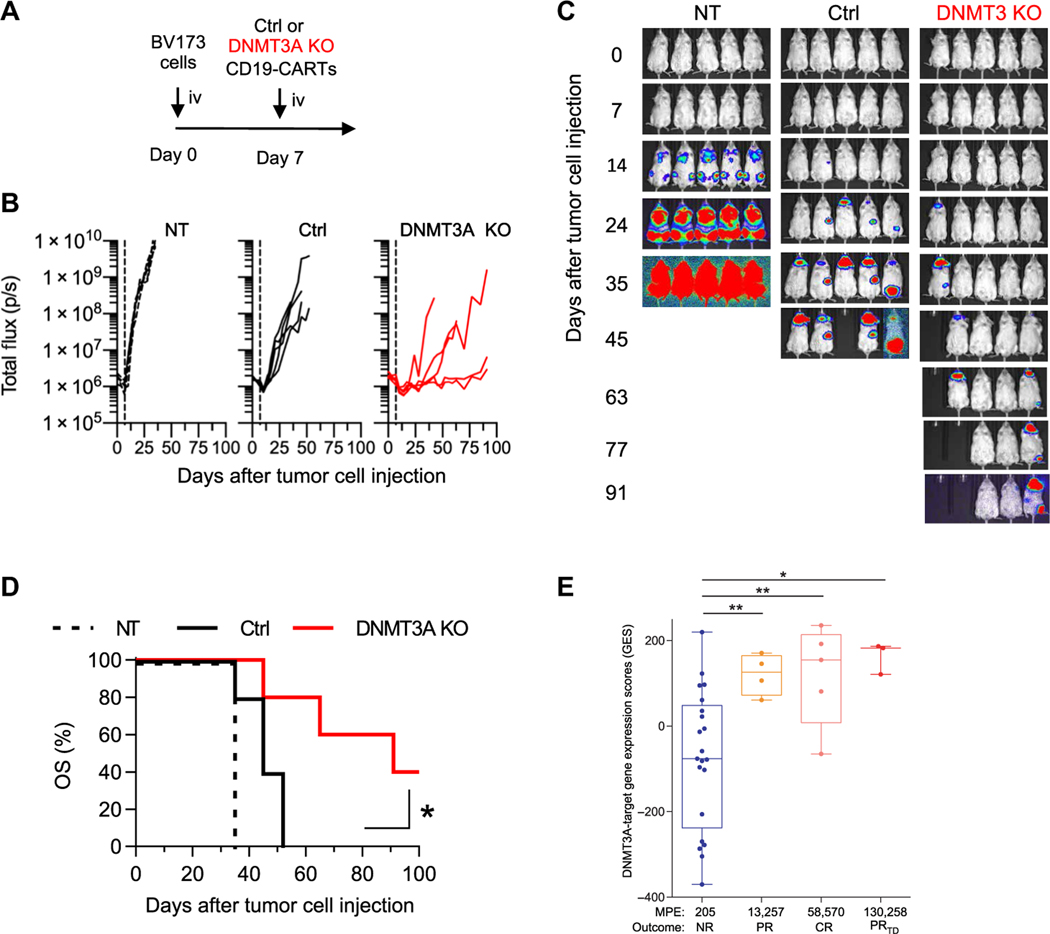
Chimeric antigen receptor (CAR) T cell therapy is revolutionizing cancer immunotherapy for patients with B cell malignancies and is now being developed for solid tumors and chronic viral infections. Although clinical trials have demonstrated the curative potential of CAR T cell therapy, a substantial and well-established limitation is the heightened contraction and transient persistence of CAR T cells during prolonged antigen exposure. The underlying mechanism(s) for this dysfunctional state, often termed CAR T cell exhaustion, remains poorly defined. Here, we report that exhaustion of human CAR T cells occurs through an epigenetic repression of the T cell’s multipotent developmental potential. Deletion of the de novo DNA methyltransferase 3 alpha (DNMT3A) in T cells expressing first- or second-generation CARs universally preserved the cells’ ability to proliferate and mount an antitumor response during prolonged tumor exposure. The increased functionality of the exhaustion-resistant DNMT3A knockout CAR T cells was coupled to an up-regulation of interleukin-10, and genome-wide DNA methylation profiling defined an atlas of genes targeted for epigenetic silencing. This atlas provides a molecular definition of CAR T cell exhaustion, which includes many transcriptional regulators that limit the “stemness” of immune cells, including CD28, CCR7, TCF7, and LEF1. Last, we demonstrate that this epigenetically regulated multipotency program is firmly coupled to the clinical outcome of prior CAR T cell therapies. These data document the critical role epigenetic mechanisms play in limiting the fate potential of human T cells and provide a road map for leveraging this information for improving CAR T cell efficacy.


Figures

Fig. 1.
Fig. 1.. DNMT3A deletion enhances CAR T cell expansion during repeat stimulation in vitro.
(A) Human T cells were transduced with retroviral vectors encoding CARs and DNMT3A was deleted using CRISPR-Cas9. gRNA, guide RNA. (B) A Western blot of DNMT3A protein expression in control (Ctrl) and DNMT3A KO (g2) IL13Rα2- and EphA2-CAR T cells is shown. GAPDH was used as a loading control; two independent donors are shown. (C) The schematic of the repeat stimulation coculture assay is shown. (D) Ctrl and DNMT3A KO CAR T cell expansion was measured after weekly stimulations with U373 cells for HER2.ζ-CAR (n = 3), HER2.CD28ζ-CAR (n = 5), IL13Rα2.CD28ζ-CAR (n = 4), or EphA2. CD28ζ-CAR (n = 5) T cells. (E) Expansion of DNMT3A KO relative to Ctrl CAR T cells at each of the first four stimulations is shown (n = 17). Data were analyzed using Mann-Whitney tests with a two-stage step-up Benjamini, Krieger, and Yekutieli procedure applied to account for multiple comparisons and a false discovery rate (FDR) set to 5%. Horizontal bars indicate means. (F) After the fourth stimulation with tumor cells, DNMT3A KO HER.ζ- or HER2.CD28ζ-CAR T cells were sorted and plated without antigen (U373 tumor cells) in the presence or absence of IL-15. After 7 days, T cells were stained with a viability dye [LIVE/DEAD Aqua (LDA)] and annexin V and classified as live (LDA, annexin V), preapoptotic/dying (LDA, annexin V+), or dead (LDA+, annexin V+) using flow cytometry. Data are presented as means ± SEM. Data were analyzed using a Kruskal-Wallis test with Dunn’s multiple comparisons test. ns, not significant; **P < 0.01 and ****P < 0.0001.
Fig. 2.
Fig. 2.. DNMT3A KO CAR T cells exhibit sustained cytokine secretion and cytolytic activity after repeat antigen stimulation.
To assess TH1 and TH2 cytokine production, Ctrl and DNMT3A KO CAR T cells were stimulated as described in Fig. 1C. Cell culture supernatants were harvested 24 hours after each stimulation, and a multiplex assay was used to determine cytokine production. (A) A summary of TH1 and TH2 cytokine production and fold change in cytokine production of Ctrl versus DNMT3A KO CAR T cells after the first stimulation with tumor cells is shown. Data are presented as means ± SEM (n = 3 per CAR construct). Gray boxes indicate a fold change from 0.5 to 1.5. Data were analyzed using a Wilcoxon signed-rank test. (B) Cytokine production as described above was measured after the fourth stimulation with fresh tumor cells. Data are presented as means ± SEM (n = 3 per CAR construct). Gray boxes indicate a fold change from 0.5 to 1.5. Data were analyzed using a Wilcoxon signed-rank test; #: value was set to 100-fold (actual value: 174-fold). (C) A 24-hour MTS assay was used to assess the cytolytic activity of Ctrl and DNMT3A KO HER.ζ-, HER2.CD28ζ-, and IL13Rα2.CD28ζ-CAR T cells at their first (1st stim) or fourth (4th stim) exposure to tumor cells at the indicated effector:target (E:T) ratios. Data are presented as means ± SEM (n = 3 to 5 per group). Data were analyzed using a two-tailed paired t test. All statistical tests compared Ctrl to DNMT3A KO; ns, not significant; **P < 0.01, ***P < 0.001, and ****P < 0.0001.
Fig. 3.
Fig. 3.. De novo methylation of T cell plasticity–associated genes is coupled to CAR T cell exhaustion.
(A) The experimental design is shown with a representative graph of Ctrl versus DNMT3A KO CAR T cell expansion with subsequent data analysis using samples collected at week 4. Cells were stimulated as described in Fig. 1C. (B) WGBS nucleotide- resolution methylation profiling of plasticity-associated signature genes including LEF1, TCF7, and DNMT3A is shown for Ctrl and DNMT3A KO CAR T cells. Individual CpG sites are represented by vertical lines, with red indicating methylation and blue indicating lack of methylation. Differentially methylated regions (DMRs) are represented by a purple box. (C) WGBS methylation profiles are shown for CD28 in Ctrl CAR T cells, DNMT3A KO CAR T cells, and endogenous CD8+ T cell subsets. (D) Gene ontology (GO) analysis of DNMT3A-targeted genes is shown. P values are based on Fisher’s exact test. PML, promyelocytic leukemia nuclear body. (E) A graph-based visualization of statistically enriched (P < 0.001) nonredundant GO biological processes regulated by DNMT3A-target genes is shown. Color intensity indicates –log P value. (F) Ingenuity pathway analysis (IPA) predicting the top canonical pathways of DNMT3A gene targets is shown. (G) A methylation-based T cell multipotency index (MPI) was used to analyze the whole-genome methylation profiles of IL13Rα2-and HER2-CAR T cells obtained after 4 weeks of repeat stimulation. (H) A Venn diagram representation of common versus unique DNMT3A-targeted genes among the current human DNMT3A KO CAR T cell analyses and published LCMV mouse exhaustion studies is shown (15). Of note, only human genes with a mouse homolog were used for the analysis.
Fig. 4.
Fig. 4.. IL-10 promotes DNMT3A KO CAR T cell survival.
(A) Activated human T cells were electroporated with Ctrl (mCherry), DNMT3A, IL-10, or DNMT3A and IL-10 (DKO) RNPs. At day 3, gene-edited T cells were transduced with retroviral vector encoding HER2.ζ-CAR. (B to E) CAR T cells were incubated with U373 tumor cells at a 2:1 E:T ratio in the presence of exogenous IL-15 and restimulated with fresh tumor cells on a weekly basis until the T cells stopped killing tumor cells. (B) Cell culture supernatants were harvested 24 hours after each stimulation, and an IL-10 ELISA was used to determine IL-10 cytokine production. Data are presented as means ± SEM (n = 5). (C) Gene-edited CAR T cell expansion was measured after weekly stimulations with U373 cells for HER2.ζ-CAR. Each graph represents one healthy donor. (D) Left: A summary graph of CAR T cell expansion (relative to Ctrl) for all donors up to five stimulations is shown (n = 4 donors). Right: A summary graph of CAR T cell expansion (relative to Ctrl) for all donors in the presence of exogenous IL-10 is shown (n = 3 donors). A two-way ANOVA with Sidak’s multiple comparisons test was used to compare DNMT3A KO and DNMT3A IL-10 DKO at each stimulation; ns, not significant; **P < 0.01. Data are presented as means ± SEM. (E) MPIs of Ctrl, IL-10 KO, DNMT3A KO, and DKO CAR T cells were measured before stimulation and after 4 weeks of chronic stimulation (n = 3). Data were analyzed by an unpaired t test; *P < 0.05. Each dot represents data from a single donor. (F) The total number of DMRs between week 4 DNMT3A KO (D3A KO), IL-10 KO, and DKO CAR T cells is shown. (G) Representative methylation profiles are shown for the CD28, LEF1, and TCF7 loci among week 4 Ctrl, DNMT3A KO, IL-10 KO, and DKO CAR T cells. DMRs are represented by a purple box. (H) GO analysis of DMRs between week 4 DNMT3A KO, IL-10 KO, and DKO CAR T cells is shown. VEGFA-VEGFR2, vascular endothelial growth factor A–vascular endothelial growth factor receptor 2; GPCRs, G protein–coupled receptors; miRNA, microRNA; ECM, extracellular matrix. TYROBP, protein tyrosine kinase-binding protein; NRF2-ARE, nuclear erythroid 2-related factor 2-antioxidant response element; ATM, ATM Serine/Threonine Kinase.
Fig. 5.
Fig. 5.. DNMT3A deletion enhances CAR T cell antitumor activity in vivo.
(A) A timeline for the intraperitoneal (ip) LM7 model is shown. NSG mice were injected intraperitoneally with 1 × 10⁶ LM7-ffLuc tumor cells on day 0 and, 7 days later, received a single intraperitoneal dose of 1 × 10⁵ Ctrl or DNMT3A KO EphA2.CD28ζ-CAR T cells (CARTs). (B) Quantitative bioluminescence imaging is shown as total flux in photons per second (p/s). The vertical dashed line indicates time of CAR T cell injection. (C) A Kaplan-Meier curve shows overall survival (OS) of Ctrl or DNMT3A KO CAR T cell–treated mice (n = 5 mice per group). Data were analyzed using a log-rank (Mantel-Cox) test; *P < 0.05. (D) A timeline for the intravenous (iv) LM7 model is shown. NSG mice were injected intravenously with 2 × 10⁶ LM7-ffLuc tumor cells and, 28 days later, received a single intravenous dose of 1 × 10⁶ Ctrl or DNMT3A KO HER2.ζ-CAR T cells or PBS. (E) Quantitative bioluminescence imaging is shown as total flux. The vertical dashed line indicates time of CAR T cell injection. (F) A Kaplan-Meier survival curve is shown (n = 5 mice per group). Data were analyzed using a log-rank (Mantel-Cox) test; **P < 0.01. (G) A timeline for the intracranial (ic) U373 model is shown. NSG mice were injected with 5 × 10⁴ U373-ffLuc tumor cells (intracranially) and, 7 days later, received a single intratumoral (it) dose of 2 × 10⁶ Ctrl or DNMT3A KO IL13Rα2-CAR/IL-15 T cells. (H) Quantitative bioluminescence imaging is shown as total flux. The vertical dashed line indicates time of CAR T cell injection. (I) A Kaplan-Meier survival curve is shown (Ctrl: n = 4 mice, KO: n = 5 mice). Data were analyzed using a log-rank (Mantel-Cox) test; ns, not significant.
Fig. 6.
Fig. 6.. DNMT3A-mediated gene expression programs regulate CD19-CAR T cell antitumor responses in vivo and predict the clinical outcome.
(A) A timeline of intravenous (iv) BV173 model is shown. NSG mice that were injected intravenously with 3 × 10⁶ BV173-ffLuc tumor cells on day 0 received a single intravenous dose of 2 × 10⁶ NT (non-transduced), Ctrl, or DNMT3A KO CD19.41BBζ-CAR T cells 7 days later. (B) Quantitative bioluminescence imaging (total flux) data are shown for each mouse. (C) Representative bioluminescence images of each treatment group are shown. (D) Kaplan-Meier survival curve with log-rank test for significance (n = 5 mice per group; *P < 0.05). (E) DNMT3A-targeted gene expression is shown for CAR T cell products before infusion. Patients were separated on the basis of in vivo expansion and clinical response [NR, nonresponders (n = 21); PR, partial responders (n = 4); CR, complete responders (n = 5); PRTD, PRs followed by relapse with transformed B cell lymphoma (n = 3)] after CD19-CAR T cell infusion for CLL. MPE indicates median peak expansion. Statistical significance was determined by a Mann-Whitney test. Error bars are defined on the basis of the minimum and maximum quartile; *P < 0.05 and **P < 0.01.

References

    1. Park JH, Geyer MB, Brentjens RJ, CD19-targeted CAR T-cell therapeutics for hematologic malignancies: Interpreting clinical outcomes to date. Blood 127, 3312–3320 (2016). - PMC - PubMed
    1. Maude SL, Laetsch TW, Buechner J, Rives S, Boyer M, Bittencourt H, Bader P, Verneris MR, Stefanski HE, Myers GD, Qayed M, De Moerloose B, Hiramatsu H, Schlis K, Davis KL, Martin PL, Nemecek ER, Yanik GA, Peters C, Baruchel A, Boissel N, Mechinaud F, Balduzzi A, Krueger J, June CH, Levine BL, Wood P, Taran T, Leung M, Mueller KT, Zhang Y, Sen K, Lebwohl D, Pulsipher MA, Grupp SA, Tisagenlecleucel in children and young adults with B-cell lymphoblastic leukemia. N. Engl. J. Med. 378, 439–448 (2018). - PMC - PubMed
    1. Fraietta JA, Lacey SF, Orlando EJ, Pruteanu-Malinici I, Gohil M, Lundh S, Boesteanu AC, Wang Y, O’Connor RS, Hwang WT, Pequignot E, Ambrose DE, Zhang C, Wilcox N, Bedoya F, Dorfmeier C, Chen F, Tian L, Parakandi H, Gupta M, Young RM, Johnson FB, Kulikovskaya I, Liu L, Xu J, Kassim SH, Davis MM, Levine BL, Frey NV, Siegel DL, Huang AC, Wherry EJ, Bitter H, Brogdon JL, Porter DL, June CH, Melenhorst JJ, Determinants of response and resistance to CD19 chimeric antigen receptor (CAR) T cell therapy of chronic lymphocytic leukemia. Nat. Med. 24, 563–571 (2018). - PMC - PubMed
    1. Ahmed N, Brawley VS, Hegde M, Robertson C, Ghazi A, Gerken C, Liu E, Dakhova O, Ashoori A, Corder A, Gray T, Wu MF, Liu H, Hicks J, Rainusso N, Dotti G, Mei Z, Grilley B, Gee A, Rooney CM, Brenner MK, Heslop HE, Wels WS, Wang LL, Anderson P, Gottschalk S, Human epidermal growth factor receptor 2 (HER2)-specific chimeric antigen receptor-modified T cells for the immunotherapy of HER2-positive sarcoma. J. Clin. Oncol. 33, 1688–1696 (2015). - PMC - PubMed
    1. Beatty GL, O’Hara MH, Lacey SF, Torigian DA, Nazimuddin F, Chen F, Kulikovskaya IM, Soulen MC, McGarvey M, Nelson AM, Gladney WL, Levine BL, Melenhorst JJ, Plesa G, June CH, Activity of mesothelin-specific chimeric antigen receptor t cells against pancreatic carcinoma metastases in a phase 1 trial. Gastroenterology 155, 29–32 (2018). - PMC - PubMed

Publication types