. 2021 Nov 17;16(11):e0259700.
doi: 10.1371/journal.pone.0259700. eCollection 2021.

Evaluation of the United States COVID-19 vaccine allocation strategy

Affiliations

Evaluation of the United States COVID-19 vaccine allocation strategy

Md Rafiul Islam et al. PLoS One. .

Abstract

Background: Anticipating an initial shortage of vaccines for COVID-19, the Centers for Disease Control (CDC) in the United States developed priority vaccine allocations for specific demographic groups in the population. This study evaluates the performance of the CDC vaccine allocation strategy with respect to multiple potentially competing vaccination goals (minimizing mortality, cases, infections, and years of life lost (YLL)), under the same framework as the CDC allocation: four priority vaccination groups and population demographics stratified by age, comorbidities, occupation and living condition (congested or non-congested).

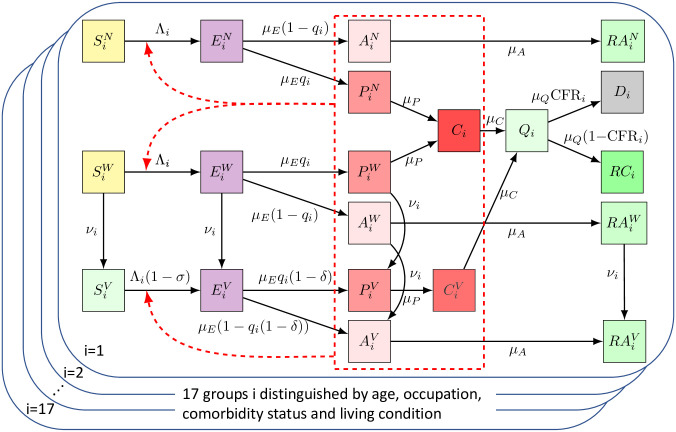
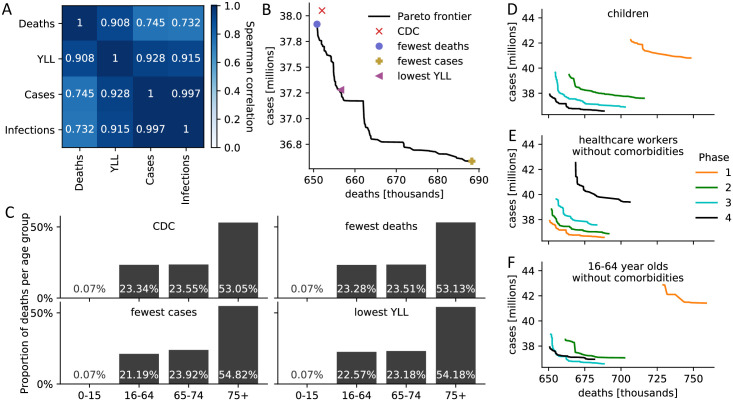
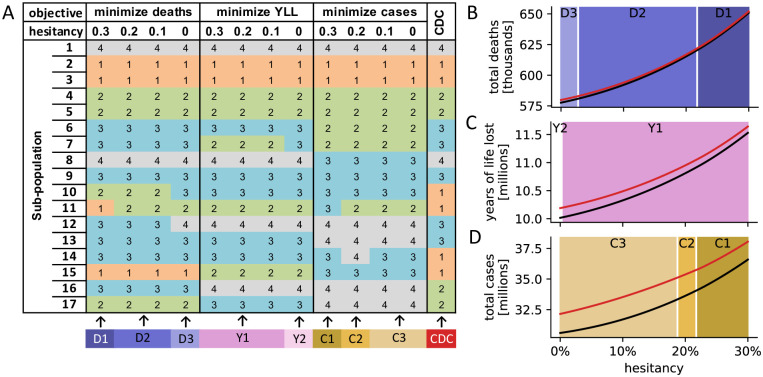
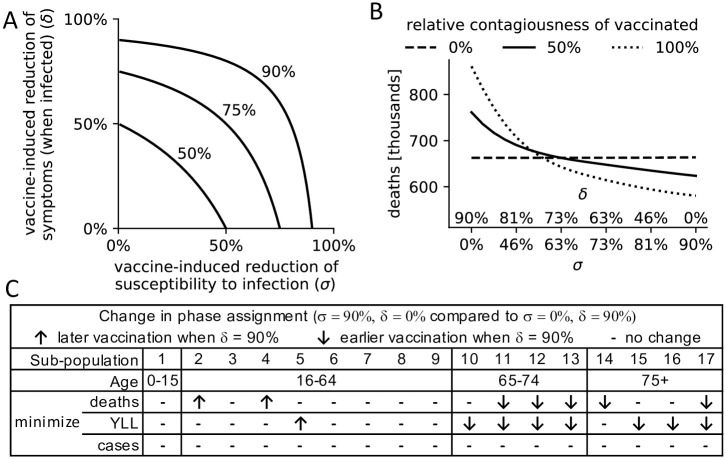
Methods and findings: We developed a compartmental disease model that incorporates key elements of the current pandemic including age-varying susceptibility to infection, age-varying clinical fraction, an active case-count dependent social distancing level, and time-varying infectivity (accounting for the emergence of more infectious virus strains). The CDC allocation strategy is compared to all other possibly optimal allocations that stagger vaccine roll-out in up to four phases (17.5 million strategies). The CDC allocation strategy performed well in all vaccination goals but never optimally. Under the developed model, the CDC allocation deviated from the optimal allocations by small amounts, with 0.19% more deaths, 4.0% more cases, 4.07% more infections, and 0.97% higher YLL, than the respective optimal strategies. The CDC decision to not prioritize the vaccination of individuals under the age of 16 was optimal, as was the prioritization of health-care workers and other essential workers over non-essential workers. Finally, a higher prioritization of individuals with comorbidities in all age groups improved outcomes compared to the CDC allocation.

Conclusion: The developed approach can be used to inform the design of future vaccine allocation strategies in the United States, or adapted for use by other countries seeking to optimize the effectiveness of their vaccine allocation strategies.


Conflict of interest statement

The authors have declared that no competing interests exist.

Figures

Fig 1
Fig 1. Overview of the model.
Upon infection, susceptible individuals (left most column) transition through the various disease compartments (middle columns) until reaching a final compartment (death or recovery; right most columns). All pre-clinical, clinical and asymptomatic individuals may cause new infections (red dashed box). A detailed description of the various compartments and parameters can be found in Table 1 and the Detailed Methods section.
Fig 2
Fig 2. Comparison of CDC and optimal vaccine allocation strategies.
(A) Spearman correlation between four measures of disease burden based on a complete comparison of all 17.5 million meaningful four-phase vaccine allocation strategies. (B) Pareto frontier of all optimal strategies based on a global search of all 17.5 million meaningful vaccine allocation strategies. For strategies on the Pareto frontier, there exists no other strategy that performs better in one objective (minimizing deaths or cases) while not performing worse in the other objective. The death and case count resulting from four specific allocations is highlighted. (C) For the four strategies highlighted in (B), the distribution of all resulting deaths across the four age groups is shown as a measure of equity. (D-F) Pareto frontiers of all optimal strategies are shown when restricting (D) children, (E) healthcare workers without comorbidities, (F) 16–64 year old without comorbidities and without an essential occupation to a certain priority phase. S8 Fig contains Pareto frontiers for all sub-populations.
Fig 3
Fig 3. Dependency of findings on vaccine hesitancy.
(A) For different levels of vaccine hesitancy (30%, 20%, 10%, 0%), the optimal vaccine allocation strategies with respect to three objectives (top row) are shown, in addition to the CDC allocation. Sub-populations 1–17 are defined as in Table 2. (B-D) Comparison of outcomes (total deaths (B), years of life lost (C) and total cases (D)) when using the respective optimal allocation strategy from (A; black line) and the CDC strategy (red line), for any vaccine hesitancy between 0% and 30%. The background color indicates which of the allocation strategies, identified in (A; bottom row), was optimal for a specific level of hesitancy.
Fig 4
Fig 4. Dependency of findings on vaccine function.
(A) A continuum of combinations of σ, the reduction of infections among vaccinated, and δ, the reduction of symptomatic infections among vaccinated infected individuals, can lead to a vaccine effectiveness of 50%, 75% or 90%. (B) Total deaths (y-axis) under a variety of scenarios, assuming a vaccine effectiveness of 90% and the use of the CDC allocation strategy. Scenarios differ in the relative contribution of σ and δ to the vaccine effectiveness (x-axis, see (A)), and the relative contagiousness of vaccinated individuals (compared to non-vaccinated), specified by line type (dashed: 0%, solid: 50%, dotted: 100%). (C) For three different objectives, the optimal vaccine allocation strategies are compared between two vaccines of extreme function: a vaccine that solely prevents infections (σ = 90%, δ = 0%) and a vaccine that solely prevents symptoms among infected individuals ((σ = 0%, δ = 90%). Sub-populations (defined as in Table 2) that are allocated to a later (earlier) priority phase in the latter vaccine are indicated by ↑ (↓). S4 Table contains the specific phase assignments for each sub-population.

References

    1. Dooling K, McClung N, Chamberland M, Marin M, Wallace M, Bell BP, et al.. The Advisory Committee on Immunization Practices’ Updated Interim Recommendation for Allocating Initial Supplies of COVID-19 Vaccine—United States, 2020. Morbidity and Mortality Weekly Report. 2021;69(51-52):1657–1660. doi: 10.15585/mmwr.mm695152e2 - DOI - PMC - PubMed
    1. Dooling K, Marin M, Wallace M, McClung N, Chamberland M, Lee GM, et al.. The Advisory Committee on Immunization Practices’ Interim Recommendation for Allocating Initial Supplies of COVID-19 Vaccine—United States, 2020. Morbidity and Mortality Weekly Report. 2020;69(49):1857–1859. - PMC - PubMed
    1. Ferranna M, Cadarette D, Bloom DE. COVID-19 Vaccine Allocation: Modeling Health Outcomes and Equity Implications of Alternative Strategies. Engineering. 2021;. doi: 10.1016/j.eng.2021.03.014 - DOI - PMC - PubMed
    1. Buckner JH, Chowell G, Springborn MR. Dynamic prioritization of COVID-19 vaccines when social distancing is limited for essential workers. Proceedings of the National Academy of Sciences. 2021;118(16). doi: 10.1073/pnas.2025786118 - DOI - PMC - PubMed
    1. Moore S, Hill EM, Dyson L, Tildesley MJ, Keeling MJ. Modelling optimal vaccination strategy for SARS-CoV-2 in the UK. PLoS computational biology. 2021;17(5):e1008849. doi: 10.1371/journal.pcbi.1008849 - DOI - PMC - PubMed

Substances