Review
. 2022 Feb 4;220(2):iyab173.
doi: 10.1093/genetics/iyab173.

Phylogenomic approaches to detecting and characterizing introgression

Affiliations
Review

Phylogenomic approaches to detecting and characterizing introgression

Mark S Hibbins et al. Genetics. .

Erratum in

Abstract

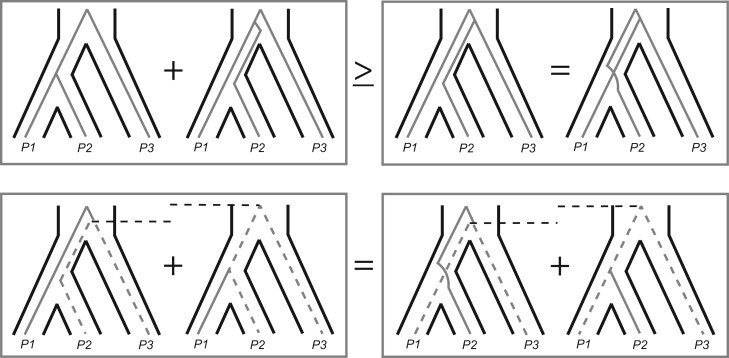
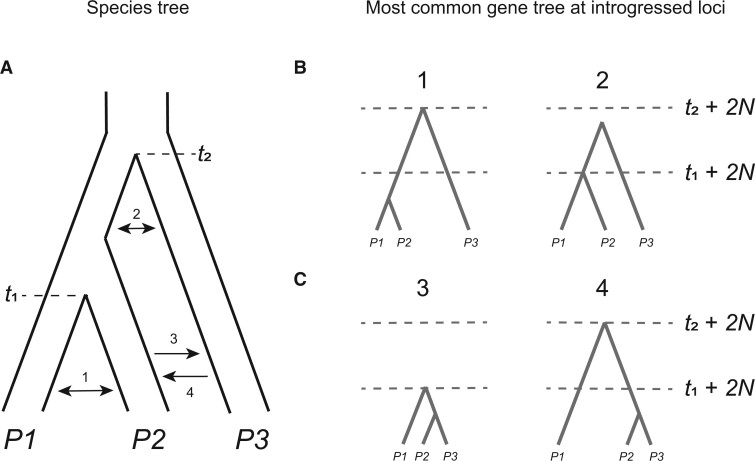
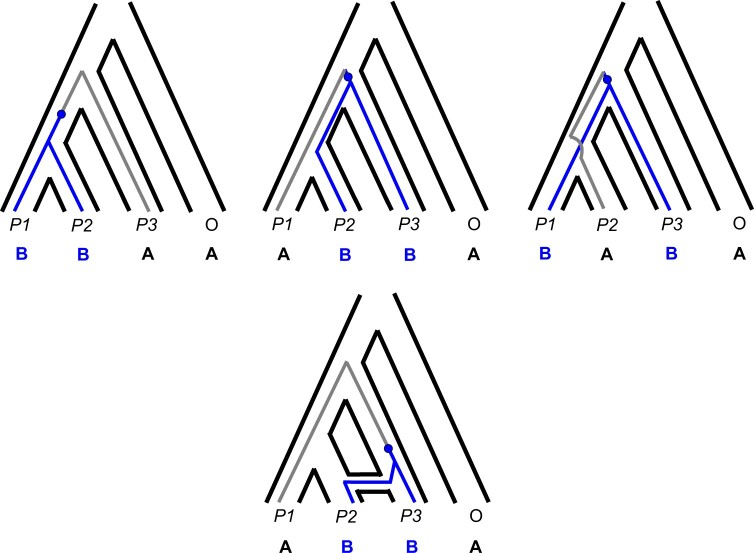
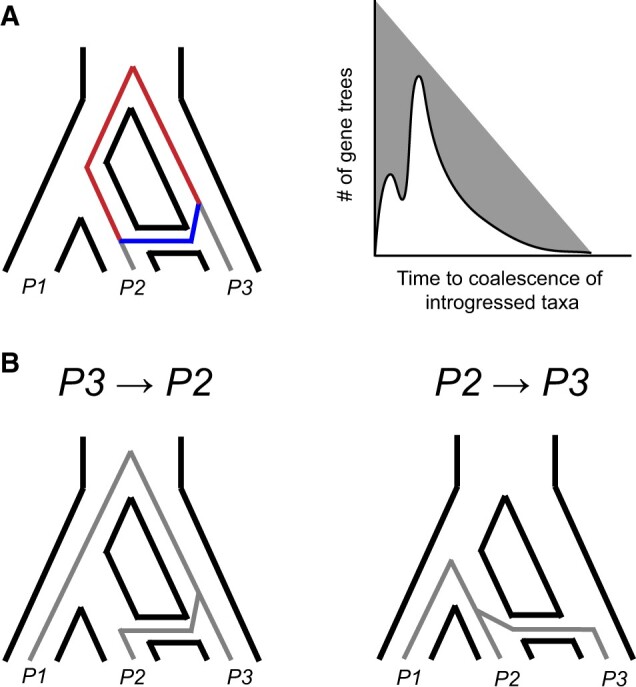
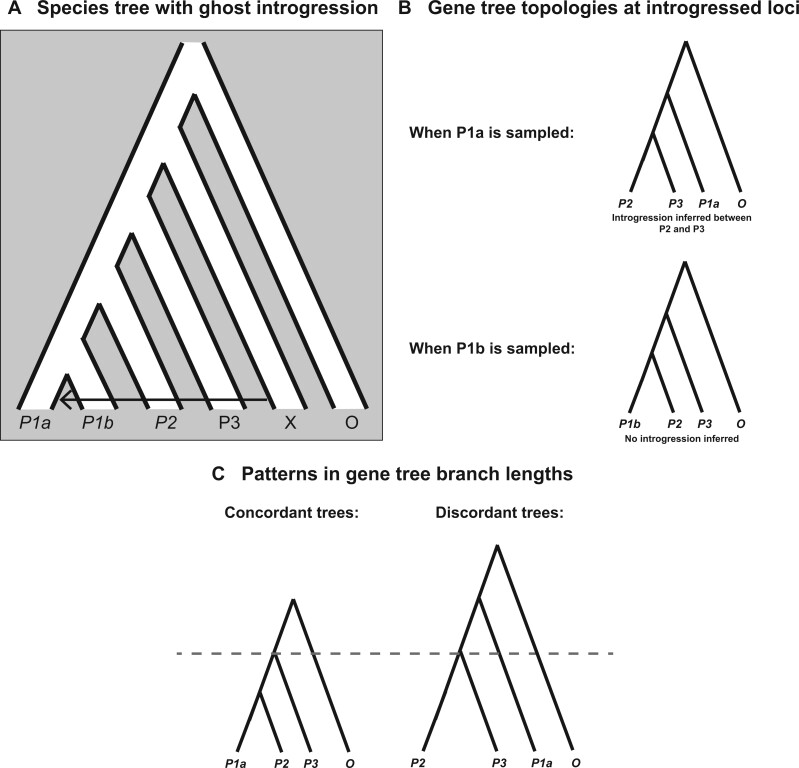
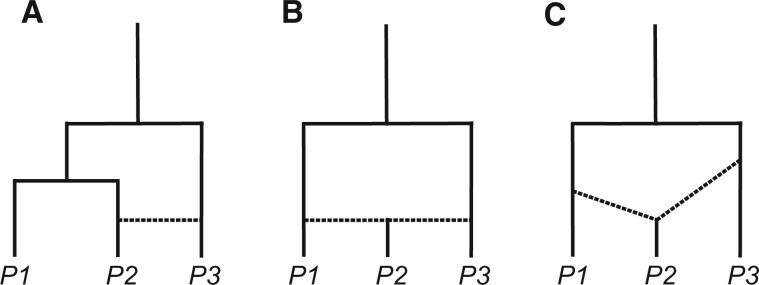
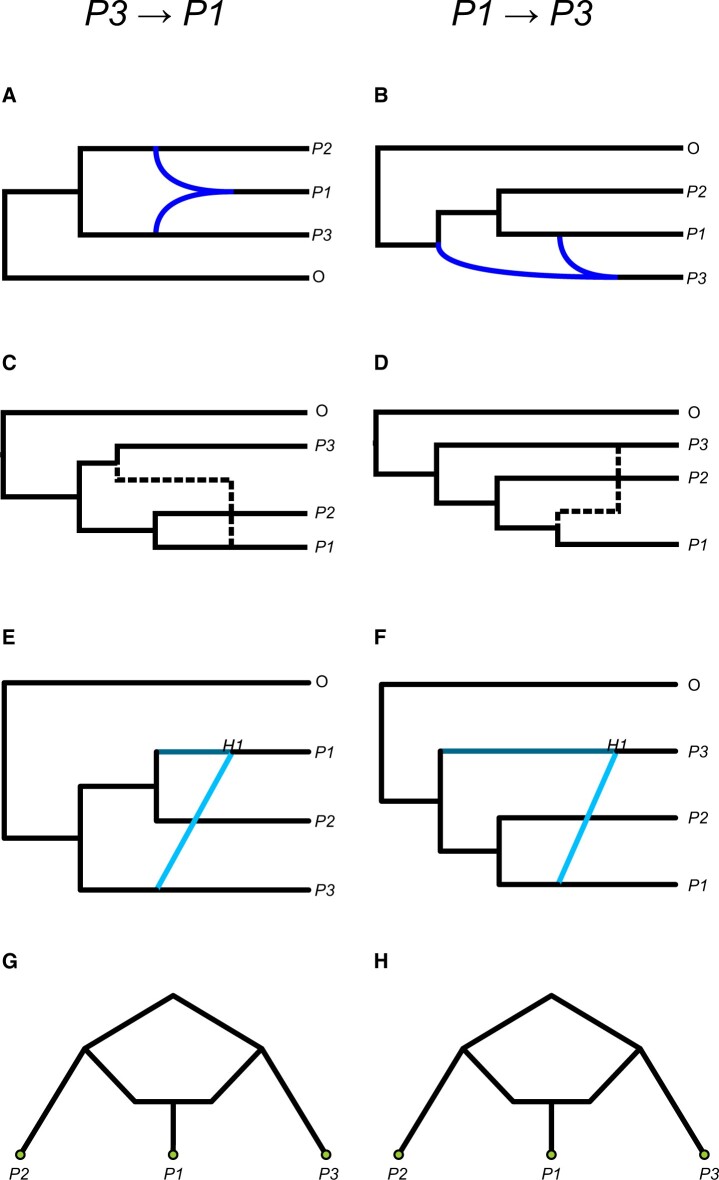
Phylogenomics has revealed the remarkable frequency with which introgression occurs across the tree of life. These discoveries have been enabled by the rapid growth of methods designed to detect and characterize introgression from whole-genome sequencing data. A large class of phylogenomic methods makes use of data across species to infer and characterize introgression based on expectations from the multispecies coalescent. These methods range from simple tests, such as the D-statistic, to model-based approaches for inferring phylogenetic networks. Here, we provide a detailed overview of the various signals that different modes of introgression are expected leave in the genome, and how current methods are designed to detect them. We discuss the strengths and pitfalls of these approaches and identify areas for future development, highlighting the different signals of introgression, and the power of each method to detect them. We conclude with a discussion of current challenges in inferring introgression and how they could potentially be addressed.

Keywords: hybridization; introgression; phylogenomic methods; phylogenomics.


Figures

Figure 1
Figure 1
Expected gene tree topologies and coalescence times under ILS only. For a rooted triplet, four topologies are possible (top row): two concordant with the species tree, which can result either from lineage sorting or ILS (top left), and two that are discordant with the species tree and arise from ILS only (top right). The two concordant trees must be at least as frequent as the two discordant trees, which are equally frequent to each other. For nonsister pairs of taxa—either P2–P3 (bottom left) or P1–P3 (bottom right)—coalescence is expected to occur at one of two times, depending on whether they coalesce first or second in a gene tree (gray dotted lines). These expected times are symmetrical across gene trees, and so pairwise divergences between the nonsister lineages are expected to be equal when averaged across loci.
Figure 2
Figure 2
An overview of detectable introgression scenarios for a rooted triplet, and their effects on gene tree frequencies and branch lengths. (A) The species tree relating three lineages, with speciation times t1 and t2 labeled. Introgression can occur between extant (1) or ancestral (2) sister lineages, or between nonsister taxa, with P3 as either the recipient (3) or the donor (4). (B) Gene trees at introgressed loci for introgression between sister lineages. Gray dashes denote the expected coalescence times under ILS only. Introgression between sister taxa reduces divergence between the involved taxa but does not generate discordant gene trees (events 1 and 2). In both trees the expected time to coalescence for pairs of lineages in the absence of introgression is denoted with dashed horizontal lines. (C) Gene trees at introgressed loci for introgression between nonsister lineages. When P3 is the recipient of introgression (event 3), discordant gene trees are generated uniting P2 and P3. In addition, divergence is reduced between both P2 and P3 and between P1 and P3. When P3 is the donor of introgression (event 4) discordant gene trees are again generated uniting P2 and P3. In this case divergence is reduced only between P2 and P3, while divergence is increased between P1 and P2. In both trees, the expected time to coalescence for pairs of lineages in the absence of introgression is denoted with dashed horizontal lines.
Figure 3
Figure 3
Biallelic site patterns are informative of underlying gene tree topologies. Except for low levels of homoplasy, such patterns can only arise from mutations (blue) on internal branches of the local genealogy. The occurrence of the incongruent site patterns “ABBA” (top middle) and “BABA” (top right) are therefore expected to reflect the frequency of discordant gene tree topologies. With introgression between a specific nonsister species pair, one incongruent pattern (bottom) can increase in frequency over the other due to the underlying asymmetry in gene tree frequencies.
Figure 4
Figure 4
Coalescence times provide information on the timing, direction, and presence of introgression. (A) Postspeciation introgression between P2 and P3 allows them to coalesce more quickly at introgressed loci (blue). This reduces their whole-genome divergence relative to P1 and P3, an asymmetry that can be used to test for introgression. Since coalescence can now occur at one of two times, after introgression (blue) or after speciation (red), it also results in a bimodal distribution of coalescence times across loci (right figure). The more recent peak of this distribution can be used to estimate the timing of introgression. (B) The direction of introgression between P2 and P3 affects the time to coalesce of P1 and P3 at introgressed loci. P2P3 introgression allows P1 and P3 to coalesce more quickly (right), reducing their divergence at introgressed loci.
Figure 5
Figure 5
Understanding and detecting ghost introgression. (A) A scenario of ghost introgression from an unsampled outgroup lineage, X, into P1a. (B) When ghost introgression has occurred and a quartet including P1a is sampled, introgression may be erroneously inferred between P2 and P3. This occurs because at some introgressed loci P1a will be more distantly related to both P2 and P3, leading to an excess of discordant trees with P2 and P3 sister to one another (top). If instead a quartet including P1b is sampled, there should no longer be an excess of discordant trees (bottom). (C) Ghost introgression should also be detectable via a change (or a lack of change) in branch lengths. True introgression between P2 and P3 should cause them to be more similar; i.e., shorter branch lengths separating them in discordant trees. In contrast, ghost introgression will not make them more closely related in discordant trees than in concordant trees on average. Similarly, the distance between P1a and all ingroup lineages will be higher when it is the recipient of ghost introgression from an outgroup.
Figure 6
Figure 6
Conceptualizing different models of introgression. (A) Introgression between extant lineages. (B, C) Introgression that results in the formation of a new lineage, differing only with respect to whether there appears to be a period of independent evolution before lineage formation.
Figure 7
Figure 7
Different visualizations of the same underlying phylogenetic networks. The left column comes from a network representing P3P1 introgression, while the right column comes from a network representing P1P3 introgression. The rows, from top to bottom, show visualizations from (A, B) Dendroscope; (C, D) IcyTree; (E, F) PhyloPlots; and (G, H) admixturegraph.

References

    1. Adams RH, Schield DR, Card DC, Castoe TA.. 2018. Assessing the impacts of positive selection on coalescent-based species tree estimation and species delimitation. Syst Biol. 67:1076–1090. - PubMed
    1. Ai H, Fang X, Yang B, Huang Z, Chen H, et al.2015. Adaptation and possible ancient interspecies introgression in pigs identified by whole-genome sequencing. Nat Genet. 47:217–225. - PubMed
    1. Akaike H. 1974. A new look at the statistical model identification. IEEE Trans Automat Contr. 19:716–723.
    1. Anderson EC, , Thompson EA.. 2002. A model-based method for identifying species hybrids using multilocus genetic data. Genetics. 160:1217–1229. - PMC - PubMed
    1. Baum DA. 2007. Concordance trees, concordance factors, and the exploration of reticulate genealogy. Taxon. 56:417–426.

Publication types