. 2021 Nov 16;37(7):110003.
doi: 10.1016/j.celrep.2021.110003.

ADH5-mediated NO bioactivity maintains metabolic homeostasis in brown adipose tissue

Affiliations

ADH5-mediated NO bioactivity maintains metabolic homeostasis in brown adipose tissue

Sara C Sebag et al. Cell Rep. .

Abstract

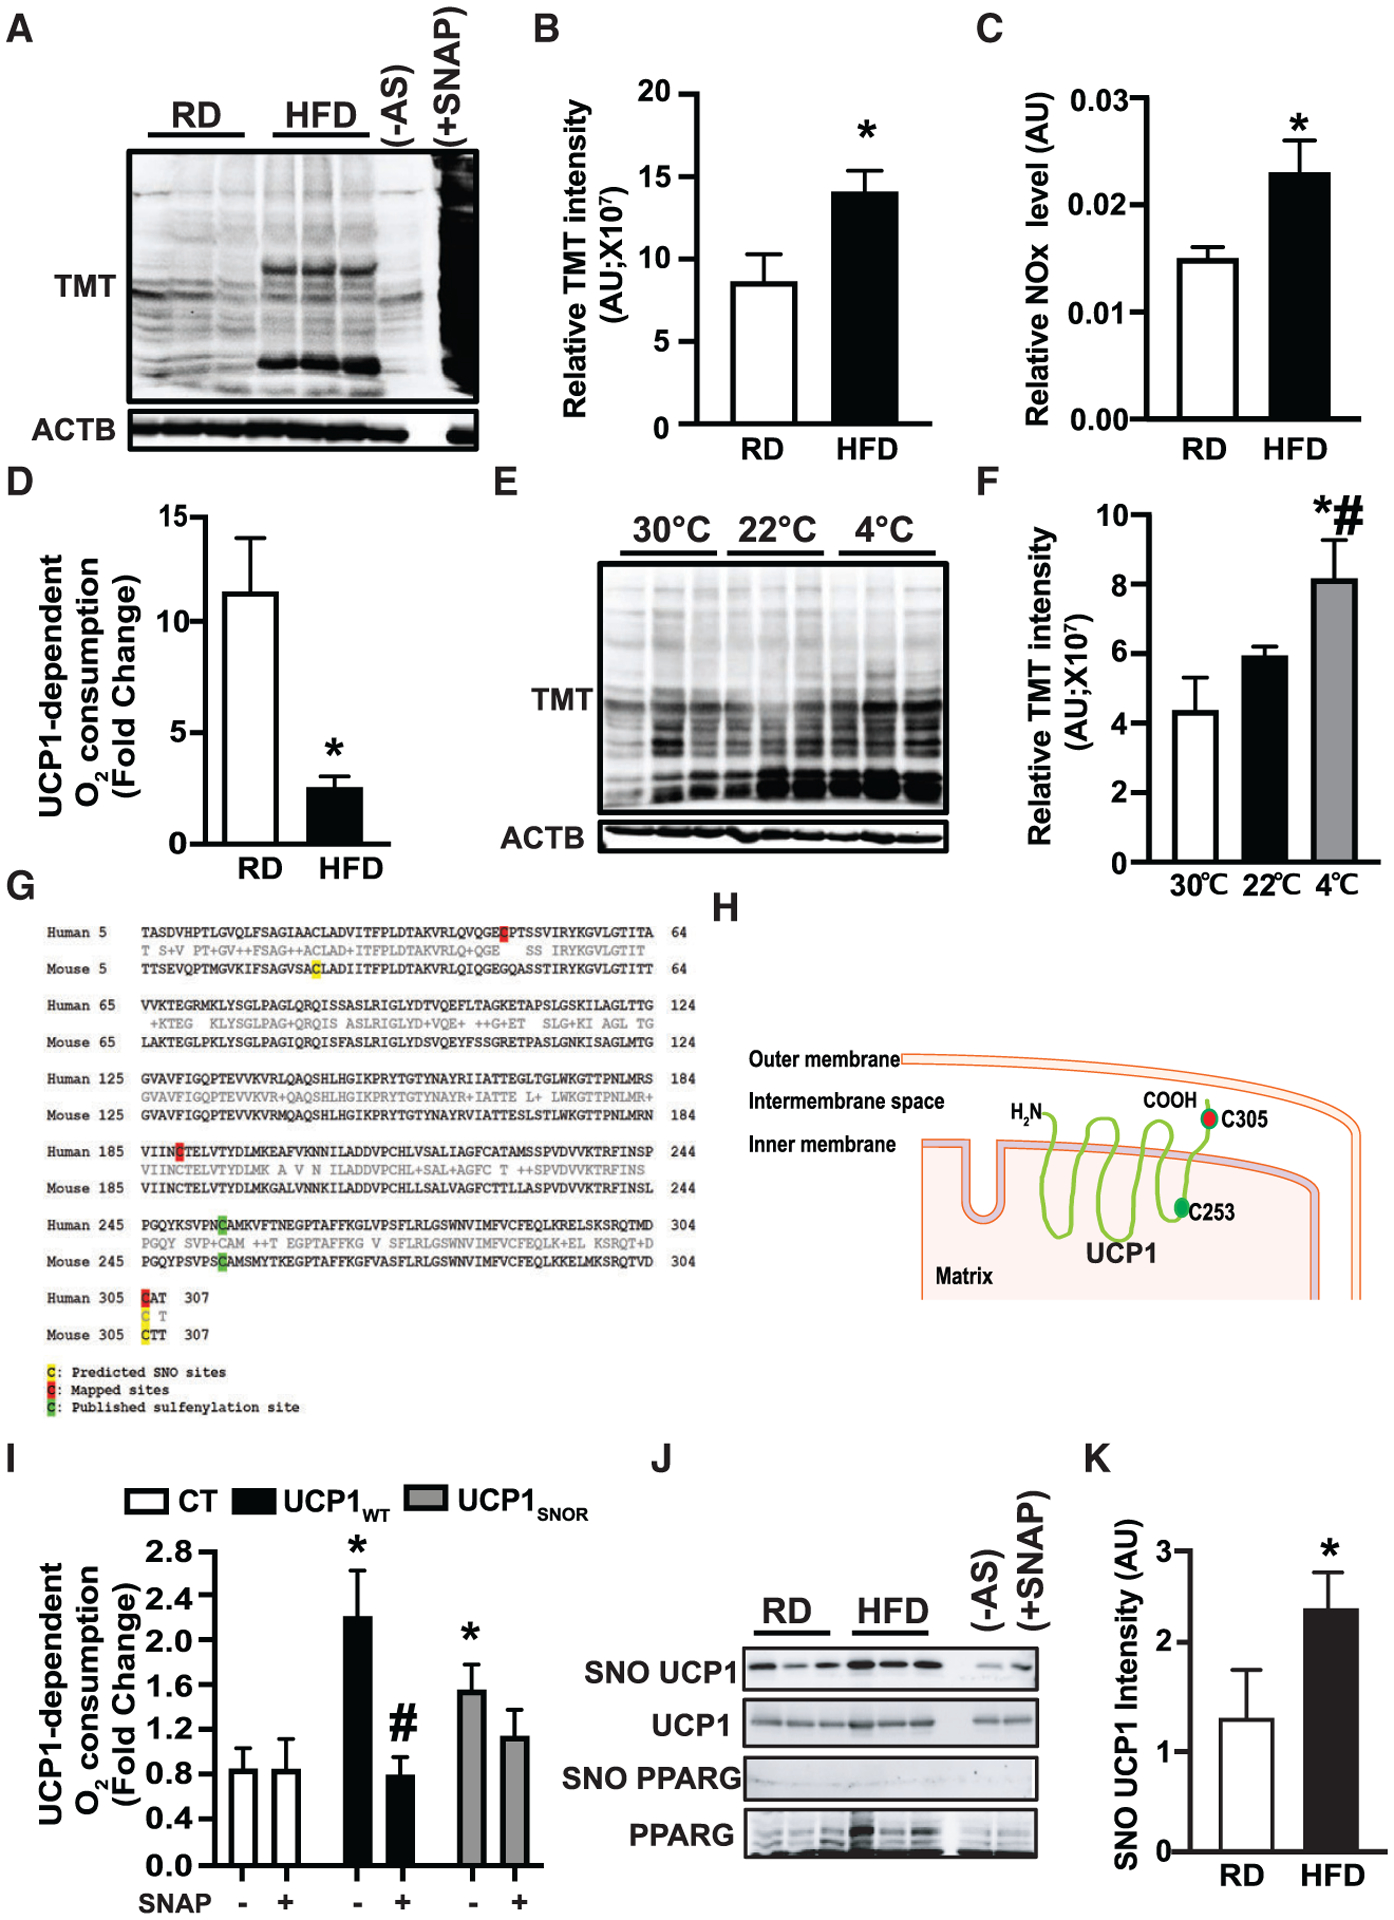
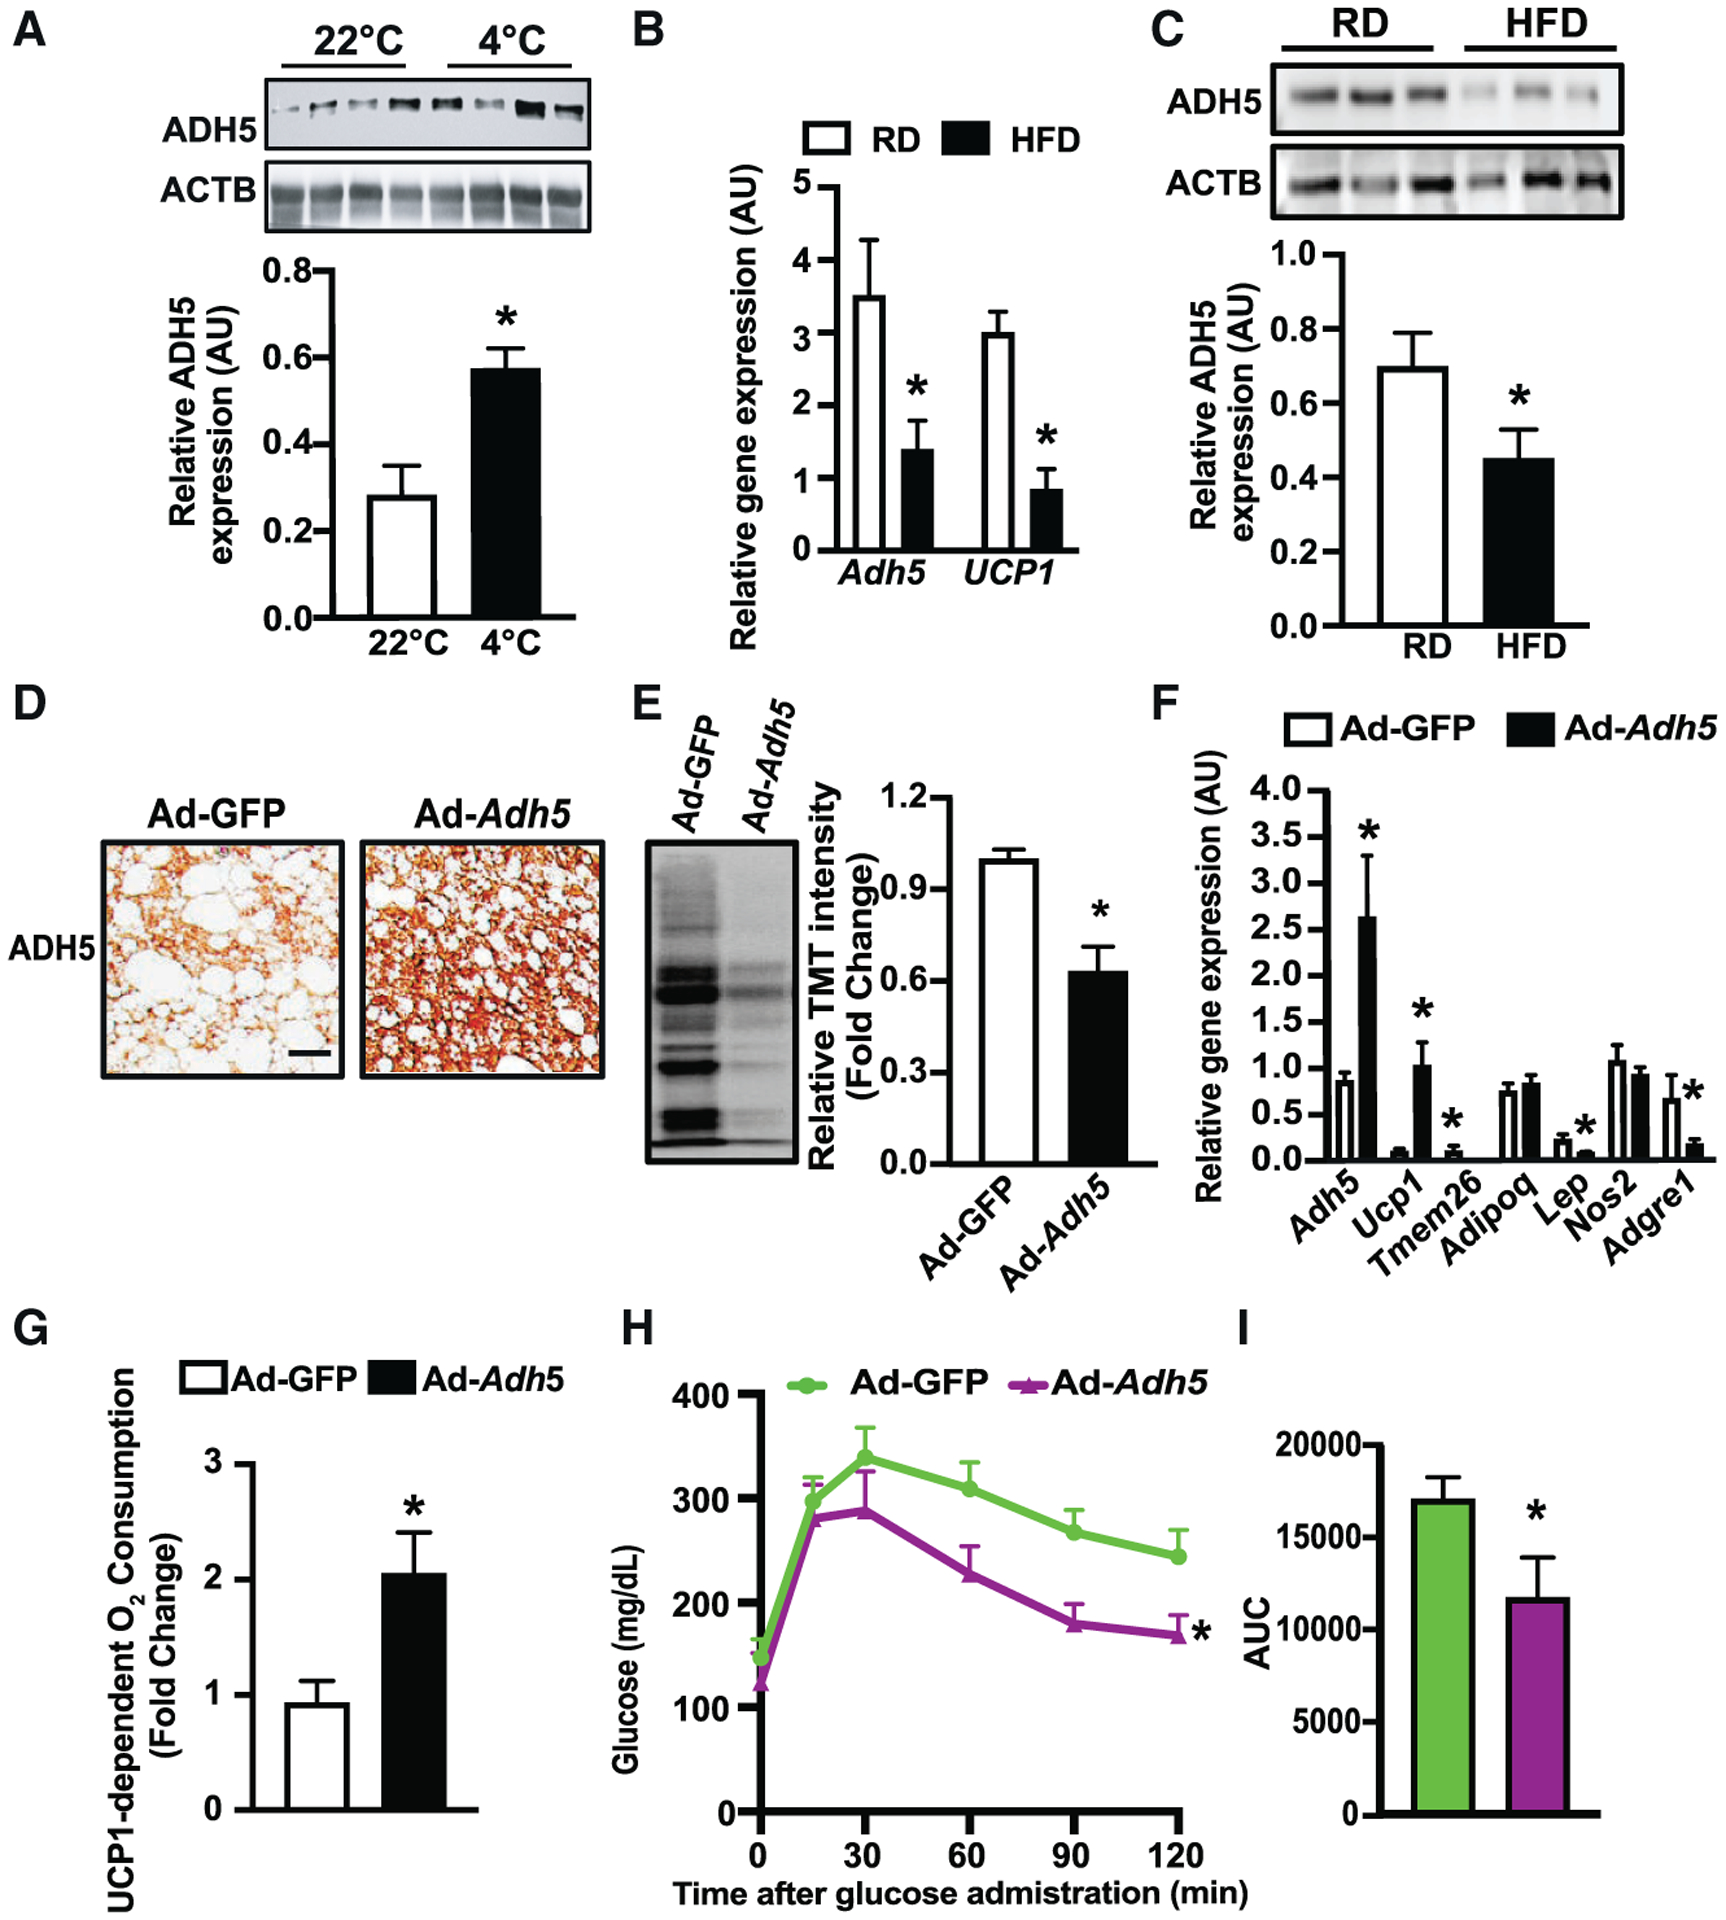
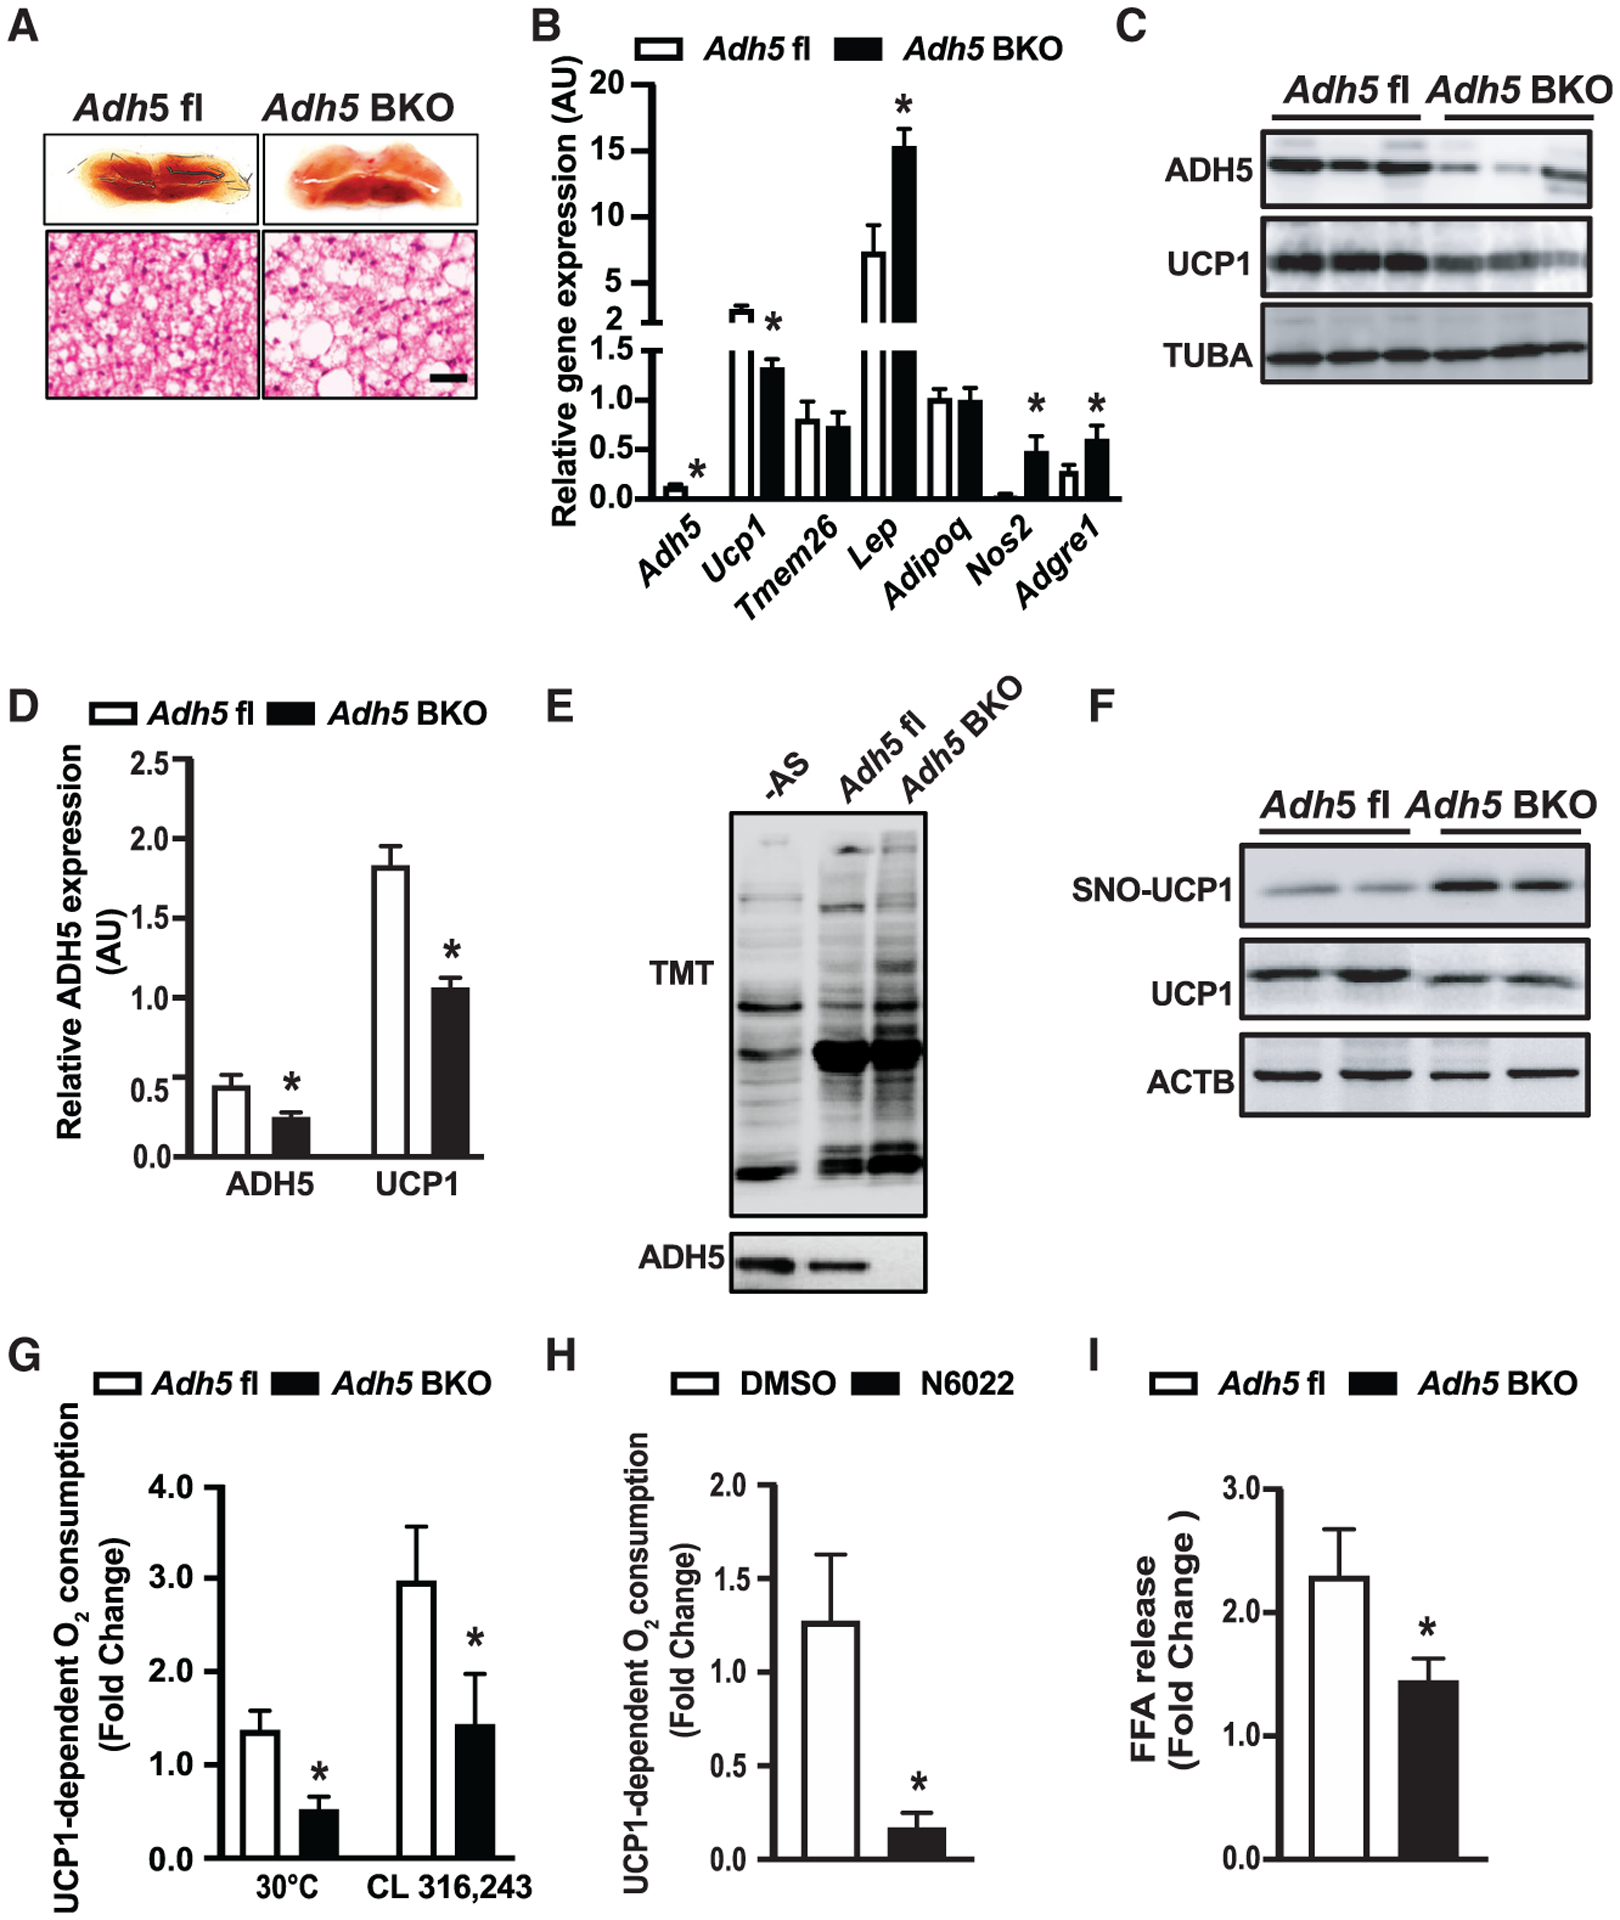
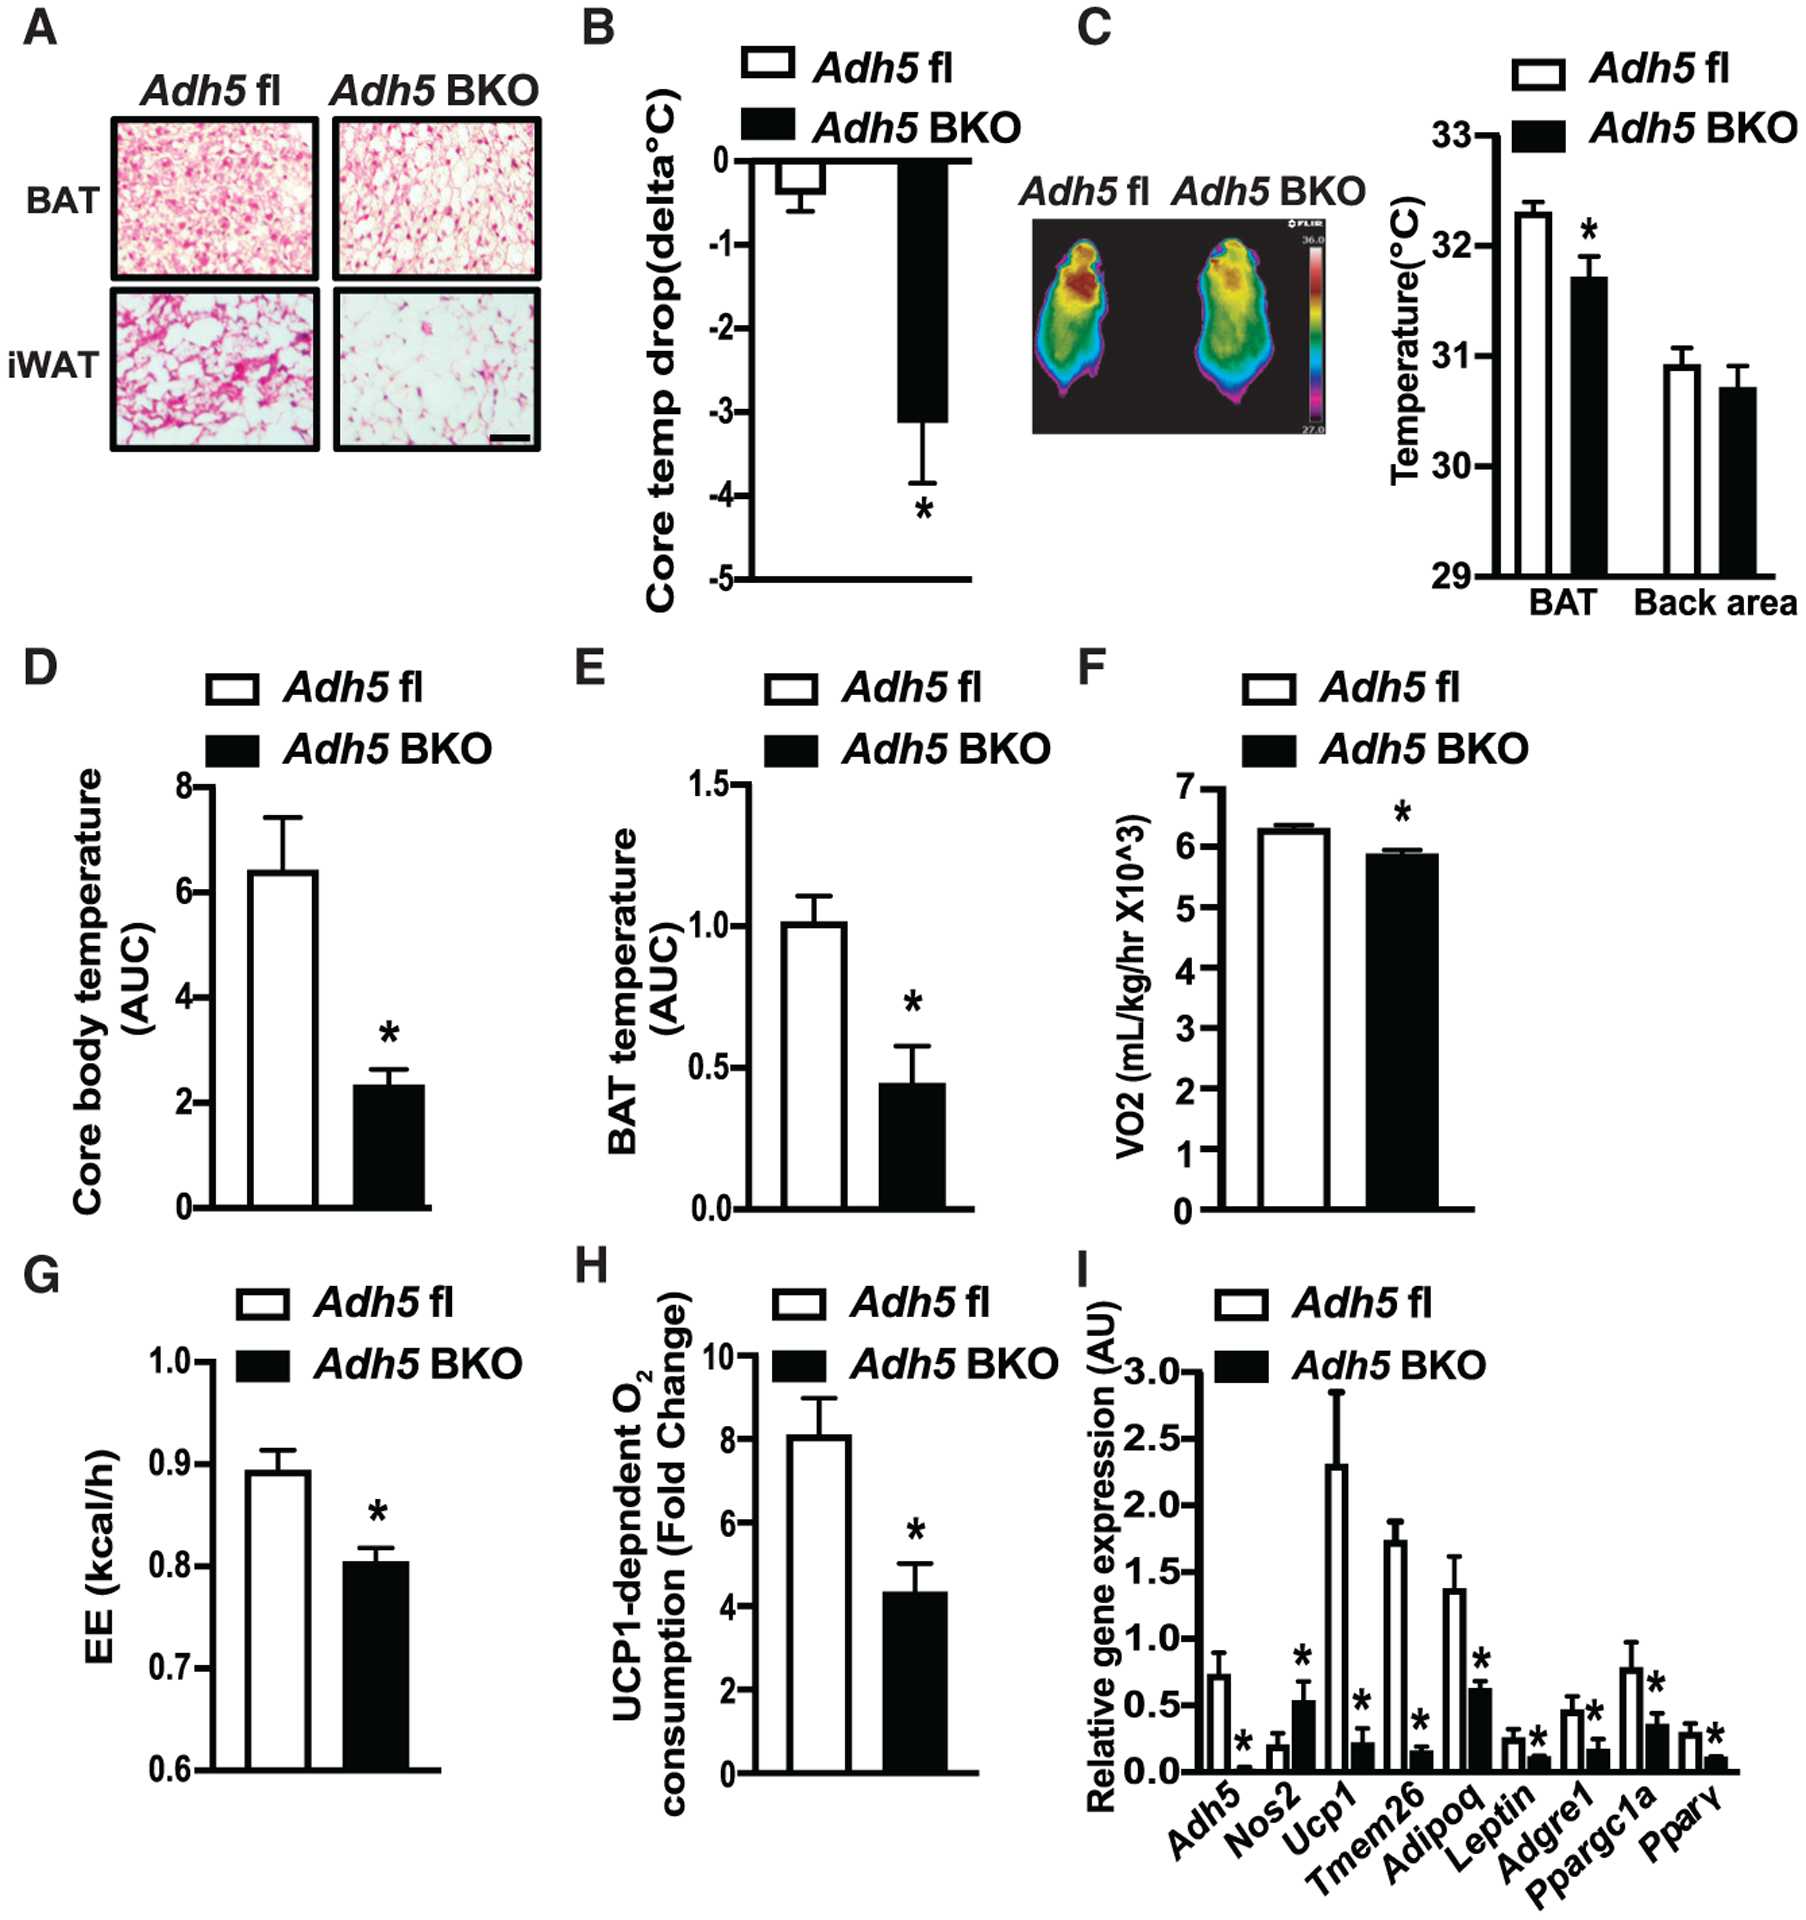
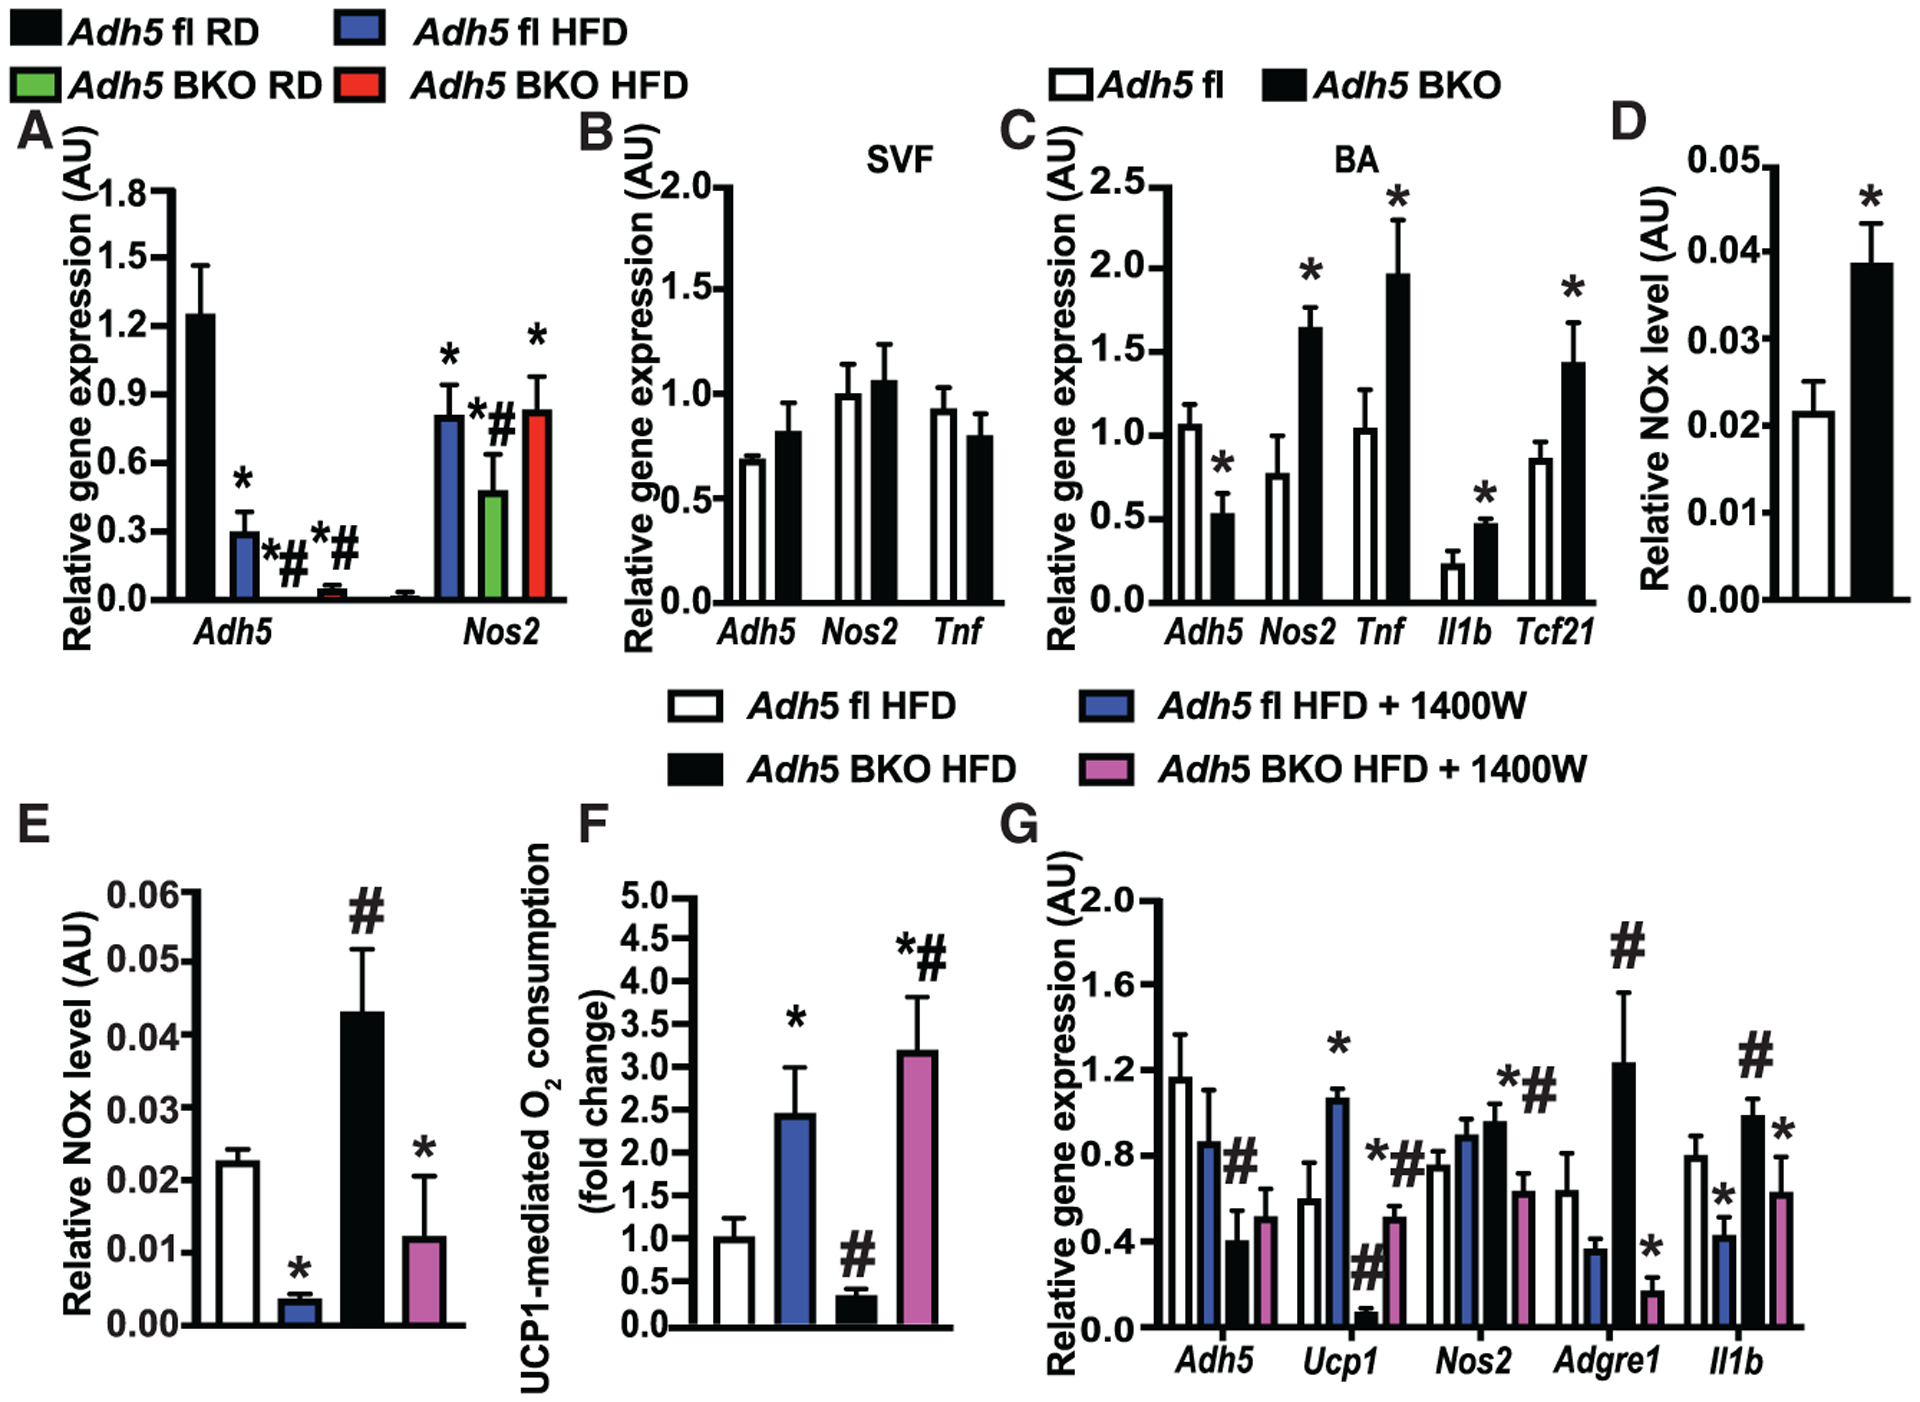
Brown adipose tissue (BAT) thermogenic activity is tightly regulated by cellular redox status, but the underlying molecular mechanisms are incompletely understood. Protein S-nitrosylation, the nitric-oxide-mediated cysteine thiol protein modification, plays important roles in cellular redox regulation. Here we show that diet-induced obesity (DIO) and acute cold exposure elevate BAT protein S-nitrosylation, including UCP1. This thermogenic-induced nitric oxide bioactivity is regulated by S-nitrosoglutathione reductase (GSNOR; alcohol dehydrogenase 5 [ADH5]), a denitrosylase that balances the intracellular nitroso-redox status. Loss of ADH5 in BAT impairs cold-induced UCP1-dependent thermogenesis and worsens obesity-associated metabolic dysfunction. Mechanistically, we demonstrate that Adh5 expression is induced by the transcription factor heat shock factor 1 (HSF1), and administration of an HSF1 activator to BAT of DIO mice increases Adh5 expression and significantly improves UCP1-mediated respiration. Together, these data indicate that ADH5 controls BAT nitroso-redox homeostasis to regulate adipose thermogenesis, which may be therapeutically targeted to improve metabolic health.

Keywords: ADH5; BAT; HSF1; alcohol dehydrogenase 5; brown adipose tissue; heat shock factor 1; nitrosative stress; obesity.


Conflict of interest statement

Declaration of interests The authors declare no competing interests.

Figures

Figure 1.
Figure 1.. Diet-induced obesity (DIO) elevates nitrosative stress in brown adipose tissue (BAT)
(A and B) Western blots and densitometric analysis of protein S-nitrosylation (SNO) in interscapular BAT (iBAT) from mice fed a regular diet (RD) or high-fat diet (HFD) for 10 weeks. (−) AS, no ascorbate (negative control for S-nitrosylation detection); (+) SNAP, positive control for SNO detection. n = 4–5 mice/group. Data were normalized to actin beta (ACTB) input. (C) Relative nitrite/nitrate NOx release from supernatants of BAT explants isolated from mice on a RD (n = 8 mice) or HFD (n = 11 mice) for 10 weeks. (D) High-resolution respirometry in fresh BAT from mice in (A) (n = 4 mice/group). The UCP1-mediated respiration was calculated and reported as fold change of GDP-inhibited leak respiration (1 mM) over baseline. (E and F) Western blots and quantification of SNO in interscapular iBAT mice exposed to thermoneutrality (TN; 30°C for 1 week), room temperature (RT; 22°C), or cold (4°C, 24 h). n = 3–6 mice/group. Data were normalized to ACTB input. (G and H) Predicted SNO sites on mouse UCP1 and mapped SNO sites on human UCP1. (I) High-resolution respirometry in human brown adipocytes transiently transfected with control plasmid (CT; pcDNA-EGFP), UCP1WT, or UCP1C305A. Cells were treated with 1 μM isoproterenol (ISO) (2 h) in the presence or absence of 100 μM SNAP (2 h). The UCP1-mediated respiration was presented as fold change of GDP-inhibited leak (1 mM) over ISO-mediated baseline. n = 3 independent experiments. (J and K) Representative western blots and densitometric analysis of S-nitrosylated proteins in BAT from mice on a RD and HFD for 8 weeks. In western blots, each lane represents an individual mouse. Data were normalized to UCP1 input. All data are presented as means ± SEM. Asterisk indicates statistical significance compared to the RD groups (B–D and K), the 30°C group (F), and the CT groups (I). Number sign indicates statistical significance between 22°C and 4°C (F) and effect of SNAP in same cells (I). Statistical significance was determined by Student’s t test (B–D) and (K) and one-way ANOVA (F and I); p < 0.05).
Figure 2.
Figure 2.. ADH5 protects metabolic dysfunction of BAT in the context of obesity
(A) Representative western blots and densitometric analysis of tested proteins in BAT from mice exposed to 22°C or 4°C for 24 hr. Data were normalized to expression of ACTB (n = 4 mice/group). (B) Levels of mRNAs encoding the indicated genes in BAT from mice fed a RD (n = 3 mice) or HFD for 12 weeks (n = 5 mice), data were normalized to the expression of Hprt. (C) Representative western blots and densitometric analyses in BAT from mice fed a RD or HFD for 12 weeks (n = 9–10 mice/group). Data were normalized to the expression of ACTB. (D) Representative images (20×) of immunohistochemistry of ADH5 in BAT from mice on a HFD for 8 weeks followed by interscapular transduction of Adeno-GFP (n = 7 mice) or Adeno-Adh5 (n = 5 mice) (2.5 × 10⁹ pfu/mouse) for additional 2 weeks. Scale bar, 10 μm. (E) Representative western and quantification of protein SNO in iBAT from mice in (D). n = 4 mice/group. (F) Levels of mRNAs encoding the indicated genes. Gene expression was normalized to Gapdh. n = 3–5 mice/group. (G) UCP1-dependent O2 consumption rates in BAT from mice in (D). n = 4 mice/group. (H) Glucose tolerance tests (GTTs) and (I). AUC in mice in (D). All data are presented as means ± SEM. Asterisk indicates statistical significance compared to 22°C (A), the RD groups (B and C), and the Adeno-GFP group (E–I), as determined by Student’s t test; p < 0.05.
Figure 3.
Figure 3.. Deletion of Adh5 impairs metabolic function of BAT.
(A) Representative light microscopy and H&E images of BAT from Adh5fl or Adh5BKO mice raised at 22°C. Scale bar, 10 μm. (B) Levels of mRNAs encoding the indicated genes in BAT from mice in (A). Expression is normalized to Gapdh. n = 3–5 mice/group. (C and D) Representative western blots (C) and densitometric analysis (D) of ADH5 and UCP1 expression in BAT from Adh5fl and Adh5BKO mice. Expression is normalized to that of TUBA (TUBULIN). n = 4–5 mice/group. (E and F) Representative western blots of general SNO (E) and S-nitrosylated UCP1 (F) in BAT from mice in (A). (G and H) UCP1-dependent O2 consumption in BAT from Adh5fl and Adh5BKO mice maintained at 30°C (n = 3−4 mice/group) (G) or administrated with the β3-AR agonist CL316,243 (0.5 mg/kg; n = 4−5 mice/group) (H) in BAT from wild-type (WT) mice maintained at 30°C following treatment with the ADH5 inhibitor, N6022 (20 μM for 24 h), or vehicle (DMSO, 0.2%). n = 5 mice/group. (I) Free fatty acid release measured in BAT explants from mice exposed to DMSO (0.1%) or ISO (1 μM; 1 h). Data were normalized to protein concentration. n = 5–6 mice/group. All data are presented as means ± SEM. Asterisk indicates statistical significance compared to the Adh5fl groups (B, D, G, and I) and the vehicle group (H), as determined by Student’s t test; p < 0.05.
Figure 4.
Figure 4.. ADH5 is required for cold-induced BAT thermogenesis
(A and B) Representative H&E images from BAT or iWAT (A) and cold tolerance from Adh5fl and Adh5BKO mice housed at 30°C following cold exposure to 4°C for 24 h (B). Data are presented as difference in core body temperature between 30°C and 4°C. n = 3–5 mice group. Scale bar, 100 μm. (C) Representative high-resolution infrared images of body surface temperature of Adh5fl and Adh5BKO mice. Quantification of the images is shown by the side of image. n = 5 mice/group. (D–G) Core temperature (AUC, area under the curve of dark cycles) (D), BAT temperature (AUC of dark cycles) (E), whole-body VO2 (F), and whole-body energy expenditure (EE) (G) measured in Adh5fl and Adh5BKO mice housed within a CLAMS at 4°C (n = 4–5 mice/group). (H) UCP1-dependent O2 consumption in BAT from mice in (B). n = 4 mice/group. (I) qPCR analysis measuring levels of mRNAs encoding the indicated genes in BAT from mice in (B). Expression was normalized to Gapdh. All data are presented as means ± SEM. Asterisk indicates statistical significance compared to the Adh5fl group as determined by Student’s t test; p <0.05.
Figure 5.
Figure 5.. Obesity impairs HSF1-mediated Adh5 activation leading to BAT metabolic dysfunction
(A) Body composition of Adh5fl and Adh5BKO mice on a HFD (8 weeks), measured by nuclear magnetic resonance (NMR; n = 7 mice/group). (B and C) GTT (B) and AUC (C) from Adh5fl and Adh5BKO mice on a RD or HFD. n = 11–12 mice/group. (D and E) Whole-body VO2 (D) and HFD-mediated high-resolution respirometry analysis in BAT (E). n = 4–5 mice/group. (F) Insulin signaling in BAT as in (A). p-AKT: AKTSer473. Densitometric analysis is shown under the blots, and data are normalized to ACTB. n = 3 mice/group. (G) Activity of the Adh5 promoter in HEK293A cells 48 h after transfection. Control cells (CT), PGL4.10 vector. Data were normalized to Renilla luciferase with schematic representation of conserved HSF1-binding sequences identified in the promoter regions of Adh5 using Japan Automotive Software Platform and Architecture (JASPAR) on top. (H) Representative western blots and densitometric analysis of nuclear HSF1 expression from BAT (RD or HFD for 16 weeks; n = 6–8 mice/group). Expression was normalized to Lamin A/C (LMNA). (I) High-resolution respirometry analysis in BAT (HFD for 10 weeks) followed by interscapular treatment with vehicle (DMSO; n = 4 mice) or an HSF1 activator (1 mM; n = 7 mice) every other day for 2 weeks. UCP1-mediated respiration was calculated and reported as fold change of GDP-inhibited leak (1 mM) over baseline. All data are presented as means ± SEM. Asterisk indicates statistical significance compared to the Adh5fl groups (C–E), the CT group (G), or the RD groups (H), and treatment effects in same type of mice (I). Number sign indicates genetic effects in mice with same treatment (C and I) and statistical significance compared to WT (G). Statistical significance was determined by one-way ANOVA (B, C, G, and I) and Student’s t test (D–F and H); p < 0.05.
Figure 6.
Figure 6.. Inhibiting iNOS improves metabolic homeostasis in BAT from ADH5BKO mice
(A) qRT-PCR analysis measuring levels of mRNAs encoding the indicated genes in BAT from Adh5fl and Adh5BKO mice fed a RD or HFD for 16 weeks. n = 4 mice/group. (B and C) qRT-PCR analysis measuring levels of mRNAs encoding the indicated genes from SVF (B), and mature brown adipocytes (C) isolated from brown adipose tissues of Adh5fl and Adh5BKO mice (n = 6 mice/group; 10 weeks HFD). Data were normalized to Gapdh. (D) Total nitrite/nitrate NOx release from mature brown adipocytes from mice in (B) and (C). Data were normalized to protein level. (E and F) Total nitrite/nitrate NOx release (E) and high-resolution respirometry analysis from BAT explants (F) in mice (fed a HFD for 12 weeks) interscapularly injected with DMSO control or 1400W (0.2 mg/kg) every 2 days for 3 weeks. n = 7–12 mice/group. (G) qRT-PCR analysis measuring levels of mRNAs encoding the indicated genes in BAT from mice in (F). Expression was normalized to Gapdh. All data are presented as mean ± SEM. Asterisk indicates statistical significance compared to the Adh5fl RD groups (A) or the Adh5fl group (C and D) and treatment effects in mice with same genotype (E–G). Number sign indicates genetic effects in mice with same treatments (A and E–G). Statistical significance was determined by two-way ANOVA followed by Tukey’s multiple comparison (A and E–G) and Student’s t test (B–D); p < 0.05.

References

    1. Alcalá M, Calderon-Dominguez M, Bustos E, Ramos P, Casals N, Serra D, Viana M, and Herrero L (2017). Increased inflammation, oxidative stress and mitochondrial respiration in brown adipose tissue from obese mice. Sci. Rep 7, 16082. - PMC - PubMed
    1. Alcalá M, Calderon-Dominguez M, Serra D, Herrero L, and Viana M (2019). Mechanisms of Impaired Brown Adipose Tissue Recruitment in Obesity. Front. Physiol 10, 94. - PMC - PubMed
    1. Altshuler-Keylin S, Shinoda K, Hasegawa Y, Ikeda K, Hong H, Kang Q, Yang Y, Perera RM, Debnath J, and Kajimura S (2016). Beige Adipocyte Maintenance Is Regulated by Autophagy-Induced Mitochondrial Clearance. Cell Metab. 24, 402–419. - PMC - PubMed
    1. Ayyappan JP, and Nagajyothi JF (2017). Diet Modulates Adipose Tissue Oxidative Stress in a Murine Acute Chagas Model. JSM Atheroscler. 2, 1030. - PMC - PubMed
    1. Balkow A, Hoffmann LS, Klepac K, Glöde A, Gnad T, Zimmermann K, and Pfeifer A (2016). Direct lentivirus injection for fast and efficient gene transfer into brown and beige adipose tissue. J. Biol. Methods 3, e48. - PMC - PubMed

Publication types

MeSH terms